1949 Austrian legislative election
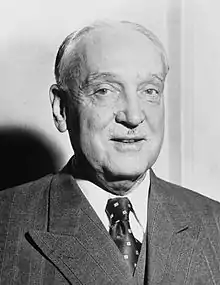
The elections to the Austrian National Council of 1949 were the second nationwide elections in Austria after World War II. About 500,000 registered Nazis, who were not allowed to vote in 1945, regained their voting rights. A newly created party, the Electoral Party of Independents (WdU) (a predecessor of the Freedom Party of Austria) specifically targeted this group of voters and immediately won a large share of votes.[1] The Austrian People's Party remained strongest party, although losing their absolute majority of seats. Leopold Figl stayed as Chancellor, leading a coalition with the Socialist Party of Austria as junior partner.[2]
| |||||||||||||||||||||||||||||||||||||||||||||||||||||||||||||||||
165 seats in the National Council of Austria 83 seats needed for a majority | |||||||||||||||||||||||||||||||||||||||||||||||||||||||||||||||||
|---|---|---|---|---|---|---|---|---|---|---|---|---|---|---|---|---|---|---|---|---|---|---|---|---|---|---|---|---|---|---|---|---|---|---|---|---|---|---|---|---|---|---|---|---|---|---|---|---|---|---|---|---|---|---|---|---|---|---|---|---|---|---|---|---|---|
| |||||||||||||||||||||||||||||||||||||||||||||||||||||||||||||||||
| |||||||||||||||||||||||||||||||||||||||||||||||||||||||||||||||||
| This article is part of a series on the |
| Politics of Austria |
|---|
 |
Results
| Parties | Votes | +/- | % | +/- | Seats | +/- | |
|---|---|---|---|---|---|---|---|
| Austrian People's Party (Österreichische Volkspartei) | 1,846,581 | +244,354 | 44.03 | -5.77 | 77 | -8 | |
| Socialist Party of Austria (Sozialistische Partei Österreichs) | 1,623,524 | +188,626 | 38.71 | -5.89 | 67 | -9 | |
| Electoral Party of Independents (Wahlpartei der Unabhängigen) | 489,273 | * | 11.67 | * | 16 | * | |
| Communist Party of Austria and Left Socialists (Kommunistische Partei Österreichs und Linkssozialisten) | 213,066 | +48,809 | 5.08 | -0.34 | 5 | +1 | |
| Democratic Union (Demokratische Union) | 12,059 | * | 0.28 | * | 0 | * | |
| Vierte Partei (Fourth Party) | 7,134 | * | 0.17 | * | 0 | * | |
| Democratic Front of the Working People (Demokraticna fronta delovnegna ljudstva ) | 2,088 | * | 0.05 | * | 0 | * | |
| Democratic Party of Austria | 5 | * | 0.0 | * | 0 | * | |
| Economic Party of House and Property Owners | 3 | * | 0.0 | * | 0 | * | |
| Austrian Patriotic Party | 0 | * | 0.0 | * | 0 | * | |
| Invalid/blank votes | 56,883 | – | – | – | – | – | |
| Total (turnout 96.8%) | 4,250,616 | 100.0 | 165 | ||||
| Notes: * Did not stand in previous election | |||||||
| Source: Nohlen, D & Stöver, P (2010). Elections in Europe: A data handbook. p. 213. | |||||||
References
- Documentation Archive of Austrian Resistance: The Development of Right-Wing Extremism After 1945 Archived January 17, 2010, at the Wayback Machine, retrieved 19 May 2010
- Austrian Chancellery - Austrian Cabinets since 1945 Archived 2013-12-26 at the Wayback Machine, retrieved 19 May 2010
This article is issued from Wikipedia. The text is licensed under Creative Commons - Attribution - Sharealike. Additional terms may apply for the media files.

