1949 Canadian federal election
The 1949 Canadian federal election was the 21st general election in Canadian history. It was held June 27, 1949 to elect members of the House of Commons of Canada of the 21st Parliament of Canada.
| |||||||||||||||||||||||||||||||||||||||||||||||||||||||||||||||||||||||
262 seats in the House of Commons 132 seats needed for a majority | |||||||||||||||||||||||||||||||||||||||||||||||||||||||||||||||||||||||
|---|---|---|---|---|---|---|---|---|---|---|---|---|---|---|---|---|---|---|---|---|---|---|---|---|---|---|---|---|---|---|---|---|---|---|---|---|---|---|---|---|---|---|---|---|---|---|---|---|---|---|---|---|---|---|---|---|---|---|---|---|---|---|---|---|---|---|---|---|---|---|---|
| Turnout | 73.8%[1] ( | ||||||||||||||||||||||||||||||||||||||||||||||||||||||||||||||||||||||
| |||||||||||||||||||||||||||||||||||||||||||||||||||||||||||||||||||||||
 | |||||||||||||||||||||||||||||||||||||||||||||||||||||||||||||||||||||||
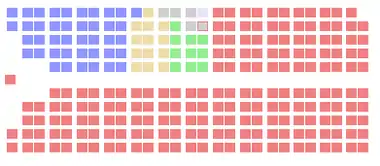 The Canadian parliament after the 1949 election | |||||||||||||||||||||||||||||||||||||||||||||||||||||||||||||||||||||||
| |||||||||||||||||||||||||||||||||||||||||||||||||||||||||||||||||||||||
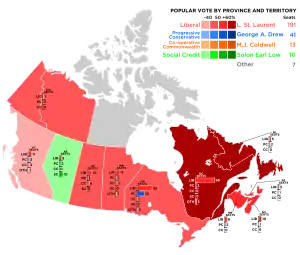
The Liberal Party was re-elected with its fourth consecutive government, winning 191 seats (73 percent of the seats in the House of Commons), with less than 50 percent of the popular vote.
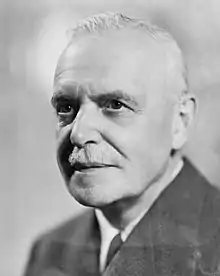
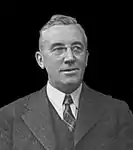
It was the first election in almost thirty years in which the Liberal Party of Canada was not led by William Lyon Mackenzie King. King had retired in 1948, and was replaced as Liberal leader and Prime Minister by Louis St. Laurent.
It was the first federal election with Newfoundland voting, having joined Canada in March of that year. It was also the first election since 1904 in which the remaining parts of the Northwest Territories were granted representation, following the partitioning off of the provinces of Alberta and Saskatchewan.
The Liberal Party victory was the largest majority in Canadian history to that point. As of 2021, it remains the third largest majority government in Canadian history, and the largest in the party's history.
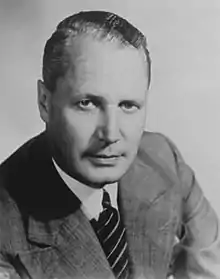
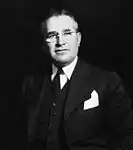
The Progressive Conservative Party, led by former Premier of Ontario George Drew, gained little ground in this election. The party lost over a third of their seats.
Smaller parties, such as the social democratic Co-operative Commonwealth Federation, and Social Credit, a party that advocated monetary reform, lost support to the Liberals, and to a lesser extent, the Conservatives.
National results
 | ||||||
| ↓ | ||||||
| 191 | 41 | 13 | 10 | 7 | ||
| Liberal | PC | CCF | SC | O | ||
| Party | Party leader | # of candidates |
Seats | Popular vote | |||||
|---|---|---|---|---|---|---|---|---|---|
| 1945 | Elected | % Change | # | % | Change | ||||
| Liberal | Louis St. Laurent | 258 | 117 | 191 | +63.2% | 2,874,813 | 49.15% | +9.37pp | |
| Progressive Conservative | George Drew | 249 | 65 | 41 | -21.5% | 1,734,261 | 29.65% | +2.03pp | |
| Co-operative Commonwealth | M.J. Coldwell | 180 | 28 | 13 | -53.6% | 784,770 | 13.42% | -2.13pp | |
| Social Credit | Solon Low | 28 | 13 | 10 | -23.1% | 135,217 | 2.31% | -1.74pp | |
| Independent | 28 | 6 | 4 | -33.3% | 119,827 | 2.05% | -2.84pp | ||
| Independent Liberal | 15 | 8 | 1 | -87.5% | 30,407 | 0.52% | -1.27pp | ||
| Liberal-Labour | 2 | - | 1 | 11,730 | 0.20% | +0.19pp | |||
| Liberal–Progressive | 1 | 1 | 1 | - | 9,192 | 0.16% | +0.04pp | ||
| Union of Electors | Réal Caouette | 56 | - | - | - | 86,087 | 1.47% | +1.46pp | |
| Labor–Progressive | Tim Buck | 17 | 1 | - | -100% | 32,623 | 0.56% | -1.58pp | |
| Independent PC | 6 | 1 | - | -100% | 8,195 | 0.14% | -0.14pp | ||
| Farmer-Labour | 1 | - | - | - | 6,161 | 0.11% | -0.07pp | ||
| National Unity | Adrien Arcand | 1 | * | - | * | 5,590 | 0.10% | * | |
| Nationalist | 1 | * | - | * | 4,994 | 0.09% | * | ||
| Independent Social Credit | 2 | * | - | * | 4,598 | 0.08% | * | ||
| Labour | 2 | - | - | - | 415 | 0.01% | x | ||
| Socialist Labour | 1 | * | - | * | 271 | x | * | ||
| Total | 851 | 245 | 262 | +7.8% | 5,849,151 | 100% | |||
| Sources: http://www.elections.ca -- History of Federal Ridings since 1867 | |||||||||
Notes:
* The party did not nominate candidates in the previous election.
x - less than 0.005% of the popular vote
Vote and seat summaries
Results by province
| Party name | BC | AB | SK | MB | ON | QC | NB | NS | PE | NL | Terr | Total | ||
|---|---|---|---|---|---|---|---|---|---|---|---|---|---|---|
| Liberal | Seats: | 11 | 5 | 14 | 11 | 55 | 68 | 8 | 10 | 3 | 5 | 1 | 191 | |
| Popular Vote: | 36.7 | 33.8 | 43.4 | 45.1 | 45.1 | 60.4 | 53.8 | 52.7 | 49.2 | 71.9 | 49.0 | 49.1 | ||
| Progressive Conservative | Seats: | 3 | 2 | 1 | 1 | 25 | 2 | 2 | 2 | 1 | 2 | - | 41 | |
| Vote: | 27.9 | 16.8 | 14.4 | 22.0 | 37.4 | 24.5 | 39.4 | 37.5 | 48.4 | 27.9 | 29.7 | |||
| Co-operative Commonwealth | Seats: | 3 | - | 5 | 3 | 1 | - | - | 1 | - | - | - | 13 | |
| Vote: | 31.5 | 10.0 | 40.9 | 25.9 | 15.2 | 1.1 | 4.2 | 9.9 | 2.4 | 0.2 | 17.0 | 13.4 | ||
| Social Credit | Seats: | - | 10 | - | - | 10 | ||||||||
| Vote: | 0.5 | 37.4 | 0.9 | 0.2 | 2.3 | |||||||||
| Independent | Seats: | 1 | - | - | 3 | - | 4 | |||||||
| Vote: | 2.6 | 2.1 | 0.1 | 6.1 | 0.2 | 34.0 | 2.1 | |||||||
| Independent Liberal | Seats: | 1 | - | - | 1 | |||||||||
| Vote: | 0.3 | 1.3 | 1.4 | 0.5 | ||||||||||
| Liberal-Labour | Seats: | 1 | - | 1 | ||||||||||
| Vote: | 0.6 | xx | 0.2 | |||||||||||
| Liberal-Progressive | Seats: | 1 | 1 | |||||||||||
| Vote: | 2.9 | 0.2 | ||||||||||||
| Total Seats | 18 | 17 | 20 | 16 | 83 | 73 | 10 | 13 | 4 | 7 | 1 | 262 | ||
| Parties that won no seats: | ||||||||||||||
| Union of Electors | Vote: | 0.1 | 5.1 | 1.0 | 1.5 | |||||||||
| Labor–Progressive | Vote: | 0.8 | 0.7 | 0.4 | 2.0 | 0.7 | 0.3 | 0.6 | ||||||
| Independent PC | Vote: | xx | 0.5 | 0.1 | ||||||||||
| Farmer-Labour | Vote: | 0.3 | 0.1 | |||||||||||
| National Unity | Vote: | 0.4 | 0.1 | |||||||||||
| Nationalist | Vote: | 0.3 | 0.1 | |||||||||||
| Independent Social Credit | Vote: | 1.4 | 0.1 | |||||||||||
| Labour | Vote: | xx | xx | xx | ||||||||||
| Socialist Labour | Vote: | xx | xx | |||||||||||
- xx - less than 0.05% of the popular vote
See also
References
- "Voter Turnout at Federal Elections and Referendums". Elections Canada. Retrieved 10 March 2019.