1953 Canadian federal election
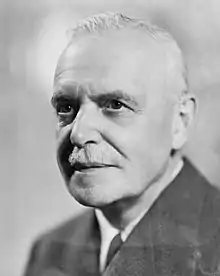
The 1953 Canadian federal election was held on August 10 to elect members of the House of Commons of Canada of the 22nd Parliament of Canada. Prime Minister Louis St. Laurent led his Liberal Party of Canada to its fifth consecutive majority government, although the party lost seats to the other parties.
| |||||||||||||||||||||||||||||||||||||||||||||||||||||||||||||||||||||||
265 seats in the House of Commons 133 seats needed for a majority | |||||||||||||||||||||||||||||||||||||||||||||||||||||||||||||||||||||||
|---|---|---|---|---|---|---|---|---|---|---|---|---|---|---|---|---|---|---|---|---|---|---|---|---|---|---|---|---|---|---|---|---|---|---|---|---|---|---|---|---|---|---|---|---|---|---|---|---|---|---|---|---|---|---|---|---|---|---|---|---|---|---|---|---|---|---|---|---|---|---|---|
| Turnout | 67.5%[1] ( | ||||||||||||||||||||||||||||||||||||||||||||||||||||||||||||||||||||||
| |||||||||||||||||||||||||||||||||||||||||||||||||||||||||||||||||||||||
 | |||||||||||||||||||||||||||||||||||||||||||||||||||||||||||||||||||||||
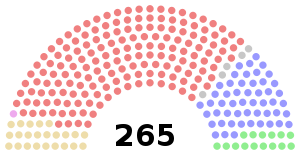
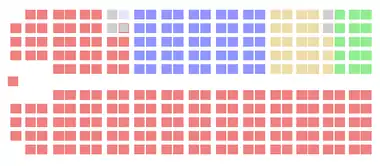 The Canadian parliament after the 1953 election | |||||||||||||||||||||||||||||||||||||||||||||||||||||||||||||||||||||||
| |||||||||||||||||||||||||||||||||||||||||||||||||||||||||||||||||||||||
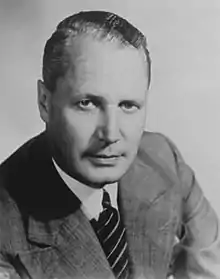
The Progressive Conservative Party, led by former Premier of Ontario, George Drew, formed the official opposition.
National results
 | ||||||
| ↓ | ||||||
| 169 | 51 | 23 | 15 | 7 | ||
| Liberal | PC | CCF | SC | O | ||
| Party | Party leader | # of candidates |
Seats | Popular vote | |||||
|---|---|---|---|---|---|---|---|---|---|
| 1949 | Elected | % Change | # | % | pp Change | ||||
| Liberal | Louis St. Laurent | 262 | 191 | 169 | -11.5% | 2,731,633 | 48.43% | -0.72 | |
| Progressive Conservative | George Drew | 248 | 41 | 51 | +24.4% | 1,749,579 | 31.02% | +1.37 | |
| Co-operative Commonwealth | M.J. Coldwell | 170 | 13 | 23 | +76.9% | 636,310 | 11.28% | -2.14 | |
| Social Credit | Solon Low | 71 | 10 | 15 | +50% | 304,553 | 5.40% | +3.09 | |
| Independent | 14 | 4 | 3 | -25.0% | 58,458 | 1.04% | -1.01 | ||
| Independent Liberal | 19 | 1 | 2 | +100% | 68,506 | 1.21% | +0.69 | ||
| Liberal-Labour1 | 1 | 1 | 1 | - | 11,380 | 0.20% | - | ||
| Liberal–Progressive | 1 | 1 | 1 | - | 8,958 | 0.16% | - | ||
| Labor–Progressive | Tim Buck | 100 | - | - | - | 59,622 | 1.06% | +0.50 | |
| Nationalist | Adrien Arcand | 1 | * | - | * | 7,496 | 0.13% | * | |
| Independent Progressive Conservative | 3 | - | - | - | 1,636 | 0.03% | -0.11 | ||
| Christian Liberal | 1 | * | - | * | 1,505 | 0.03% | * | ||
| Independent Social Credit | 1 | - | - | - | 422 | 0.01% | -0.07 | ||
| Locataire (candidat) | 1 | * | - | * | 417 | 0.01% | * | ||
| Anti-Communist | 1 | * | - | * | 333 | 0.01% | * | ||
| Socialist Labour | 1 | - | - | - | 130 | x | x | ||
| Total | 897 | 262 | 265 | +1.1% | 5,640,938 | 100% | |||
| Sources: http://www.elections.ca History of Federal Ridings since 1867 | |||||||||
Notes:
* - not applicable - the party was not recognized in the previous election
x - less than 0.005% of the popular vote
1 The Liberal-Labour MP sat with the Liberal caucus.
Vote and seat summaries
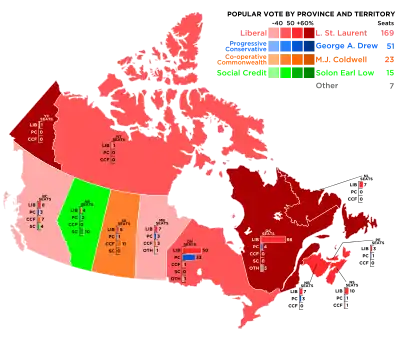
Results by province
| Party name | BC | AB | SK | MB | ON | QC | NB | NS | PE | NL | NW | YK | Total | ||
|---|---|---|---|---|---|---|---|---|---|---|---|---|---|---|---|
| Liberal | Seats: | 8 | 4 | 5 | 7 | 50 | 66 | 7 | 10 | 3 | 7 | 1 | 1 | 169 | |
| Vote (%): | 30.9 | 35.1 | 37.3 | 37.0 | 46.0 | 61.0 | 52.7 | 53.0 | 51.1 | 67.2 | 49.4 | 78.7 | 48.4 | ||
| Progressive Conservative | Seats: | 3 | 2 | 1 | 3 | 33 | 4 | 3 | 1 | 1 | 0 | - | - | 51 | |
| Vote (%): | 14.1 | 14.5 | 11.7 | 27.0 | 40.3 | 29.4 | 41.9 | 40.1 | 48.0 | 28.1 | 38.5 | 21.3 | 31.0 | ||
| Co-operative Commonwealth | Seats: | 7 | - | 11 | 3 | 1 | - | - | 1 | - | - | 23 | |||
| Vote (%): | 26.6 | 6.9 | 44.2 | 23.6 | 11.1 | 1.5 | 3.0 | 6.7 | 0.8 | 0.6 | 11.3 | ||||
| Social Credit | Seats: | 4 | 11 | - | - | - | - | 15 | |||||||
| Vote (%): | 26.1 | 40.7 | 5.3 | 6.3 | 0.3 | 0.4 | 5.4 | ||||||||
| Independent | Seats: | - | - | - | 3 | - | - | 3 | |||||||
| Vote (%): | 0.1 | 0.2 | 0.3 | 3.0 | 4.0 | 12.4 | 1.0 | ||||||||
| Independent Liberal | Seats: | - | - | 2 | - | 2 | |||||||||
| Vote (%): | 4.0 | 0.3 | 3.7 | 1.9 | 1.2 | ||||||||||
| Liberal–Labour | Seats: | 1 | 1 | ||||||||||||
| Vote (%): | 0.6 | 0.2 | |||||||||||||
| Liberal-Progressive | Seats: | 1 | 1 | ||||||||||||
| Vote (%): | 3.3 | 0.2 | |||||||||||||
| Total Seats | 22 | 17 | 17 | 14 | 85 | 75 | 10 | 12 | 4 | 7 | 1 | 1 | 265 | ||
| Parties that won no seats: | |||||||||||||||
| Labor–Progressive | Vote (%): | 2.2 | 2.7 | 1.1 | 2.3 | 1.0 | 0.7 | 0.2 | 1.1 | ||||||
| Nationalist | Vote (%): | 0.5 | 0.1 | ||||||||||||
| Independent PC | Vote (%): | 0.1 | xx | ||||||||||||
| Christian Liberal | Vote (%): | 0.1 | xx | ||||||||||||
| Independent Social Credit | Vote (%): | 0.1 | xx | ||||||||||||
| Locataire (candidat) | Vote (%): | xx | xx | ||||||||||||
| Anti-Communist | Vote (%): | xx | xx | ||||||||||||
| Socialist Labour | Vote (%): | xx | xx | ||||||||||||
- xx - less than 0.05% of the popular vote
See also
References
- "Voter Turnout at Federal Elections and Referendums". Elections Canada. Retrieved 10 March 2019.
This article is issued from Wikipedia. The text is licensed under Creative Commons - Attribution - Sharealike. Additional terms may apply for the media files.