1998 Australian federal election
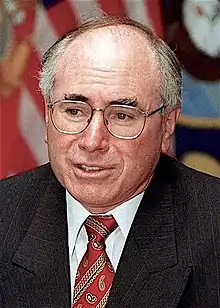
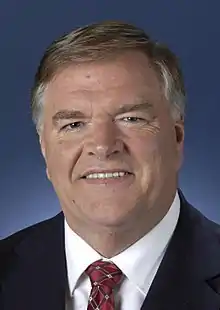
The 1998 Australian federal election was held to determine the members of the 39th Parliament of Australia. It was held on 3 October 1998. All 148 seats of the House of Representatives and 40 seats of the 76-seat Senate were up for election. The incumbent centre-right Liberal/National Coalition government led by Prime Minister John Howard of the Liberal Party and coalition partner Tim Fischer of the National Party defeated the centre-left Australian Labor Party opposition led by Opposition Leader Kim Beazley despite losing the two party preferred popular vote.
| ||||||||||||||||||||||||||||||||||
All 148 seats in the House of Representatives 75 seats were needed for a majority in the House 40 (of the 76) seats in the Senate | ||||||||||||||||||||||||||||||||||
|---|---|---|---|---|---|---|---|---|---|---|---|---|---|---|---|---|---|---|---|---|---|---|---|---|---|---|---|---|---|---|---|---|---|---|
| ||||||||||||||||||||||||||||||||||
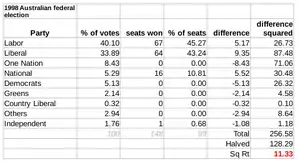
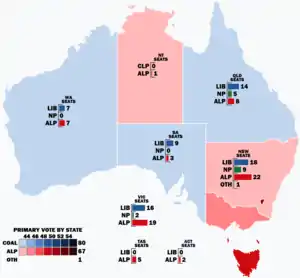 Popular vote by state and territory with graphs indicating the number of seats won. As this is an IRV election, seat totals are not determined by popular vote by state or territory but instead via results in each electorate. | ||||||||||||||||||||||||||||||||||
| ||||||||||||||||||||||||||||||||||
Future Prime Ministers Kevin Rudd and Julia Gillard entered parliament at this election.
Results
House of Representatives results

Coalition
Liberal (64)
National (16)
Opposition (67)
Labor (67)
Crossbench (1)
Independent (1)
| Party | Votes | % | Swing | Seats | Change | |||
|---|---|---|---|---|---|---|---|---|
| Labor | 4,454,306 | 40.10 | +1.35 | 67 | +18 | |||
| Liberal–National coalition | 4,388,809 | 39.51 | –7.74 | 80 | –14 | |||
| Liberal | 3,764,707 | 33.89 | −4.80 | 64 | −11 | |||
| National | 588,088 | 5.29 | −2.91 | 16 | −2 | |||
| Country Liberal | 36,014 | 0.32 | −0.03 | 0 | −1 | |||
| One Nation | 936,621 | 8.43 | +8.43 | 0 | 0 | |||
| Democrats | 569,875 | 5.13 | −1.63 | 0 | 0 | |||
| Greens | 290,709 | 2.62 | −0.30 | 0 | 0 | |||
| Unity | 87,279 | 0.79 | +0.79 | 0 | 0 | |||
| Christian Democrats | 64,916 | 0.58 | +0.18 | 0 | 0 | |||
| Australia First | 28,069 | 0.25 | +0.25 | 0 | 0 | |||
| Natural Law | 18,425 | 0.17 | −0.21 | 0 | 0 | |||
| Shooters | 12,675 | 0.11 | +0.11 | 0 | 0 | |||
| Democratic Socialist | 8,446 | 0.08 | +0.08 | 0 | 0 | |||
| Citizens Electoral Council | 8,295 | 0.07 | +0.07 | 0 | 0 | |||
| Progressive Labour | 6,122 | 0.06 | +0.06 | 0 | 0 | |||
| No Aircraft Noise | 5,298 | 0.05 | –0.12 | 0 | 0 | |||
| Tasmania First | 4,551 | 0.04 | +0.04 | 0 | 0 | |||
| Reform | 4,221 | 0.04 | +0.04 | 0 | 0 | |||
| Abolish Child Support | 2,312 | 0.02 | +0.02 | 0 | 0 | |||
| Women's | 1,426 | 0.01 | –0.05 | 0 | 0 | |||
| Socialist Equality | 531 | 0.00 | +0.00 | 0 | 0 | |||
| Independent EFF | 513 | 0.00 | +0.00 | 0 | 0 | |||
| Republican | 403 | 0.00 | +0.00 | 0 | 0 | |||
| Independents | 215,201 | 1.94 | –0.47 | 1 | −4 | |||
| Total | 11,109,063 | 148 | ||||||
| Two-party-preferred vote | ||||||||
| Liberal–National coalition | WIN | 49.02 | −4.61 | 80 | −14 | |||
| Labor | 50.98 | +4.61 | 67 | +18 | ||||
- Independents: Peter Andren
Senate results

Coalition
Liberal (31)
National (3)
CLP (1)
Opposition (29)
Labor (29)
Crossbench (12)
Democrats (9)
Greens (1)
One Nation (1)
Independent (1)
| Party | Votes | % | Swing | Seats Won | Seats Held | |
|---|---|---|---|---|---|---|
| Australian Labor Party | 4,182,963 | 37.31 | +1.16 | 17 | 29 | |
| Liberal/National (Joint Ticket) | 2,452,407 | 21.87 | −2.62 | 5 | ||
| Liberal Party of Australia | 1,528,730 | 13.63 | −2.61 | 11 | 31 | |
| One Nation | 1,007,439 | 8.99 | * | 1 | 1 | |
| Australian Democrats | 947,940 | 8.45 | −2.37 | 4 | 9 | |
| Australian Greens | 244,165 | 2.17 | −0.23 | 0 | 1 | |
| National Party of Australia | 208,536 | 1.86 | −1.01 | 0 | 3 | |
| Christian Democratic Party | 122,516 | 1.09 | +0.01 | 0 | 0 | |
| Unity Party | 93,968 | 0.83 | * | 0 | 0 | |
| Greens Western Australia | 61,063 | 0.54 | +0.02 | 0 | 0 | |
| Australia First Party | 46,765 | 0.41 | * | 0 | 0 | |
| Australian Shooters Party | 38,188 | 0.34 | −0.71 | 0 | 0 | |
| Country Liberal Party | 36,063 | 0.32 | −0.05 | 1 | 1 | |
| Democratic Labor Party | 29,893 | 0.27 | −0.06 | 0 | 0 | |
| Harradine Group | 24,254 | 0.22 | −0.08 | 1 | 1 | |
| Democratic Socialist Electoral League | 24,158 | 0.22 | * | 0 | 0 | |
| Australian Women's Party | 20,495 | 0.18 | −0.27 | 0 | 0 | |
| Abolish Child Support/Family Court Party | 15,276 | 0.14 | * | 0 | 0 | |
| Queensland First | 11,554 | 0.10 | * | 0 | 0 | |
| Natural Law Party | 11,152 | 0.10 | −0.06 | 0 | 0 | |
| Nuclear Disarmament Party | 9,685 | 0.09 | * | 0 | 0 | |
| Citizens Electoral Council | 9,403 | 0.08 | * | 0 | 0 | |
| Reclaim Australia: Reduce Immigration | 8,019 | 0.07 | −0.34 | 0 | 0 | |
| One Australia Party | 7,572 | 0.07 | −0.34 | 0 | 0 | |
| Other | 58,577 | 0.5 | ≤0 | 0 | 0 | |
| Total | 11,211,903 | 40 | 76 | |||
House of Representatives preference flows
- The Nationals had candidates in 13 seats where three-cornered-contests existed, with 88.89% of preferences favouring the Liberal Party.
- One Nation contested 135 electorates with preferences slightly favouring the Liberal/National Coalition (53.66%)
- The Democrats contested 144 electorates with preferences slightly favouring Labor (56.72%)
- The Greens contested 120 electorates with preferences strongly favouring Labor (73.28%)
Seats changing hands
| Seat | Pre-1998 | Swing | Post-1998 | ||||||
|---|---|---|---|---|---|---|---|---|---|
| Party | Member | Margin | Margin | Member | Party | ||||
| Bass, Tas | Liberal | Hon Warwick Smith | 4.57 | 4.63 | 0.06 | Michelle O'Byrne | Labor | ||
| Bendigo, Vic | Liberal | Bruce Reid | 0.88 | 4.35 | 3.47 | Steve Gibbons | Labor | ||
| Bowman, Qld | Liberal | Andrea West | 0.89 | 4.18 | 3.29 | Hon Con Sciacca | Labor | ||
| Braddon, Tas | Liberal | Hon Chris Miles | 5.69 | 10.02 | 4.33 | Sid Sidebottom | Labor | ||
| Canning, WA | Liberal | Ricky Johnston | 1.64 | 5.16 | 3.52 | Jane Gerick | Labor | ||
| Capricornia, Qld | National | Paul Marek | 3.46 | 8.75 | 5.29 | Kirsten Livermore | Labor | ||
| Chisholm, Vic | Liberal | Michael Wooldridge | 2.60 | 4.67 | 2.07 | Anna Burke | Labor | ||
| Cowan, WA | Liberal | Richard Evans | 4.06 | 7.62 | 3.56 | Graham Edwards | Labor | ||
| Curtin, WA | Independent | Allan Rocher | 7.28 | N/A** | 13.28 | Julie Bishop | Liberal | ||
| Dickson, Qld | Liberal | Tony Smith* | 3.90 | 4.02 | 0.12 | Cheryl Kernot | Labor | ||
| Griffith, Qld | Liberal | Graeme McDougall | 1.50 | 3.93 | 2.43 | Kevin Rudd | Labor | ||
| Hume, NSW | National | John Sharp | 4.35 | 3.71 | 8.06 | Alby Schultz | Liberal | ||
| Kingston, SA | Liberal | Susan Jeanes | 2.01 | 2.48 | 0.47 | David Cox | Labor | ||
| Kalgoorlie, WA | Independent | Graeme Campbell | 10.35 | N/A** | 2.10 | Barry Haase | Liberal | ||
| Lilley, Qld | Liberal | Elizabeth Grace | 0.80 | 3.93 | 3.13 | Wayne Swan | Labor | ||
| Lowe, NSW | Liberal | Paul Zammit* | 2.46 | 7.09 | 4.63 | John Murphy | Labor | ||
| McMillan, Vic | Liberal | Russell Broadbent | 2.07 | 2.64 | 0.57 | Christian Zahra | Labor | ||
| Moore, WA | Independent | Paul Filing | 13.28 | N/A** | 4.13 | Mal Washer | Liberal | ||
| Northern Territory, NT | Country Liberal | Nick Dondas | 0.37 | 0.94 | 0.57 | Warren Snowdon | Labor | ||
| Oxley, Qld | One Nation | Pauline Hanson* | 0.35 | 7.85 | 8.20 | Bernie Ripoll | Labor | ||
| Paterson, NSW | Liberal | Bob Baldwin | 0.43 | 1.65 | 1.22 | Bob Horne | Labor | ||
| Stirling, WA | Liberal | Eoin Cameron | 3.22 | 4.26 | 1.04 | Jann McFarlane | Labor | ||
| Swan, WA | Liberal | Don Randall | 3.63 | 6.33 | 2.70 | Kim Wilkie | Labor | ||
- *Paul Zammit contested his seat as an independent. The figures shown are against Liberal. Tony Smith contested his seat as an independent. The figures shown are against Labor. Pauline Hanson, a member of One Nation Party, contested the seat of Blair in this election after a redistribution, and lost to Liberal Cameron Thompson. The figures shown are a two-party-preferred basis between Labor and Liberal.
- **Allan Rocher, Graeme Campbell and Paul Filing all fell out of two-party-preferred; the second figures are against Labor.
Background
The election returned the Member of the House of Representatives for its 1998–2001 term and half of Australia's senators, who then served in the 1999–2002 Senate.
Despite winning almost 51 percent of the two-party-preferred vote and regaining much of what it had lost in its severe defeat of two years earlier, Labor fell short of forming government. The government was re-elected with 49.02% of the two-party-preferred vote, compared to 50.98% for the Australian Labor Party, the largest difference of six election results where the winner did not gain a two-party preferred majority, since 2PP results first estimated from 1937.
The election on 3 October 1998 was held six months earlier than required by the Constitution. Prime Minister John Howard made the announcement following the launch of the coalition's Goods and Services Tax (GST) policy launch and a five-week advertising campaign. The ensuing election was almost entirely dominated by the proposed 10% GST and proposed income tax cuts.
In reaction to One Nation's policies, the other significant parties all agreed to preference against One Nation. One Nation lost its lone house seat when founder and leader Pauline Hanson lost on preferences to Liberal candidate Cameron Thompson in the Queensland electorate of Blair. In Queensland, One Nation polled 14.83% of the Senate vote, sufficient to elect one senator without the need for preferences.[1] The seat initially went to Heather Hill, but she was subsequently disqualified under Section 44 of the Constitution, and replaced by Len Harris.
The election-eve Newspoll reported Labor on a 53 percent two-party-preferred vote.[2]
On election night of 3 October, the exit poll showed Labor on a 53 percent two-party-preferred vote. Labor made the single biggest gain by an Opposition party following an election defeat; the Coalition's majority was cut from 40 to 12. It was only when the first returns trickled in from Western Australia that the Coalition was assured of another term. The swing across all states would have normally been sufficient for a change of government, but the uneven nature of the swing left Kim Beazley eight seats short of becoming Prime Minister.
See also
Notes
- "The AEC has recently restructured our content". Aec.gov.au. 8 June 2007. Retrieved 13 June 2010.
- "Newspoll archive since 1987". Polling.newspoll.com.au.tmp.anchor.net.au. Archived from the original on 3 March 2016. Retrieved 30 July 2016.
References
- Election 98, campaign and results coverage by the ABC
- Australian Electoral Commission Results
- University of WA election results in Australia since 1890
- AEC 2PP vote
- AustralianPolitics.com election details
- Preference flows – ABC
| Federal elections | |
|---|---|
| Referendums | |
| |