1969 New Zealand general election
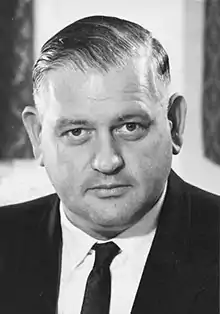
The 1969 New Zealand general election was a nationwide vote to determine the shape of Parliament's 36th term. It saw the Second National Government headed by Prime Minister Keith Holyoake of the National Party win a fourth consecutive term.
| ||||||||||||||||||||||||||||||||||
All 84 seats in the New Zealand Parliament 43 seats were needed for a majority | ||||||||||||||||||||||||||||||||||
|---|---|---|---|---|---|---|---|---|---|---|---|---|---|---|---|---|---|---|---|---|---|---|---|---|---|---|---|---|---|---|---|---|---|---|
| Turnout | 1,340,168 (88.94%) | |||||||||||||||||||||||||||||||||
| ||||||||||||||||||||||||||||||||||
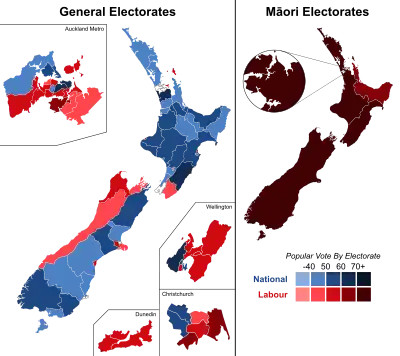
 Results of the election. | ||||||||||||||||||||||||||||||||||
| ||||||||||||||||||||||||||||||||||
1967 electoral redistribution
Through an amendment in the Electoral Act in 1965, the number of electorates in the South Island was fixed at 25, an increase of one since the 1962 electoral redistribution.[1] It was accepted that through the more rapid population growth in the North Island, the number of its electorates would continue to increase, and to keep proportionality, three new electorates were allowed for in the 1967 electoral redistribution for the next election.[2] In the North Island, five electorates were newly created (Birkenhead, Hamilton West, Henderson, Mangere, and Western Hutt) and one electorate was reconstituted (Waikato) while three electorates were abolished (Hamilton, Waipa, and Waitakere).[3] In the South Island, three electorates were newly created (Papanui, South Canterbury, and Wigram) and one electorate was reconstituted (Oamaru) while three electorates were abolished (Ashburton, Fendalton, and Waitaki).[4] The overall effect of the required changes was highly disruptive to existing electorates, with all but three electorates (Franklin, Wairarapa, and St Kilda) having their boundaries altered.[5] These changes came into effect with the 1969 election.[2]
The increase to 84 electorates was the first since the 1902 electoral distribution.[6] Due to the fixed number of South Island electorates, the number of North Island electorates has increased in every subsequent election until the introduction of mixed-member proportional representation (MMP) for the 1996 election, which fixed the number of seats at 120.[7]
Election
The election was held on 29 November. Turnout was 88.94%. The total number of MPs had increased to 84,[8] with at least 3 of the 4 new seats likely Labour seats. 55 and 25 electorates were in the North Island and South Island, respectively, plus the 4 Māori electorates.[9]
Results
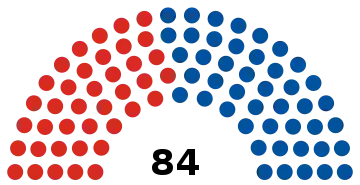
National pulled off a cliff-hanger victory. National won 45 seats, and Labour won 39 seats, though Labour's share of the vote was only 1% behind National. The Social Credit Party lost its only seat in Parliament: Hobson, formerly held by then party leader Vernon Cracknell.
Despite the hopes of a reinvigorated Labour party under Norman Kirk, Labour was overconfident, started too late, and did not win in Auckland. Relations with the Federation of Labour and the unions were not good, and an industrial dispute on the ship Wainui cost Labour three Auckland seats according to Kirk. Labour MP Warren Freer personally believed that had it not been for the seamen's strike during the election period, we could have won.[10]
In Eden, Labour was first on election night but lost when special votes were counted.
 | ||||||
|---|---|---|---|---|---|---|
| Election results | ||||||
| Party | Candidates | Total votes | Percentage | Seats won | Change | |
| National | 84 | 605,960 | 45.2 | 45 | +1 | |
| Labour | 84 | 592,055 | 44.2 | 39 | +4 | |
| Social Credit | 84 | 121,576 | 9.1 | - | −1 | |
| Country Party | 15 | 6,715 | 0.5 | - | ±0 | |
| Communist | 4 | 418 | 0.03 | - | ±0 | |
| Independents | 36 | 8,457 | 0.6 | - | ±0 | |
| Total | 303 | 1,340,168 | 84 | |||
Votes summary
The table below shows the results of the 1969 general election:
Key
National Labour Social Credit Independent
Table footnotes:
- Sinclair was first on election night for Eden (by 35 votes), but lost when special votes were included
Notes
- McRobie 1989, pp. 108, 111, 112.
- McRobie 1989, p. 111.
- McRobie 1989, pp. 107, 111.
- McRobie 1989, pp. 108, 112.
- McRobie 1989, pp. 111f.
- Wilson 1985, pp. 287f.
- Wilson 1985, pp. 288.
- "General elections 1853–2005 – dates & turnout". Elections New Zealand. Archived from the original on 2008-10-17.
- Wilson 1985, p. 173.
- Freer, Warren W (2004). A Lifetime in Politics: the memoirs of Warren Freer. Wellington: Victoria University Press. p. 152. ISBN 0-86473-478-6.
- Norton 1988.
- Gustafson 1986, p. 354.
- Gustafson 1986, p. 381.
- Templeton & Eunson 1972, p. 21.
- Gustafson 1986, p. 380.
References
- Chapman, George (1980). The Years of Lightning. Wellington: AH & AW Reed. ISBN 0-589-01346-7.
- Gustafson, Barry (1986). The First 50 Years : A History of the New Zealand National Party. Auckland: Reed Methuen. ISBN 0-474-00177-6.
- McRobie, Alan (1989). Electoral Atlas of New Zealand. Wellington: GP Books. ISBN 0-477-01384-8.
- Norton, Clifford (1988). New Zealand Parliamentary Election Results 1946–1987: Occasional Publications No 1, Department of Political Science. Wellington: Victoria University of Wellington. ISBN 0-475-11200-8.
- Templeton, Ian; Eunson, Keith (1969). Election '69.
- Templeton, Ian; Eunson, Keith (1972). In the Balance: Election '72. Dunedin: John McIndoe.
- Wilson, James Oakley (1985) [First published in 1913]. New Zealand Parliamentary Record, 1840–1984 (4th ed.). Wellington: V.R. Ward, Govt. Printer. OCLC 154283103.
.jpg.webp)
