1984 South African general election
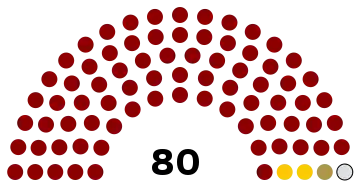
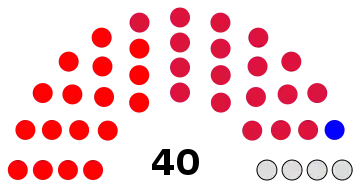
General elections were held in South Africa in August 1984 to elect Coloured and Indian representatives to their respective houses of the Tricameral Parliament. The Coloured elections for the House of Representatives took place on 22 August, and resulted in a victory for the Labour Party, headed by the Reverend Allan Hendrickse, which won 76 of the 80 seats. The Indian elections for the House of Delegates were held on 28 August and saw the National People's Party emerge as the largest party, winning 18 of the 40 seats.[1] The Indian elections were opposed by the United Democratic Front and were marked by boycotts and protests.[1] Despite the Prohibition of Political Interference Act of 1968 which banned mixed-race political parties, nine Indian members of Hendricke's Labour Party stood as independents,[2] one of whom won a seat and subsequently joined the NPP.[3]
| |||||||||||||||||||||||||||||||||||||||||||||||
All 80 elected seats in the House of Representatives All 40 elected seats in the House of Delegates | |||||||||||||||||||||||||||||||||||||||||||||||
|---|---|---|---|---|---|---|---|---|---|---|---|---|---|---|---|---|---|---|---|---|---|---|---|---|---|---|---|---|---|---|---|---|---|---|---|---|---|---|---|---|---|---|---|---|---|---|---|
This lists parties that won seats. See the complete results below. | |||||||||||||||||||||||||||||||||||||||||||||||
 |
|---|
| This article is part of a series on the politics and government of South Africa |
|
|
Background
In addition to the whites-only House of Assembly, a November 1983 referendum had approved the creation of two new houses an 80-member House of Representatives for Coloureds and a 40-member House of Delegates for Asians.
Results
House of Representatives
 | ||||
| Party | Votes | % | Seats | |
|---|---|---|---|---|
| Labour Party | 200,335 | 74.93 | 76 | |
| People's Congress Party | 31,701 | 11.86 | 2 | |
| Freedom Party | 13,505 | 5.05 | 1 | |
| Reformed Freedom Party | 2,632 | 0.98 | 0 | |
| Independents | 19,204 | 7.18 | 1 | |
| Total | 267,377 | 100.00 | 80 | |
| Valid votes | 267,377 | 97.99 | ||
| Invalid/blank votes | 5,477 | 2.01 | ||
| Total votes | 272,854 | 100.00 | ||
| Registered voters/turnout | 881,984 | 30.94 | ||
| Source: African Elections Database, Nohlen et al.[4] | ||||
By constituency
| Constituency | Freedom | Independent | Labour | People's Congress | Reformed Freedom |
|---|---|---|---|---|---|
| Addo | 0.00% | 0.00% | 74.49% | 16.47% | 9.05% |
| Alra Park | 9.20% | 0.00% | 82.28% | 8.52% | 0.00% |
| Belhar | 0.00% | 47.52% | 52.48% | 0.00% | 0.00% |
| Berg River | 0.00% | 25.58% | 74.42% | 0.00% | 0.00% |
| Bethelsdorp | 0.00% | 0.00% | 96.71% | 3.29% | 0.00% |
| Bishop Lavis | 0.00% | 0.00% | 65.04% | 34.96% | 0.00% |
| Bloemfontein Opkoms | 5.20% | 0.00% | 84.60% | 0.00% | 10.21% |
| Bokkeveld | 0.00% | 50.26% | 49.74% | 0.00% | 0.00% |
| Bonteheuwel | 0.00% | 0.00% | 94.86% | 5.14% | 0.00% |
| Border | 10.30% | 0.00% | 87.76% | 1.95% | 0.00% |
| Bosmont | 50.00% | 0.00% | 50.00% | 0.00% | 0.00% |
| Britstown | 0.00% | 0.00% | 83.76% | 16.24% | 0.00% |
| Daljosaphat | 0.00% | 20.96% | 56.13% | 22.91% | 0.00% |
| Diamant | 0.00% | 13.19% | 69.05% | 17.75% | 0.00% |
| Diaz | 0.00% | 0.00% | 78.03% | 21.97% | 0.00% |
| Durban Suburbs | 0.00% | 0.00% | 69.08% | 30.92% | 0.00% |
| Dysseldorp | 0.00% | 0.00% | 92.22% | 7.78% | 0.00% |
| Eastern Free State | 0.00% | 0.00% | 100.00% | 0.00% | 0.00% |
| Eersterus | 20.65% | 0.00% | 62.95% | 16.40% | 0.00% |
| Eldorado Park | 10.64% | 0.00% | 69.75% | 12.41% | 7.20% |
| Elsies River | 0.00% | 0.00% | 87.15% | 12.85% | 0.00% |
| Esselen Park | 0.00% | 7.54% | 60.46% | 31.99% | 0.00% |
| Fish River | 8.94% | 0.00% | 75.88% | 15.18% | 0.00% |
| Gelvandale | 7.51% | 0.00% | 84.30% | 8.19% | 0.00% |
| Genadendal | 0.00% | 0.00% | 100.00% | 0.00% | 0.00% |
| Grassy Park | 0.00% | 0.00% | 0.00% | 96.47% | 3.53% |
| Greenwood Park | 0.00% | 11.44% | 82.36% | 6.19% | 0.00% |
| Griqualand West | 0.00% | 6.49% | 76.69% | 16.82% | 0.00% |
| Haarlem | 0.00% | 0.00% | 77.73% | 12.37% | 9.90% |
| Hanover Park | 0.00% | 0.00% | 81.79% | 18.21% | 0.00% |
| Hantam | 0.00% | 0.00% | 75.74% | 24.26% | 0.00% |
| Hawston | 0.00% | 35.38% | 64.62% | 0.00% | 0.00% |
| Heidedal | 3.80% | 6.61% | 89.59% | 0.00% | 0.00% |
| Heideveld | 0.00% | 0.00% | 68.02% | 31.98% | 0.00% |
| Kalahari | 6.85% | 0.00% | 91.92% | 1.23% | 0.00% |
| Karee | 0.00% | 32.76% | 67.24% | 0.00% | 0.00% |
| Kasselsvlei | 0.00% | 26.08% | 58.38% | 7.50% | 8.04% |
| Klipspruit West | 23.44% | 11.28% | 60.18% | 5.10% | 0.00% |
| Liesbeek | 0.00% | 0.00% | 85.22% | 14.78% | 0.00% |
| Macassar | 0.00% | 13.33% | 69.10% | 17.57% | 0.00% |
| Mamre | 0.00% | 0.00% | 94.24% | 5.76% | 0.00% |
| Manenberg | 0.00% | 0.00% | 66.82% | 29.09% | 4.09% |
| Matroosfontein | 0.00% | 0.00% | 77.40% | 14.91% | 7.69% |
| Mid Karoo | 0.00% | 6.02% | 91.74% | 2.24% | 0.00% |
| Mitchells Plain | 0.00% | 0.00% | 83.50% | 12.62% | 3.88% |
| Natal Interior | 0.00% | 0.00% | 76.51% | 23.49% | 0.00% |
| Natal Mid-East | 0.00% | 26.60% | 64.22% | 9.17% | 0.00% |
| Newclare | 17.84% | 0.00% | 67.50% | 14.66% | 0.00% |
| Northeastern Cape | 18.66% | 0.00% | 71.90% | 9.45% | 0.00% |
| Northern Cape | 7.67% | 21.62% | 65.52% | 5.19% | 0.00% |
| Northern Transvaal | 13.62% | 0.00% | 78.10% | 8.28% | 0.00% |
| Nuweveld | 0.00% | 0.00% | 83.96% | 16.04% | 0.00% |
| Ottery | 0.00% | 0.00% | 42.97% | 57.03% | 0.00% |
| Outeniqua | 0.00% | 0.00% | 63.70% | 36.30% | 0.00% |
| Pniel | 0.00% | 0.00% | 100.00% | 0.00% | 0.00% |
| Ravensmead | 0.00% | 12.05% | 80.27% | 6.07% | 1.61% |
| Rawsonville | 0.00% | 19.15% | 80.85% | 0.00% | 0.00% |
| Reiger Park | 1.89% | 13.79% | 84.32% | 0.00% | 0.00% |
| Retreat | 0.00% | 0.00% | 84.28% | 15.72% | 0.00% |
| Rietvlei | 0.00% | 32.00% | 65.58% | 2.42% | 0.00% |
| Riversdal | 0.00% | 50.97% | 49.03% | 0.00% | 0.00% |
| Robertson | 0.00% | 8.14% | 91.86% | 0.00% | 0.00% |
| Ruste Ter Vaal | 24.30% | 0.00% | 75.70% | 0.00% | 0.00% |
| Schauderville | 19.36% | 0.00% | 74.39% | 6.26% | 0.00% |
| Silvertown | 0.00% | 0.00% | 88.28% | 11.72% | 0.00% |
| Southern Cape | 0.00% | 0.00% | 90.86% | 9.14% | 0.00% |
| Southern Free State | 0.00% | 0.00% | 100.00% | 0.00% | 0.00% |
| Springbok | 16.47% | 0.00% | 65.91% | 0.00% | 17.63% |
| Steinkopf | 16.61% | 31.46% | 51.94% | 0.00% | 0.00% |
| Strandfontein | 0.00% | 0.00% | 80.29% | 12.12% | 7.59% |
| Suurbraak | 36.25% | 4.49% | 59.26% | 0.00% | 0.00% |
| Swartkops | 0.00% | 0.00% | 77.76% | 22.24% | 0.00% |
| Swartland | 0.00% | 0.00% | 72.64% | 27.36% | 0.00% |
| Table Mountain | 0.00% | 0.00% | 50.64% | 49.36% | 0.00% |
| Toekomsrus | 41.44% | 7.01% | 51.55% | 0.00% | 0.00% |
| Upington | 0.00% | 0.00% | 91.70% | 8.30% | 0.00% |
| Vredendal | 0.00% | 0.00% | 63.66% | 36.34% | 0.00% |
| Wentworth | 0.00% | 0.00% | 54.11% | 45.89% | 0.00% |
| Western Free State | 1.97% | 0.00% | 91.22% | 6.81% | 0.00% |
| Wuppertal | 0.00% | 14.84% | 74.81% | 10.35% | 0.00% |
| Source: Constituency Level Election Archive | |||||
House of Delegates
 | ||||
| Party | Votes | % | Seats | |
|---|---|---|---|---|
| National People's Party | 29,862 | 36.12 | 18 | |
| Solidarity | 30,276 | 36.62 | 17 | |
| Progressive Independent Party | 1,322 | 1.60 | 1 | |
| National Federal Party | 633 | 0.77 | 0 | |
| National Democratic Party | 14 | 0.02 | 0 | |
| Independents | 20,568 | 24.88 | 4 | |
| Total | 82,675 | 100.00 | 40 | |
| Valid votes | 82,675 | 98.88 | ||
| Invalid/blank votes | 936 | 1.12 | ||
| Total votes | 83,611 | 100.00 | ||
| Registered voters/turnout | 401,901 | 20.80 | ||
| Source: Constituency Level Elections Archive | ||||
By constituency
| Constituency | Independent | National Democratic Party | National Federal Party | National People's Party | Progressive Independent Party | Solidarity |
|---|---|---|---|---|---|---|
| Actonville | 69.59% | 0.00% | 11.97% | 0.00% | 0.00% | 18.43% |
| Allandale | 51.74% | 0.00% | 0.00% | 0.00% | 0.00% | 48.26% |
| Arena Park | 0.00% | 0.00% | 0.00% | 73.17% | 0.00% | 26.83% |
| Bayview | 16.17% | 0.00% | 0.00% | 27.55% | 0.00% | 56.28% |
| Brickfield | 34.15% | 0.00% | 0.00% | 51.18% | 0.00% | 14.67% |
| Camperdown | 7.00% | 0.00% | 0.00% | 41.10% | 0.00% | 51.90% |
| Cavendish | 35.44% | 0.00% | 4.67% | 18.71% | 0.00% | 41.18% |
| Central Rand | 46.09% | 0.00% | 0.00% | 2.36% | 0.24% | 51.30% |
| Chatsworth Central | 0.00% | 0.00% | 8.14% | 44.12% | 0.00% | 47.73% |
| Clare Estate | 52.66% | 0.00% | 0.00% | 29.90% | 0.00% | 17.44% |
| Durban Bay | 44.34% | 0.00% | 0.00% | 52.26% | 0.00% | 3.40% |
| Eastern Transvaal | 35.27% | 0.00% | 0.00% | 18.09% | 0.00% | 46.65% |
| Glenview | 0.00% | 0.00% | 0.00% | 22.51% | 0.00% | 77.49% |
| Havenside | 33.83% | 0.00% | 0.00% | 0.00% | 0.00% | 66.17% |
| Isipingo | 22.30% | 0.00% | 0.00% | 40.05% | 0.00% | 37.65% |
| Laudium | 33.01% | 0.00% | 0.00% | 57.67% | 0.00% | 9.32% |
| Lenasia Central | 14.50% | 0.00% | 0.00% | 40.84% | 19.27% | 25.38% |
| Lenasia East | 6.04% | 0.00% | 0.00% | 24.93% | 42.78% | 26.25% |
| Lenasia West | 21.20% | 0.00% | 0.00% | 47.39% | 7.66% | 23.75% |
| Malabar | 18.56% | 0.00% | 0.00% | 81.12% | 0.00% | 0.32% |
| Marianhill | 1.05% | 0.00% | 0.00% | 50.62% | 0.00% | 48.33% |
| Merebank | 20.76% | 0.00% | 0.00% | 31.93% | 0.00% | 47.32% |
| Montford | 10.62% | 0.00% | 0.00% | 40.80% | 0.00% | 48.58% |
| Moorcross | 15.52% | 0.00% | 0.00% | 47.02% | 0.00% | 37.45% |
| Natal Midlands | 32.34% | 0.00% | 0.00% | 47.03% | 0.00% | 20.63% |
| Newholme | 38.78% | 0.00% | 0.00% | 41.80% | 0.00% | 19.42% |
| North Coast | 0.00% | 0.00% | 0.00% | 82.96% | 0.00% | 17.04% |
| North Western Transvaal | 45.03% | 0.00% | 0.00% | 40.42% | 0.00% | 14.55% |
| Northern Natal | 13.88% | 0.00% | 0.00% | 40.72% | 13.68% | 31.72% |
| Northwestern Cape | 44.95% | 0.00% | 0.00% | 35.05% | 0.00% | 20.00% |
| Phoenix | 43.58% | 0.00% | 0.00% | 21.60% | 0.00% | 34.81% |
| Redhill | 8.97% | 0.00% | 0.00% | 69.66% | 0.00% | 21.37% |
| Reservoir Hills | 0.00% | 0.00% | 4.69% | 41.58% | 0.00% | 53.73% |
| Rylands | 19.09% | 0.00% | 0.00% | 22.91% | 0.00% | 58.00% |
| Southern Natal | 15.75% | 0.34% | 0.00% | 21.42% | 13.54% | 48.95% |
| Springfield | 18.34% | 0.00% | 0.00% | 25.39% | 4.63% | 51.64% |
| Stanger | 0.40% | 0.00% | 0.00% | 27.14% | 0.00% | 72.46% |
| Tongaat | 56.00% | 0.00% | 0.00% | 23.40% | 0.59% | 20.01% |
| Umzinto | 31.32% | 0.18% | 0.00% | 35.62% | 0.00% | 32.88% |
| Verulam | 29.34% | 0.00% | 0.00% | 26.47% | 0.00% | 44.19% |
| Source: Constituency Level Election Archive | ||||||
Reactions
The United Nations Security Council passed Resolution 554 (1984) condemning the election, declaring it null and void as it was designed to entrench minority rule.
References
- Elections in South Africa African Elections Database
- "THE POLITICS OF COLLABORATION: THE CAMPAIGN FOR PARTICIPATION IN THE TRICAMERAL PARLIAMENT | South African History Online". www.sahistory.org.za. Retrieved 2020-01-05.
- Clarke, Professor of Urban and Social Geography School of Geography and the Environment Colin; Clarke, Colin; Peach, Ceri; Vertovec, Steven; Vertovec, Professor of Transnational Anthropology Steven (1990-10-26). South Asians Overseas: Migration and Ethnicity. Cambridge University Press. ISBN 978-0-521-37543-6.
- Dieter Nohlen, Michael Krennerich & Bernhard Thibaut (1999) Elections in Africa: A data handbook, p832 ISBN 0-19-829645-2
| General elections | |
|---|---|
| Provincial elections | |
| Municipal elections | |
| Referendums | |
| |