2004 South African general election
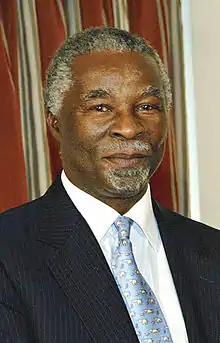
General elections were held in South Africa on Wednesday, 14 April 2004.[1] The African National Congress (ANC) of President Thabo Mbeki, which came to power after the end of the apartheid system in 1994, was re-elected with an increased majority.
| |||||||||||||||||||||||||||||||||||||||||||||||||||||||||||||||||||||||||||||
All 400 seats to the National Assembly of South Africa | |||||||||||||||||||||||||||||||||||||||||||||||||||||||||||||||||||||||||||||
|---|---|---|---|---|---|---|---|---|---|---|---|---|---|---|---|---|---|---|---|---|---|---|---|---|---|---|---|---|---|---|---|---|---|---|---|---|---|---|---|---|---|---|---|---|---|---|---|---|---|---|---|---|---|---|---|---|---|---|---|---|---|---|---|---|---|---|---|---|---|---|---|---|---|---|---|---|---|
| Turnout | 76.70% | ||||||||||||||||||||||||||||||||||||||||||||||||||||||||||||||||||||||||||||
| |||||||||||||||||||||||||||||||||||||||||||||||||||||||||||||||||||||||||||||
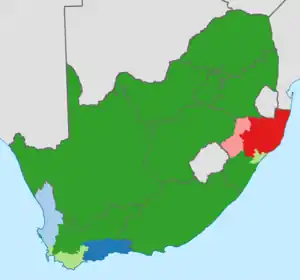 Results by District. Lighter shades indicate a plurality of the vote. | |||||||||||||||||||||||||||||||||||||||||||||||||||||||||||||||||||||||||||||
| |||||||||||||||||||||||||||||||||||||||||||||||||||||||||||||||||||||||||||||

.jpg.webp)

 |
|---|
| This article is part of a series on the politics and government of South Africa |
|
|
These were the third elections held since the end of the apartheid era. The South African National Assembly consists of 400 members, elected by proportional representation.[2] 200 members are elected from national party lists, the other 200 are elected from party lists in each of the nine provinces. The President of South Africa is chosen by the National Assembly after each election.
The ANC, which has been in power since 1994, obtained 69.7% of votes cast on the national ballot, theoretically allowing them to change the constitution.
Some 20.6-million people were registered for the 2004 general elections, which was about 2 million more than in 1999.[3] About 76% of registered voters took part in the election, with the ANC receiving 69.7% of the votes cast. However, only 56% of eligible voters (South African citizens of voting age) took part in the 2004 election, which means that the ANC received votes from only about 38% of all eligible voters.[4][5] The year 2004 saw an increase in voter abstention and there was at least one high-profile election and registration boycotts campaign, the No Land! No House! No Vote! Campaign.[6][7]
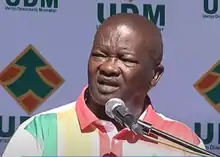
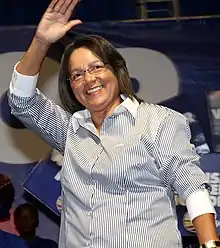
The main opposition party, the Democratic Alliance, also obtained an increased percentage on the national ballot, most likely from former supporters of the New National Party, possibly losing some support to Patricia de Lille's new Independent Democrats. The New National Party, a descendant of the ruling party of the apartheid era, collapsed and lost most of their support, dropping from 6.9% in 1999 to 1.7% (it was 20.4% in 1994), many of their supporters being unhappy with their alliance with the ANC. The Independent Democrats surprised many observers by obtaining more votes than the New National Party, becoming the fifth largest party. The Inkatha Freedom Party lost some support, including the majority in their stronghold province of Kwazulu-Natal, while the United Democratic Movement also lost support, barely hanging on as opposition in their stronghold, the Eastern Cape.
National Assembly results
_seats_2004.svg.png.webp) | |||||
| Party | Votes | % | Seats | +/– | |
|---|---|---|---|---|---|
| African National Congress | 10,880,915 | 69.69 | 279 | +13 | |
| Democratic Alliance | 1,931,201 | 12.37 | 50 | +12 | |
| Inkatha Freedom Party | 1,088,664 | 6.97 | 28 | −6 | |
| United Democratic Movement | 355,717 | 2.28 | 9 | −5 | |
| Independent Democrats | 269,765 | 1.73 | 7 | New | |
| New National Party | 257,824 | 1.65 | 7 | −21 | |
| African Christian Democratic Party | 250,272 | 1.60 | 7 | +1 | |
| Freedom Front Plus | 139,465 | 0.89 | 4 | 0 | |
| United Christian Democratic Party | 117,792 | 0.75 | 3 | 0 | |
| Pan Africanist Congress | 113,512 | 0.73 | 3 | 0 | |
| Minority Front | 55,267 | 0.35 | 2 | +1 | |
| Azanian People's Organisation | 39,116 | 0.25 | 1 | 0 | |
| Christian Democratic Party | 17,619 | 0.11 | 0 | New | |
| National Action | 15,804 | 0.10 | 0 | New | |
| Peace and Justice Congress | 15,187 | 0.10 | 0 | New | |
| Socialist Party of Azania | 14,853 | 0.10 | 0 | 0 | |
| New Labour Party | 13,318 | 0.09 | 0 | New | |
| United Front | 11,889 | 0.08 | 0 | New | |
| Employment Movement for South Africa | 10,446 | 0.07 | 0 | New | |
| The Organisation Party | 7,531 | 0.05 | 0 | New | |
| Keep It Straight and Simple Party | 6,514 | 0.04 | 0 | 0 | |
| Total | 15,612,671 | 100.00 | 400 | 0 | |
| Valid votes | 15,612,671 | 98.42 | |||
| Invalid/blank votes | 250,887 | 1.58 | |||
| Total votes | 15,863,558 | 100.00 | |||
| Registered voters/turnout | 20,674,926 | 76.73 | |||
| Source: Election Resources | |||||
Contested seat
When the official results were released, the ACDP successfully challenged the outcome. As a result, one of the two seats AZAPO won initially was handed over to the ACDP.[8]
Provincial legislature results
Elections for the nine provincial parliaments were held at the same time as for the National Assembly.
| Party | EC | FS | G | KZN | L | M | NW | NC | WC | |
|---|---|---|---|---|---|---|---|---|---|---|
| African National Congress | 51 | 25 | 51 | 38 | 45 | 27 | 27 | 21 | 19 | |
| Democratic Alliance | 5 | 3 | 15 | 7 | 2 | 2 | 2 | 3 | 12 | |
| Inkatha Freedom Party | 2 | 30 | ||||||||
| United Democratic Movement | 6 | 1 | 1 | 1 | 1 | |||||
| African Christian Democratic Party | 1 | 1 | 2 | 1 | 1 | 2 | ||||
| New National Party | 2 | 5 | ||||||||
| Independent Democrats | 1 | 2 | 3 | |||||||
| Freedom Front Plus | 1 | 1 | 1 | 1 | 1 | |||||
| United Christian Democratic Party | 3 | |||||||||
| Pan Africanist Congress | 1 | 1 | ||||||||
| Minority Front | 2 | |||||||||
| Total | 63 | 30 | 73 | 80 | 49 | 30 | 33 | 30 | 42 | |
Eastern Cape
| Party | Votes | % | +/− | Seats | +/− from last election |
+/− from before this election | |
|---|---|---|---|---|---|---|---|
| ANC | 1,768,987 | 79.27 | +5.47 | 51 | +4 | +2 | |
| UDM | 205,993 | 9.23 | −4.36 | 6 | −3 | −1 | |
| Democratic Alliance | 163,785 | 7.34 | +1.05 | 5 | +1 | 0 | |
| Pan Africanist Congress | 22,324 | 1.00 | −0.14 | 1 | 0 | 0 | |
| ACDP | 17,372 | 0.78 | −0.18 | 0 | 0 | 0 | |
| Independent Democrats | 17,314 | 0.78 | +0.78 | 0 | 0 | 0 | |
| NNP | 14,084 | 0.63 | −2.59 | 0 | −2 | −1 | |
| Freedom Front Plus | 5,692 | 0.26 | −0.25 | 0 | 0 | 0 | |
| IFP | 4,373 | 0.20 | −0.13 | 0 | 0 | 0 | |
| Azanian People's Organisation | 3,884 | 0.17 | +0.17 | 0 | 0 | 0 | |
| Socialist Party of Azania | 3,356 | 0.15 | +0.15 | 0 | 0 | 0 | |
| United Christian Democratic Party | 2,707 | 0.12 | +0.12 | 0 | 0 | 0 | |
| National Action | 1,672 | 0.07 | +0.07 | 0 | 0 | 0 | |
| Total | 2,231,543 | 100.00 | 63 | ||||
| Spoilt votes | 28,360 | ||||||
Free State
| Party | Votes | % | +/− | Seats | +/−[note 1] | ||
|---|---|---|---|---|---|---|---|
| ANC | 827,338 | 81.78 | +0.99 | 25 | 0 | ||
| Democratic Alliance | 85,714 | 8.47 | +3.14 | 3 | +1 | ||
| Freedom Front Plus | 24,946 | 2.47 | −0.04 | 1 | 0 | ||
| ACDP | 13,119 | 1.30 | +0.40 | 1 | +1 | ||
| Pan Africanist Congress | 11,969 | 1.18 | +0.03 | 0 | 0 | ||
| Dikwankwetla Party | 9,806 | 0.99 | +0.97 | 0 | 0 | ||
| UDM | 8,947 | 0.88 | −0.78 | 0 | 0 | ||
| NNP | 8,295 | 0.82 | −4.38 | 0 | −2 | ||
| United Christian Democratic Party | 7,825 | 0.77 | −0.01 | 0 | 0 | ||
| Independent Democrats | 5,289 | 0.52 | +0.52 | 0 | 0 | ||
| Azanian People's Organisation | 3,571 | 0.35 | +0.35 | 0 | 0 | ||
| IFP | 3,563 | 0.35 | −0.12 | 0 | 0 | ||
| National Action | 1,224 | 0.12 | +0.12 | 0 | 0 | ||
| Total | 1,011,606 | 100.00 | 30 | ||||
| Spoilt votes | 15,795 | ||||||
Gauteng
| Party | Votes | % | +/− | Seats | +/− from last election |
+/− from before this election | |
|---|---|---|---|---|---|---|---|
| ANC | 2,331,121 | 68.40 | +0.52 | 51 | +1 | +1 | |
| Democratic Alliance | 708,081 | 20.78 | +2.82 | 15 | +2 | +3 | |
| IFP | 85,500 | 2.51 | −1.00 | 2 | −1 | −1 | |
| ACDP | 55,991 | 1.64 | +0.48 | 1 | 0 | 0 | |
| Independent Democrats | 51,921 | 1.52 | +1.52 | 1 | +1 | 0 | |
| Freedom Front Plus[note 2] | 45,648 | 1.34 | −0.22 | 1 | 0 | 0 | |
| UDM | 33,644 | 0.99 | −0.97 | 1 | 0 | 0 | |
| Pan Africanist Congress | 29,076 | 0.85 | +0.12 | 1 | +1 | +1 | |
| NNP | 25,992 | 0.76 | −3.13 | 0 | −3 | −3 | |
| United Christian Democratic Party | 8,857 | 0.26 | +0.02 | 0 | 0 | 0 | |
| Azanian People's Organisation | 8,670 | 0.25 | +0.09 | 0 | 0 | 0 | |
| Christian Democratic Party | 7,773 | 0.23 | +0.23 | 0 | 0 | 0 | |
| National Action | 4,712 | 0.14 | +0.14 | 0 | 0 | 0 | |
| Peace and Justice Congress | 3,208 | 0.09 | +0.09 | 0 | 0 | 0 | |
| Socialist Party of Azania | 3,191 | 0.09 | +0.04 | 0 | 0 | 0 | |
| Economic Freedom Movement | 1,862 | 0.05 | +0.05 | 0 | 0 | 0 | |
| Pro-Death Penalty Party | 1,825 | 0.05 | +0.05 | 0 | 0 | 0 | |
| Black People's Convention | 1,236 | 0.04 | +0.04 | 0 | 0 | 0 | |
| Total | 3,408,308 | 100.00 | 73 | ||||
| Spoilt votes | 43,917 | ||||||
KwaZulu-Natal
| Party | Votes | % | +/− | Seats | +/− from last election |
+/− from before this election | |
|---|---|---|---|---|---|---|---|
| ANC | 1,287,823 | 46.98 | +7.59 | 38 | +6 | +3 | |
| IFP | 1,009,267 | 36.82 | −5.08 | 30 | −4 | −2 | |
| Democratic Alliance | 228,857 | 8.35 | +0.19 | 7 | +1 | 0 | |
| Minority Front | 71,540 | 2.61 | −0.32 | 2 | 0 | 0 | |
| ACDP | 48,892 | 1.78 | −0.03 | 2 | +1 | +1 | |
| UDM | 20,546 | 0.75 | −0.42 | 1 | 0 | 0 | |
| NNP | 14,218 | 0.52 | −2.76 | 0 | −3 | −2 | |
| Independent Democrats | 13,556 | 0.49 | +0.49 | 0 | 0 | 0 | |
| Freedom Front Plus | 7,764 | 0.28 | −0.14 | 0 | 0 | 0 | |
| Azanian People's Organisation | 7,061 | 0.26 | +0.09 | 0 | 0 | 0 | |
| Pan Africanist Congress | 5,118 | 0.19 | −0.07 | 0 | 0 | 0 | |
| Socialist Party of Azania | 5,023 | 0.18 | +0.07 | 0 | 0 | 0 | |
| Christian Democratic Party | 4,980 | 0.18 | +0.18 | 0 | 0 | 0 | |
| Izwi Lethu Party | 4,858 | 0.18 | +0.18 | 0 | 0 | 0 | |
| United Christian Democratic Party | 3,921 | 0.14 | +0.14 | 0 | 0 | 0 | |
| Peace and Development Party | 3,154 | 0.12 | +0.12 | 0 | 0 | −1 | |
| Royal Loyal Progress | 3,141 | 0.11 | +0.11 | 0 | 0 | 0 | |
| Independent African Movement | 1,546 | 0.06 | +0.06 | 0 | 0 | 0 | |
| Total | 2,741,265 | 100.00 | 80 | ||||
| Spoilt votes | 41,300 | ||||||
Limpopo
| Party | Votes | % | +/− | Seats | +/−[note 1] | ||
|---|---|---|---|---|---|---|---|
| ANC | 1,439,853 | 89.18 | +0.89 | 45 | +1 | ||
| Democratic Alliance | 57,930 | 3.59 | +2.17 | 2 | +1 | ||
| UDM | 27,780 | 1.72 | −0.79 | 1 | 0 | ||
| ACDP | 20,418 | 1.26 | +0.16 | 1 | 0 | ||
| Pan Africanist Congress | 15,222 | 0.94 | −0.46 | 0 | −1 | ||
| Alliance for Democracy and Prosperity | 9,933 | 0.62 | +0.62 | 0 | 0 | ||
| Freedom Front Plus | 9,724 | 0.60 | −0.44 | 0 | 0 | ||
| Ximoko Party | 9,587 | 0.59 | −0.24 | 0 | 0 | ||
| Azanian People's Organisation | 8,204 | 0.51 | −0.03 | 0 | 0 | ||
| NNP | 7,443 | 0.46 | −1.24 | 0 | −1 | ||
| United Christian Democratic Party | 3,477 | 0.22 | +0.22 | 0 | 0 | ||
| Independent Democrats | 2,730 | 0.17 | +0.17 | 0 | 0 | ||
| National Action | 2,213 | 0.14 | +0.14 | 0 | 0 | ||
| Total | 1,614,514 | 100.00 | 49 | ||||
| Spoilt votes | 21,947 | ||||||
Mpumalanga
| Party | Votes | % | +/− | Seats | +/−[note 1] | ||
|---|---|---|---|---|---|---|---|
| ANC | 959,436 | 86.30 | +1.48 | 27 | +1 | ||
| Democratic Alliance | 77,119 | 6.94 | +2.46 | 2 | +1 | ||
| Freedom Front Plus | 13,732 | 1.24 | −0.87 | 1 | 0 | ||
| ACDP | 12,065 | 1.09 | −0.03 | 0 | 0 | ||
| UDM | 11,161 | 1.00 | −0.42 | 0 | −1 | ||
| IFP | 10,643 | 0.96 | −0.46 | 0 | 0 | ||
| Pan Africanist Congress | 7,668 | 0.69 | +0.04 | 0 | 0 | ||
| Sindawonye Progressive Party | 5,925 | 0.53 | +0.15 | 0 | 0 | ||
| NNP | 5,122 | 0.46 | −2.02 | 0 | −1 | ||
| Independent Democrats | 3,406 | 0.31 | +0.31 | 0 | 0 | ||
| Azanian People's Organisation | 2,113 | 0.19 | +0.09 | 0 | 0 | ||
| United Christian Democratic Party | 1,878 | 0.17 | −0.06 | 0 | 0 | ||
| Socialist Party of Azania | 1,424 | 0.13 | +0.13 | 0 | 0 | ||
| Total | 1,111,692 | 100.00 | 30 | ||||
| Spoilt votes | 17,792 | ||||||
North West
| Party | Votes | % | +/− | Seats | +/−[note 1] | ||
|---|---|---|---|---|---|---|---|
| ANC | 1,048,089 | 80.71 | +1.74 | 27 | 0 | ||
| United Christian Democratic Party | 110,233 | 8.49 | −1.08 | 3 | 0 | ||
| Democratic Alliance | 64,925 | 5.00 | +1.74 | 2 | +1 | ||
| Freedom Front Plus | 17,123 | 1.32 | −0.57 | 1 | 0 | ||
| ACDP | 15,138 | 1.17 | +0.23 | 0 | 0 | ||
| UDM | 12,513 | 0.96 | −0.32 | 0 | 0 | ||
| Pan Africanist Congress | 10,923 | 0.84 | +0.10 | 0 | 0 | ||
| Independent Democrats | 5,709 | 0.44 | +0.44 | 0 | 0 | ||
| NNP | 5,592 | 0.43 | −1.86 | 0 | −1 | ||
| Azanian People's Organisation | 3,718 | 0.29 | +0.29 | 0 | 0 | ||
| IFP | 3,211 | 0.25 | −0.27 | 0 | 0 | ||
| National Action | 1,389 | 0.11 | +0.11 | 0 | 0 | ||
| Total | 1,298,563 | 100.00 | 33 | ||||
| Spoilt votes | 23,224 | ||||||
Northern Cape
| Party | Votes | % | +/− | Seats | +/−[note 1] | ||
|---|---|---|---|---|---|---|---|
| ANC | 219,365 | 68.83 | +4.51 | 21 | +1 | ||
| Democratic Alliance | 35,297 | 11.08 | +6.31 | 3 | +2 | ||
| NNP | 23,970 | 7.52 | −16.65 | 2 | −6 | ||
| Independent Democrats | 22,485 | 7.06 | +7.06 | 2 | +2 | ||
| ACDP | 5,995 | 1.88 | +0.35 | 1 | +1 | ||
| Freedom Front Plus | 4,948 | 1.55 | −0.63 | 1 | 0 | ||
| Azanian People's Organisation | 1,645 | 0.52 | +0.10 | 0 | 0 | ||
| UDM | 1,431 | 0.45 | −0.45 | 0 | 0 | ||
| Pan Africanist Congress | 1,381 | 0.43 | −0.23 | 0 | 0 | ||
| United Christian Democratic Party | 1,042 | 0.33 | +0.33 | 0 | 0 | ||
| IFP | 751 | 0.24 | −0.29 | 0 | 0 | ||
| Cape People's Congress | 392 | 0.12 | +0.12 | 0 | 0 | ||
| Total | 318,702 | 100.00 | 30 | ||||
| Spoilt votes | 5,192 | ||||||
Western Cape
| Party | Votes | % | +/− | Seats | +/− from last election |
+/− from before this election | |
|---|---|---|---|---|---|---|---|
| ANC | 709,052 | 45.25 | +3.18 | 19 | +1 | −3 | |
| Democratic Alliance | 424,832 | 27.11 | +15.20 | 12 | +7 | +5 | |
| NNP | 170,469 | 10.88 | −27.51 | 5 | −12 | −5 | |
| Independent Democrats | 122,867 | 7.84 | +7.84 | 3 | +3 | +3 | |
| ACDP | 53,934 | 3.44 | +0.65 | 2 | +1 | 0 | |
| UDM | 27,489 | 1.75 | −0.64 | 1 | 0 | +1 | |
| Africa Muslim Party | 11,019 | 0.70 | +0.10 | 0 | 0 | 0 | |
| New Labour Party | 10,526 | 0.67 | +0.67 | 0 | 0 | −1 | |
| Freedom Front Plus | 9,705 | 0.62 | +0.22 | 0 | 0 | 0 | |
| Pan Africanist Congress | 6,524 | 0.42 | −0.07 | 0 | 0 | 0 | |
| United Christian Democratic Party | 3,575 | 0.23 | +0.23 | 0 | 0 | 0 | |
| Green Party of South Africa | 3,317 | 0.21 | +0.06 | 0 | 0 | 0 | |
| Peace and Justice Congress | 3,278 | 0.21 | +0.21 | 0 | 0 | 0 | |
| National Action | 2,248 | 0.14 | +0.14 | 0 | 0 | 0 | |
| IFP | 2,222 | 0.14 | −0.04 | 0 | 0 | 0 | |
| Cape People's Congress | 1,960 | 0.13 | +0.13 | 0 | 0 | 0 | |
| Azanian People's Organisation | 1,455 | 0.09 | +0.09 | 0 | 0 | 0 | |
| Moderate Independent Party | 953 | 0.06 | +0.06 | 0 | 0 | 0 | |
| Peace and Development Party | 789 | 0.05 | +0.05 | 0 | 0 | 0 | |
| Universal Party | 735 | 0.05 | +0.05 | 0 | 0 | 0 | |
| Total | 1,566,949 | 100.00 | 42 | ||||
| Spoilt votes | 15,554 | ||||||
NCOP seats
The National Council of Provinces (NCOP) consists of 90 members, ten elected by each provincial legislature. The Members of NCOP have to be elected in proportion to the party membership of the provincial legislature.
| Party | Delegate type | EC | FS | G | KZN | L | M | NW | NC | WC | Total | ||
|---|---|---|---|---|---|---|---|---|---|---|---|---|---|
| ANC | Permanent | 4 | 4 | 4 | 3 | 5 | 5 | 4 | 4 | 2 | 35 | 65 | |
| Special | 4 | 4 | 3 | 2 | 4 | 4 | 4 | 3 | 2 | 30 | |||
| Democratic Alliance | Permanent | 1 | 1 | 1 | 1 | 1 | 1 | 1 | 1 | 2 | 10 | 12 | |
| Special | 1 | 1 | 2 | ||||||||||
| IFP | Permanent | 1 | 2 | 3 | 5 | ||||||||
| Special | 2 | 2 | |||||||||||
| Independent Democrats | Permanent | 1 | 1 | 2 | |||||||||
| Special | 1 | 1 | |||||||||||
| NNP | Permanent | 1 | 1 | 2 | |||||||||
| ACDP | Special | 1 | 1 | ||||||||||
| Freedom Front Plus | Permanent | 1 | 1 | ||||||||||
| United Christian Democratic Party | Permanent | 1 | 1 | ||||||||||
| UDM | Permanent | 1 | 1 | ||||||||||
| Total | 10 | 10 | 10 | 10 | 10 | 10 | 10 | 10 | 10 | 90 | |||
Notes to the tables
- As Democratic Party.
- No members of this legislature crossed the floor during the 2003 floor-crossing period.
- Successor to the Freedom Front, the Afrikaner Eenheidsbeweging, and the Conservative Party.
References
- "Election Resources on the Internet: Republic of South Africa 2004 General Election". Election Resources on the Internet. Retrieved 16 August 2019.
- "How Parliament is Constructed". Parliament of the Republic of South Africa. Retrieved 16 August 2019.
- "Archived copy". Archived from the original on 2 February 2018. Retrieved 20 April 2009.CS1 maint: archived copy as title (link)
- McKinley, Dale T. (29 April 2004). "South Africa: A disillusioned democracy". Green Left Weekly. Archived from the original on 18 September 2006. Retrieved 21 September 2006.
- "ANC wins South African elections in low voter turnout". wsws.org.
- "The 'No Land, No House, No Vote' campaign still on for 2009". Abahlali baseMjondolo. 5 May 2005.
- "IndyMedia Presents: No Land! No House! No Vote!". Anti-Eviction Campaign. 12 December 2005. Archived from the original on 25 April 2009.
- "ACDP awarded an extra seat in parliament". IOL. 1 June 2004.
- "April 14, 2004 General Election Results - Eastern Cape". Election Resources on the Internet. Retrieved 23 December 2010.
- "April 14, 2004 General Election Results - Free State". Election Resources on the Internet. Retrieved 23 December 2010.
- "April 14, 2004 General Election Results - Gauteng". Election Resources on the Internet. Retrieved 23 December 2010.
- "April 14, 2004 General Election Results - KwaZulu-Natal". Election Resources on the Internet. Retrieved 23 December 2010.
- "April 14, 2004 General Election Results - Limpopo". Election Resources on the Internet. Retrieved 23 December 2010.
- "April 14, 2004 General Election Results - Mpumalanga". Election Resources on the Internet. Retrieved 23 December 2010.
- "April 14, 2004 General Election Results - North West". Election Resources on the Internet. Retrieved 23 December 2010.
- "April 14, 2004 General Election Results - Northern Cape". Election Resources on the Internet. Retrieved 23 December 2010.
- "April 14, 2004 General Election Results - Western Cape". Election Resources on the Internet. Retrieved 13 December 2010.
- John Kane-Berman; et al. (2004). South Africa Survey 2003/04. South African Institute of Race Relations. p. 462. ISBN 9780869824764.
External links
- Official IEC election results
- South African general election, 2004 on electionresources.org
- Election results from the South African Broadcasting Corporation
| General elections | |
|---|---|
| Provincial elections | |
| Municipal elections | |
| Referendums | |
| |