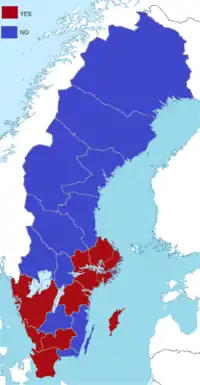
1994 Swedish European Union membership referendum
A non-binding referendum on membership for the European Union was held in Sweden on 13 November 1994.[1]
The voter turnout was 83.3%, and the result was 52.3% for and 46.8% against.[1]
Result
| Summary of the referendum |
Votes | Percent |
|---|---|---|
| Yes | 2,833,721 | 52.3 |
| No | 2,539,132 | 46.8 |
| Blank votes | 48,937 | 0.9 |
| Total | 5,421,790 | 100 |
| Invalid votes | 2,697 | |
| Eligible voters | 6,510,055 | |
| Turnout | 5,424,487 | 83.3 |
Source: Nationalencyklopedin[2]
See also: Swedish Election Authority[3]
By county

European Union membership referendum 1994, result by counties
No-votes
Yes-votes
| Region | Yes | % Yes | No | % No | Electorate | Votes | Valid | Invalid votes |
|---|---|---|---|---|---|---|---|---|
| Stockholm | 623,496 | 62.03 | 381,635 | 37.97 | 1,216,980 | 1,014,869 | 1,005,131 | 9,738 |
| Uppsala | 92,167 | 53.96 | 78,636 | 46.04 | 205,736 | 172,747 | 170,803 | 1,944 |
| Södermanland | 86,083 | 54.31 | 72,430 | 45.69 | 191,199 | 160,141 | 158,513 | 1,628 |
| Östergötland | 139,697 | 54.49 | 116,689 | 45.51 | 309,509 | 259,312 | 256,386 | 2,926 |
| Örebro | 81,423 | 47.47 | 90,109 | 52.53 | 208,184 | 173,286 | 171,532 | 1,754 |
| Västmanland | 87,058 | 54.81 | 71,778 | 45.19 | 193,184 | 160,400 | 158,836 | 1,564 |
| Jönköping | 100,072 | 48.89 | 104,616 | 51.11 | 242,805 | 206,545 | 204,688 | 1,857 |
| Kronoberg | 58,015 | 51.87 | 53,824 | 48.13 | 134,559 | 113,019 | 111,839 | 1,180 |
| Kalmar | 73,207 | 48.74 | 76,987 | 51.26 | 184,802 | 151,649 | 150,194 | 1,455 |
| Gotland | 17,996 | 51.40 | 17,017 | 48.60 | 43,878 | 35,399 | 35,013 | 386 |
| Blekinge | 45,098 | 46.90 | 51,065 | 53.10 | 116,586 | 97,106 | 96,163 | 943 |
| Skåne | 422,567 | 63.23 | 245,696 | 36.77 | 818,810 | 674,619 | 668,263 | 6,356 |
| Halland | 97,222 | 58.44 | 69,150 | 41.56 | 197,757 | 168,244 | 166,372 | 1,872 |
| Västra Götaland | 466,591 | 51.99 | 430,924 | 48.01 | 1,085,238 | 906,508 | 897,515 | 8,993 |
| Värmland | 84,627 | 47.46 | 93,703 | 52.54 | 217,170 | 179,875 | 178,330 | 1,545 |
| Dalarna | 71,253 | 39.06 | 111,150 | 60.94 | 220,141 | 184,047 | 182,403 | 1,644 |
| Gävleborg | 74,767 | 41.69 | 104,583 | 58.31 | 222,780 | 180,980 | 179,350 | 1,630 |
| Västernorrland | 69,582 | 41.96 | 96,233 | 58.04 | 201,394 | 167,081 | 165,815 | 1,266 |
| Jämtland | 24,714 | 27.94 | 63,731 | 72.06 | 104,798 | 89,121 | 88,445 | 676 |
| Västerbotten | 60,071 | 37.23 | 101,285 | 62.77 | 193,374 | 162,532 | 161,356 | 1,176 |
| Norrbotten | 58,015 | 34.97 | 107,891 | 65.03 | 201,171 | 167,007 | 165,906 | 1,101 |
| Source: Dataset European Election Database | ||||||||
See also
References
- "Folkomröstningar 1922-2003" (in Swedish). Statistics Sweden. 21 December 2007. Archived from the original on 22 May 2011. Retrieved 22 May 2011.
- "Folkomröstning: Tabell: Folkomröstningar i Sverige". Nationalencyklopedin (in Swedish). Retrieved 22 May 2011. (subscription required)
- "Nationella folkomröstningar" (in Swedish). Swedish Election Authority. Archived from the original on 22 May 2011. Retrieved 22 May 2011.
This article is issued from Wikipedia. The text is licensed under Creative Commons - Attribution - Sharealike. Additional terms may apply for the media files.