2014 European Parliament election in Sweden
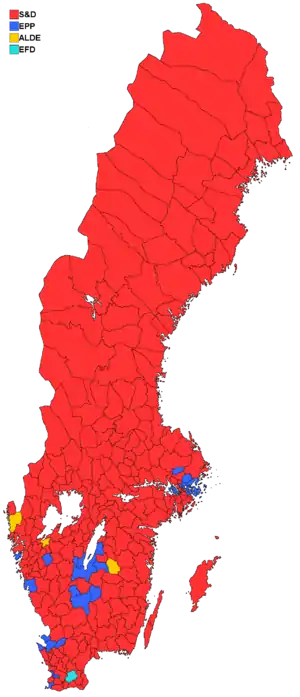
European Parliament elections in Sweden took place on 25 May 2014. At the election, twenty Members of the European Parliament (MEPs) were from the Swedish constituency. In the election, voters choose members of registered Swedish parties whose elected members then form political groups in the European Parliament, together with members of parties from other Member States with the same political affiliation.
| |||||||||||||||||||||||||||||||||||||||||||||||||||||||||||||||||||||||||||||||||||||||||||||||||||||||||||||||||||||||||||||||||
All 20 Swedish seats to the European Parliament | |||||||||||||||||||||||||||||||||||||||||||||||||||||||||||||||||||||||||||||||||||||||||||||||||||||||||||||||||||||||||||||||||
|---|---|---|---|---|---|---|---|---|---|---|---|---|---|---|---|---|---|---|---|---|---|---|---|---|---|---|---|---|---|---|---|---|---|---|---|---|---|---|---|---|---|---|---|---|---|---|---|---|---|---|---|---|---|---|---|---|---|---|---|---|---|---|---|---|---|---|---|---|---|---|---|---|---|---|---|---|---|---|---|---|---|---|---|---|---|---|---|---|---|---|---|---|---|---|---|---|---|---|---|---|---|---|---|---|---|---|---|---|---|---|---|---|---|---|---|---|---|---|---|---|---|---|---|---|---|---|---|---|---|
| Turnout | 51.07% ( | ||||||||||||||||||||||||||||||||||||||||||||||||||||||||||||||||||||||||||||||||||||||||||||||||||||||||||||||||||||||||||||||||
| |||||||||||||||||||||||||||||||||||||||||||||||||||||||||||||||||||||||||||||||||||||||||||||||||||||||||||||||||||||||||||||||||
 | |||||||||||||||||||||||||||||||||||||||||||||||||||||||||||||||||||||||||||||||||||||||||||||||||||||||||||||||||||||||||||||||||

_(cropped).jpg.webp)


Results
| ← 2009 • 2014 • 2019 → | ||||||||||
| National party | European party | Main candidate | Votes | % | +/– | Seats | +/– | |||
|---|---|---|---|---|---|---|---|---|---|---|
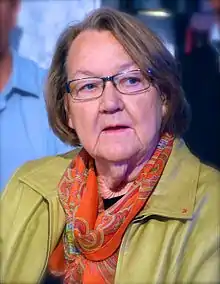
| Social Democratic (S) | S & D | Marita Ulvskog | 899,074 | 24.19 | 0.22 |
5 / 20 | 1 | |||
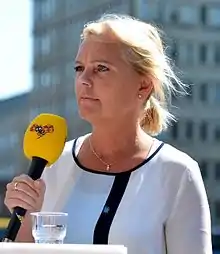
| Green (MP) | Greens/EFA | Isabella Lövin | 572,591 | 15.41 | 4.39 |
4 / 20 | 2 | |||
| Moderate (M) | EPP | Gunnar Hökmark | 507,488 | 13.65 | 5.18 |
3 / 20 | 1 | |||
| Liberal People's (FP) | ALDE | Marit Paulsen | 368,514 | 9.91 | 3.67 |
2 / 20 | 1 | |||
| Sweden Democrats (SD) | EFDD | Kristina Winberg | 359,248 | 9.67 | 6.40 |
2 / 20 | 2 | |||
| Centre (C) | ALDE | Kent Johansson | 241,101 | 6.49 | 1.02 |
1 / 20 | 0 | |||
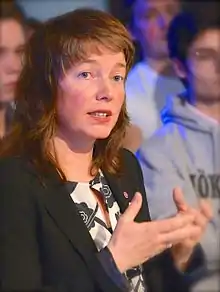
| Left (V) | GUE/NGL | Malin Björk | 234,272 | 6.30 | 0.54 |
1 / 20 | 0 | |||
| Christian Democrats (KD) | EPP | Lars Adaktusson | 220,574 | 5.93 | 1.25 |
1 / 20 | 0 | |||
| Feminist Initiative (F!) | S & D | Soraya Post | 204,005 | 5.49 | 3.27 |
1 / 20 | 1 | |||
| Pirate (PP) | Greens/EFA | Christian Engström | 82,763 | 2.23 | 4.90 |
0 / 20 | 2 | |||
| Others (non-incumbent parties or candidates that won less than 1% of the vote and no seats) | 27,148 | 0.73 | 3.00 |
0 / 20 | 0 | |||||
| Valid votes | 3,716,778 | 98.88 | ||||||||
| Blank and invalid votes | 42,173 | 1.12 | ||||||||
| Totals | 3,758,951 | 100.00 | — | 20 / 20 |
0 | |||||
| Electorate (eligible voters) and voter turnout | 7,359,962 | 51.07 | 5.54 |
|||||||
| Source: Val.se | ||||||||||
Elected candidates
Previous result
Distribution of Sweden's mandate during the previous election, Turnout was 45.53%[2] in 2009
| Swedish party | Seats/20 | European party | Seats/754 | ||
|---|---|---|---|---|---|
| Social Democratic Party | 6 | Party of European Socialists | 195 | ||
| Moderate Party | 4 | European People's Party | 275 | ||
| Christian Democrats | 1 | ||||
| Liberal People's Party | 3 | Alliance of Liberals and Democrats for Europe | 75 | ||
| Centre Party | 1 | ||||
| Green Party | 2 | European Green Party | 45 | ||
| Pirate Party | 2 | European Pirate Party | 2 | ||
| Left Party | 1 | Nordic Green Left Alliance | 2 | ||
References
| General elections | |
|---|---|
| Local elections | |
| European elections | |
| Referendums | |
This article is issued from Wikipedia. The text is licensed under Creative Commons - Attribution - Sharealike. Additional terms may apply for the media files.