1999 European Parliament election in Sweden
The European Parliament election of 1999 in Sweden was the election of MEP representing Sweden constituency for the 1999-2004 term of the European Parliament. It was part of the wider 1999 European election. The vote took place on 13 June.
| |||||||||||||||||||||||||||||||||||||||||||||||||||||||||||||||||||||||||||||||||||||||||||||||||||||||||||||||||||||||
22 seats to the European Parliament | |||||||||||||||||||||||||||||||||||||||||||||||||||||||||||||||||||||||||||||||||||||||||||||||||||||||||||||||||||||||
|---|---|---|---|---|---|---|---|---|---|---|---|---|---|---|---|---|---|---|---|---|---|---|---|---|---|---|---|---|---|---|---|---|---|---|---|---|---|---|---|---|---|---|---|---|---|---|---|---|---|---|---|---|---|---|---|---|---|---|---|---|---|---|---|---|---|---|---|---|---|---|---|---|---|---|---|---|---|---|---|---|---|---|---|---|---|---|---|---|---|---|---|---|---|---|---|---|---|---|---|---|---|---|---|---|---|---|---|---|---|---|---|---|---|---|---|---|---|---|---|
| Turnout | 38.84% ( | ||||||||||||||||||||||||||||||||||||||||||||||||||||||||||||||||||||||||||||||||||||||||||||||||||||||||||||||||||||||
| |||||||||||||||||||||||||||||||||||||||||||||||||||||||||||||||||||||||||||||||||||||||||||||||||||||||||||||||||||||||

.jpg.webp)


Results
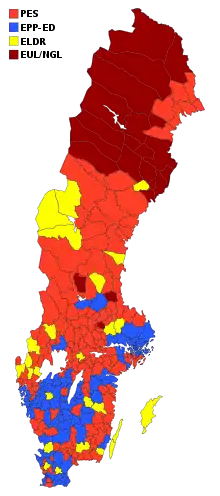
The map shows which European party group received the most votes in each municipality
| ← 1995 • 1999 • 2004 → | |||||||||
| National party | European party | Main candidate | Votes | % | +/– | Seats | +/– | ||
|---|---|---|---|---|---|---|---|---|---|
| Social Democratic Party (S) | Pierre Schori | 657,497 | 25.99 | 2.07 |
6 / 22 |
1 | |||
| Moderate Party (M) | Staffan Burenstam Linder | 524,755 | 20.75 | 2.42 |
5 / 22 |
0 | |||
| Left Party (V) | Jonas Sjöstedt | 400,073 | 15.82 | 2.90 |
3 / 22 |
0 | |||
| Liberal People's Party (FP) | Marit Paulsen | 350,339 | 13.85 | 9.03 |
3 / 22 |
2 | |||
| Green Party (MP) | Per Gahrton | 239,946 | 9.49 | 7.73 |
2 / 22 |
2 | |||
| Christian Democrats (KD) | Anders Wijkman | 193,354 | 7.64 | 3.72 |
2 / 22 |
2 | |||
| Centre Party (C) | Karl Olsson | 151,442 | 5.99 | 1.17 |
1 / 22 |
1 | |||
| Others (parties that won less than 1% of the vote and no seats) | 12,031 | 0.5 | — | 0 / 22 |
— | ||||
| Valid votes | 2,529,437 | 97.72 | |||||||
| Blank and invalid votes | 59,077 | 2.28 | |||||||
| Totals | 2,588,514 | 100.00 | — | 22 / 22 |
0 | ||||
| Electorate (eligible voters) and voter turnout | 6,664,205 | 38.84 | 2.79 |
||||||
External links
| General elections | |
|---|---|
| Local elections | |
| European elections | |
| Referendums | |
This article is issued from Wikipedia. The text is licensed under Creative Commons - Attribution - Sharealike. Additional terms may apply for the media files.