2013 Tyrolean state election
The 2013 Tyrolean state election was held on 28 April 2013 to elect the members of the Landtag of Tyrol.
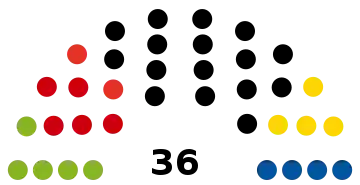
| |||||||||||||||||||||||||||||||||||||||||||||||||||||||||||||||||||||||||||||
All 36 seats in the Landtag of Tyrol 19 seats needed for a majority | |||||||||||||||||||||||||||||||||||||||||||||||||||||||||||||||||||||||||||||
|---|---|---|---|---|---|---|---|---|---|---|---|---|---|---|---|---|---|---|---|---|---|---|---|---|---|---|---|---|---|---|---|---|---|---|---|---|---|---|---|---|---|---|---|---|---|---|---|---|---|---|---|---|---|---|---|---|---|---|---|---|---|---|---|---|---|---|---|---|---|---|---|---|---|---|---|---|---|
| Turnout | 321,611 (60.4%) | ||||||||||||||||||||||||||||||||||||||||||||||||||||||||||||||||||||||||||||
| |||||||||||||||||||||||||||||||||||||||||||||||||||||||||||||||||||||||||||||
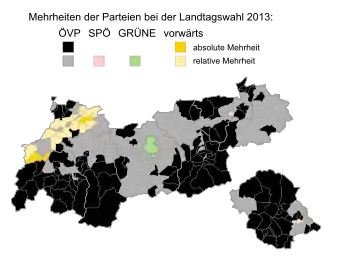 Results by municipality. The lighter shade indicates a plurality; the darker shade indicates a majority. | |||||||||||||||||||||||||||||||||||||||||||||||||||||||||||||||||||||||||||||
| |||||||||||||||||||||||||||||||||||||||||||||||||||||||||||||||||||||||||||||

The election was contested by a large number of parties and saw a significant shift in support between them. The governing Austrian People's Party (ÖVP) Social Democratic Party of Austria (SPÖ), while suffering relatively small losses, each suffered their worst results in history. The Greens achieved their best ever result, just 1.1 percentage points behind the SPÖ, while the Freedom Party of Austria (FPÖ) suffered a downswing. The most notable loss of the election was the Fritz Dinkhauser List, which collapsed from a second-placed 18% in 2008 to just 5.6% in this election, making it the smallest party in the Landtag. Three new parties were considered contenders to enter the Landtag, though only one succeeded, with Forward Tyrol winning 9.5% and four seats. The Citizens' Club Tyrol, a splinter from the Fritz party, narrowly failed to win seats, as did Team Stronach.[1]
Despite its relatively poor result, the ÖVP under Governor Günther Platter remained by far the largest party. He subsequently formed a coalition with the Greens.[2]
Background
In the 2008 election, the ÖVP lost its majority for the first time in history, winning 40.5% of votes cast (a loss of 9.4pp). This was coupled with losses for the SPÖ and Greens, while the new Fritz Dinkhauser List soared to second place with 18.4% of votes. The ÖVP subsequently formed a coalition with the SPÖ.
Electoral system
The 36 seats of the Landtag of Tyrol are elected via open list proportional representation in a two-step process. The seats are distributed between nine multi-member constituencies, corresponding to the districts of Tyrol. For parties to receive any representation in the Landtag, they must either win at least one seat in a constituency directly, or clear a 5 percent state-wide electoral threshold. Seats are distributed in constituencies according to the Hare quota, with any remaining seats allocated using the D'Hondt method at the state level, to ensure overall proportionality between a party's vote share and its share of seats.
Contesting parties
The table below lists parties represented in the previous Landtag.
| Name | Ideology | Leader | 2008 result | |||
|---|---|---|---|---|---|---|
| Votes (%) | Seats | |||||
| ÖVP | Austrian People's Party Österreichische Volkspartei |
Christian democracy | Günther Platter | 40.5% | 16 / 36 | |
| FRITZ | Citizens' Forum Tyrol Bürgerforum Tirol |
Populism | Andrea Haselwanter-Schneider | 18.4% | 7 / 36 | |
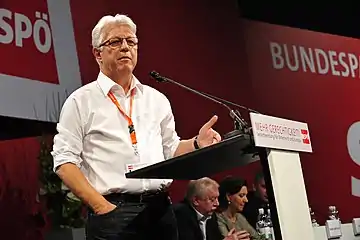
| SPÖ | Social Democratic Party of Austria Sozialdemokratische Partei Österreichs |
Social democracy | Gerhard Reheis | 15.5% | 5 / 36 | |
| FPÖ | Freedom Party of Austria Freiheitliche Partei Österreichs |
Right-wing populism Euroscepticism |
Gerald Hauser | 12.4% | 4 / 36 | |
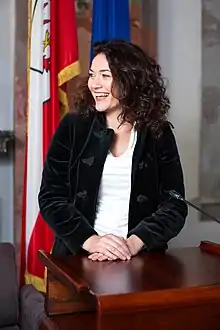
| GRÜNE | The Greens – The Green Alternative Die Grünen – Die Grüne Alternative |
Green politics | Ingrid Felipe | 10.7% | 4 / 36 | |
In addition to the parties already represented in the Landtag, six parties collected enough signatures to be placed on the ballot.
- Forward Tyrol (VORWÄRTS)
- Citizens' Club Tyrol (GURGISER)
- Team Stronach (STRONACH)
- For Tyrol (FÜR TIROL)
- Communist Party of Austria (KPÖ)
- Pirate Party of Austria (PIRAT)
Opinion polling
| Polling firm | Fieldwork date | Sample size |
ÖVP | FRITZ | SPÖ | FPÖ | Grüne | Stro. | Club | Forw. | Others | Lead |
|---|---|---|---|---|---|---|---|---|---|---|---|---|
| 2018 state election | 25 February 2018 | – | 39.4 | 5.6 | 13.7 | 9.3 | 12.6 | 3.4 | 4.8 | 9.5 | 1.6 | 25.7 |
| GMK | 10–12 Apr 2013 | 500 | 38 | 4 | 14 | 10 | 9 | 6 | 6 | 10 | 1.5 | 24 |
| Gallup | April 2013 | ? | 33 | 5 | 15 | 9 | 15 | 4 | 4 | 12 | – | 18 |
| Karmasin | 26 Mar–5 Apr 2013 | 500 | 34 | 6 | 14 | 10 | 14 | 6 | 2 | 11 | 3 | 20 |
| TrendCom | 13–19 Mar 2013 | 400 | 34 | 6 | 16 | 8 | 12 | 6 | 2 | 13 | 3 | 18 |
| Market | March 2013 | ? | 36 | 7 | 14 | 10 | 13 | 8 | 2 | 8 | 1 | 22 |
| Karmasin | March 2013 | 500 | 35 | 5 | 15 | 9 | 14 | 6 | 2 | 9 | 3 | 20 |
| IMAD | 13–16 Mar 2013 | 500 | 30.5 | 6.5 | 13.7 | 8.5 | 14.0 | 6.5 | 2.5 | 13.4 | 4.4 | 16.5 |
| Karmasin | February 2013 | ? | 36 | 4 | 15 | 11 | 13 | 5 | 2 | 10 | 4 | 21 |
| Karmasin | December 2012 | ? | 41 | 7 | 15 | 9 | 14 | 8 | 2 | – | 4 | 26 |
| 2008 state election | 8 June 2008 | – | 40.5 | 18.4 | 15.5 | 12.4 | 10.7 | – | – | – | 2.6 | 22.1 |
Results
 | ||||||
| Party | Votes | % | +/− | Seats | +/− | |
|---|---|---|---|---|---|---|
| Austrian People's Party (ÖVP) | 124,689 | 39.35 | –1.15 | 16 | ±0 | |
| Social Democratic Party of Austria (SPÖ) | 43,469 | 13.72 | –1.74 | 5 | ±0 | |
| The Greens – The Green Alternative (GRÜNE) | 39,904 | 12.59 | +1.86 | 5 | +1 | |
| Forward Tyrol (VORWÄRTS) | 30,229 | 9.54 | New | 4 | New | |
| Freedom Party of Austria (FPÖ) | 29,594 | 9.34 | –3.07 | 4 | ±0 | |
| Fritz Dinkhauser List – Citizens' Forum Tyrol (FRITZ) | 17,785 | 5.61 | –12.74 | 2 | –5 | |
| Citizens' Club Tyrol (GURGISER) | 15,326 | 4.84 | New | 0 | New | |
| Team Stronach (STRONACH) | 10,637 | 3.36 | New | 0 | New | |
| For Tyrol (FUR) | 2,322 | 0.73 | New | 0 | New | |
| Communist Party of Austria (KPÖ) | 1,690 | 0.53 | –0.63 | 0 | ±0 | |
| Pirate Party of Austria (PIRAT) | 1,207 | 0.38 | +0.38 | 0 | ±0 | |
| Invalid/blank votes | 4,759 | – | – | – | – | |
| Total | 321,611 | 100 | – | 36 | 0 | |
| Registered voters/turnout | 532,496 | 60.40 | –5.44 | – | – | |
| Source: Tyrolean Government | ||||||
Results by constituency
| Constituency | ÖVP | SPÖ | Grüne | Forward | FPÖ | FRITZ | Citizens Club |
Others | Total seats |
Turnout | |||||||
|---|---|---|---|---|---|---|---|---|---|---|---|---|---|---|---|---|---|
| % | S | % | S | % | S | % | S | % | S | % | S | % | S | % | |||
| Innsbruck City | 22.6 | 1 | 15.5 | 1 | 24.6 | 1 | 7.8 | 11.8 | 6.9 | 5.1 | 5.7 | 3 | 54.2 | ||||
| Imst | 48.7 | 1 | 15.6 | 7.9 | 8.7 | 7.0 | 5.4 | 3.1 | 3.5 | 1 | 62.5 | ||||||
| Innsbruck-Land | 35.0 | 2 | 13.3 | 1 | 15.0 | 1 | 9.4 | 8.8 | 7.1 | 6.1 | 5.3 | 4 | 61.8 | ||||
| Kitzbühel | 44.9 | 1 | 12.9 | 9.0 | 8.3 | 9.4 | 5.3 | 3.6 | 6.5 | 1 | 58.2 | ||||||
| Kufstein | 39.4 | 2 | 14.1 | 10.5 | 7.7 | 11.6 | 5.2 | 5.7 | 5.9 | 2 | 59.5 | ||||||
| Landeck | 55.8 | 1 | 14.6 | 6.2 | 9.1 | 5.6 | 4.3 | 2.1 | 2.3 | 1 | 66.2 | ||||||
| Lienz | 49.5 | 1 | 14.3 | 7.9 | 7.9 | 11.0 | 3.3 | 1.6 | 4.6 | 1 | 63.9 | ||||||
| Reutte | 37.2 | 6.3 | 7.0 | 33.3 | 4.7 | 2.3 | 5.9 | 3.4 | 0 | 65.9 | |||||||
| Schwaz | 43.6 | 1 | 13.2 | 9.6 | 7.5 | 9.5 | 5.2 | 6.6 | 4.9 | 1 | 60.0 | ||||||
| Remaining seats | 6 | 3 | 3 | 4 | 4 | 2 | – | 22 | |||||||||
| Total | 39.4 | 16 | 13.7 | 5 | 12.6 | 5 | 9.5 | 4 | 9.3 | 4 | 5.6 | 2 | 4.8 | 0 | 5.0 | 36 | 60.4 |
| Source: Tyrolean Government | |||||||||||||||||
References
- "State results - 2013 Landtag election". Tyrolean Government.
- "New government presents program". ORF. 14 May 2013.
| State elections | |||||||||||||||||||||||||
|---|---|---|---|---|---|---|---|---|---|---|---|---|---|---|---|---|---|---|---|---|---|---|---|---|---|
| Municipal and mayoral elections |
| ||||||||||||||||||||||||