Climate of Peru
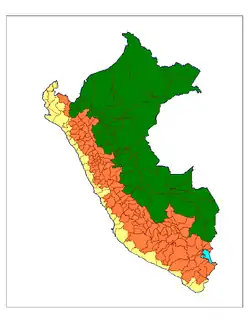
Climate of Peru describes the diverse climates of this large South American country with an area of 1,285,216 km2 (496,225 sq mi). Peru is located entirely in the tropics but features desert and mountain climates as well as tropical rain forests. Elevations above sea level in the country range from −37 metres (−121 ft) to 6,788 metres (22,270 ft) and precipitation ranges from less than 20 millimetres (0.79 in) annually to more than 8,000 millimetres (310 in). There are three main climatic regions: the Pacific Ocean coast is one of the driest deserts in the world but with some unique features; the high Andes mountains have a variety of microclimates depending on elevation and exposure and with temperatures and precipitation from temperate to polar and wet to dry; and the Amazon Basin has tropical climates, mostly with abundant precipitation, along with sub-tropical climates in elevations above 1,550 metres (5,090 ft).
The Pacific coastal desert
The coastal desert of Peru extends unbroken from near the northern border with Ecuador to the southern border with Chile, a north to south distance of 1,600 kilometres (990 mi). Three names are sometimes applied to the desert in different parts of the coastline. The Sechura Desert is in northern Peru. Southward is the Peruvian coastal desert which becomes at an indefinite location the Atacama Desert which continues into Chile. The Sechura desert in the north is warmer and less impacted by the cloud cover that characterizes the more southern parts of the coastal desert, but there is a uniformity in precipitation along the 1,000 mile coastline with less than 30 millimetres (1.2 in) annually. The desert strip along the Pacific is narrow, at its widest about 120 km (75 mi) before the land climbs into the Andes and precipitation increases with elevation.[1]
The following table summarizes climatic statistics for cities in the north, central, and southern parts of the coastal desert
| Location | Latitude | Average annual temp. | Hottest month(s) | Coolest month(s) | Annual precipitation | Wettest month(s) | Climate (Köppen classification ) |
|---|---|---|---|---|---|---|---|
| Talara | 4.58° S | 22.3 °C (72.1 °F) | 26.0 °C (78.8 °F) (Feb, Mar) | 19.4 °C (66.9 °F) (Aug) | 26 millimetres (1.0 in) | Feb -- 9 millimetres (0.35 in) | Bwh |
| Lima | 12.05° S | 18.7 °C (65.7 °F) | 23.0 °C (73.4 °F) (Feb) | 15.3 °C (59.5 °F) (Aug) | 16 millimetres (0.63 in) | Jul, Aug, Sep -- 3 millimetres (0.12 in) | Bwh |
| Tacna | 18.01° S | 17.8 °C (64.0 °F) | 21.9 °C (71.4 °F) (Feb) | 14.0 °C (57.2 °F) (July) | 18 millimetres (0.71 in) | Aug -- 4 millimetres (0.16 in) | Bwk |

A characteristic of the Peruvian coastal desert is low average temperatures despite its tropical latitudes. In the tropics the average annual temperature is usually at least 25 °C (77 °F) with little temperature variation among months. By contrast most of the Peruvian coastal desert has average annual temperatures of less than 20 °C (68 °F) and with temperatures falling to or near 10 °C (50 °F) during the Austral winter.[3][4] The relatively low temperatures of the Peruvian coastal desert are caused by the cold Humboldt Current. Ocean water temperatures in Lima in September, the coldest month, are as low as 14.4 °C (57.9 °F) similar to water temperatures near Los Angeles during its winter months.[5][6]
The cold waters of the Humboldt Current also create a moist fog called garúa in Peru. The cold water, especially in the Austral winter from May to November, cause an inversion, the air near the ocean surface being cooler than the air above, contrary to most climatic situations. During the Austral winter, the trade winds blow thick stratus clouds inland over coastal areas up to an elevation of 1,000 metres (3,300 ft) and the dense fog coalesces into drizzle and mist. In the austral summer from December to April, the weather is mostly sunny.[7]

The moisturizing impact of the fog is increased by the high average humidity of the coastal deserts. For example, Lima has an average humidity of 84 percent, more than double the average humidity of most deserts.[8] As a result of the fog, Lima gets only 1230 hours of sunshine annually, and less that 50 hours each in the months of July, Aug, and Sept.[9] (By contrast, Seattle, Washington, not noted for its sunny weather, gets 2,170 hours of sunshine annually[10] and "foggy London town" gets 1,618 hours of sunshine annually.)[11]
As elevation increases moving inland from Lima and other coastal locations, so also does precipitation. Chosica, 50 kilometres (31 mi) inland from the Pacific at an elevation of 835 metres (2,740 ft) gets 109 millimetres (4.3 in) annually of precipitation compared to Lima's precipitation of 16 millimetres (0.63 in). Matucana, 80 km (50 mi) inland at an elevation of 2,464 m (8,084 ft) gets 479 mm (18.9 in) of precipitation.[12]
Apart from the irrigated agriculture in 57 river valleys coming down from the Andes and passing through the desert en route to the ocean,[13] the coastal desert is almost without vegetation. In a few favored locations, where mountains come close to the sea and the fog condenses on the mountain slopes, the garúa permits vegetation to thrive in "fog oases," called lomas in Peru. Lomas range in size from very small to more than 40,000 hectares (99,000 acres) and their flora includes many endemic species.Scholars have described individual lomas as "an island of vegetation in a virtual ocean of desert."[14] Peru has more than 40 lomas totalling in area less than 2,000 square kilometres (770 sq mi) out of a total coastal desert area of 144,000 square kilometres (56,000 sq mi).[15]
Andean highlands

The chain of mountains called the Andes, comprising 34 percent of the national territory, runs the length of Peru, a narrow 80 kilometres (50 mi) wide at the Ecuadorian border in the north and 350 kilometres (220 mi) wide in the south along the border with Bolivia. The Andes, with elevations almost entirely above 2,000 metres (6,600 ft) and mostly above 3,000 metres (9,800 ft), rise above the desert to the west and the tropical rain forest to the east.[16] The mountain climates are cool, often cold, with varied precipitation depending upon exposure. In general the western slopes of the Andres, facing the Pacific Ocean, are drier than the eastern slopes. Beginning at latitude 8.64° S and continuing southward are many snow-capped and glaciated peaks more that 5,000 metres (16,000 ft) in elevation. Thirty-seven mountain peaks in Peru rise to more than 6,000 metres (20,000 ft) in elevation.[17][18]
A general rule for mountainous areas is that temperature decreases by about 6.5 °C (11.7 °F) for each 1,000 metres (3,300 ft) increase in elevation provided that the change in altitude takes place at the same latitude and other factors such as precipitation and cloud cover are similar.[19] The temperature decline with increasing elevation is less than the average on the Pacific coast side of the Andes because of the unusually low temperature of the fog-bound coast. The steep slopes and the sharp changes in elevation result in a large number of microclimates in which a change of location of a few kilometres can result in major climatic changes. The common precipitation regime of the Andes is a rainy Austral summer season from October to April and a dry Austral winter from May to September.[20] Snow is common at elevations of more than 3,800 metres (12,500 ft). The city of Puno at that elevation has snow 14 days per year on average and it has snowed in every month of the year except November.[21] Puno experiences freezing temperatures an average of 226 days annually with freezes occurring in every month.[22] The permanent snow line is at about 5,000 metres (16,000 ft).[23]
The following table summarizes climatic statistics for cities in the Andes mountain region.
| City | Latitude | Elevation | Average annual temp. | Warmest month | Coolest month | Annual precipitation | Wettest month | Climate (Köppen ) |
|---|---|---|---|---|---|---|---|---|
| Arequipa | 16.40° S | 2,333 metres (7,654 ft) | 14.5 °C (58.1 °F) | 15.3 °C (59.5 °F) (Jan) | 13.2 °C (55.8 °F) (Jul) | 75 millimetres (3.0 in) | 29 millimetres (1.1 in) (Feb) | BWk |
| Cajamarca | 7.16° S | 2,730 metres (8,960 ft) | 13.0 °C (55.4 °F) | 14.2 °C (57.6 °F) (Jan) | 11.8 °C (53.2 °F) Jun) | 770 millimetres (30 in) | 133 millimetres (5.2 in) (Mar) | Cwb |
| Cusco | 13.52° S | 3,406 metres (11,175 ft) | 11.2 °C (52.2 °F) | 12.6 °C (54.7 °F) (Nov) | 8.9 °C (48.0 °F) (Jul) | 693 millimetres (27.3 in) | 154 millimetres (6.1 in) (Jan) | Cwb |
| Huanuco | 9.93° S | 1,903 metres (6,243 ft) | 18.7 °C (65.7 °F) | 20 °C (68 °F) (Nov) | 16.8 °C (62.2 °F) (Jul) | 388 millimetres (15.3 in) | 63 millimetres (2.5 in) (Feb) | BSh |
| Puno | 15.84° S | 3,829 metres (12,562 ft) | 8.4 °C (47.1 °F) | 9.8 °C (49.6 °F) (Nov) | 5.9 °C (42.6 °F) (Jul) | 696 millimetres (27.4 in) | 150 millimetres (5.9 in) (Jan) | ET |

The indigenous people of Peru have been farming in the Andes for thousands of years despite the severe climatic limitations. Compensating for the lack of a freeze-free growing season at elevations above 3,000 metres (9,800 ft), indigenous farmers up until the 21st century have sought out micro-climates and used techniques such as Andenes (terraces) and Waru Waru (raised beds) to capture and store heat and permit hardy crops such as potatoes to grow up to 4,050 metres (13,290 ft) in elevation.[24] Llamas and alpacas are grazed on the sparse vegetation of the Puna zone up to elevations of 4,770 metres (15,650 ft).[25]
Amazon rainforest
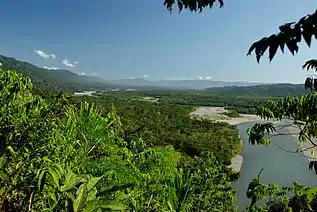
The Amazon rainforest region comprises about 56 percent of the total area of Peru and is characterized, as is the coast, by its climatic uniformity: hot average temperatures with little variation among the seasons and abundant precipitation. While there are locations that fit into all three of the Köppen tropical types of climate, Af, Am, and Aw, the differences among the three climates in Peru are small. The true tropical rainforest (Af) climate requires at least 60 millimetres (2.4 in) precipitation in all months of the year. Pucallpa (Am) has only one month that falls below that threshold; Puerto Esperanza (Aw) has three months below the Af threshold. The driest months are in the Austral winter of June through August.[4]
The dividing line between the Amazon and Andean climates is uncertain, but depends mostly on elevation. Temperatures become cooler with elevation and around 1,550 metres (5,090 ft) elevation the climate becomes sub-tropical rather than tropical, a climate often characterized as "eternal spring." In Oxapampa, Cfb under the Köppen classication, temperatures rarely fall below 11 °C (52 °F) or rise above 26 °C (79 °F) and precipitation is abundant year-round. A few locations at elevations similar to Oxapampa have a pronounced dry season and are classified as Cwb (sub-tropical with a dry winter), rather than Cfb.[26][4]
The following table summarizes climatic statistics for cities and towns in the Amazon rainforest region.
| City | Latitude | Elevation | Average annual temp. | Warmest month | Coolest month | Annual precipitation | Wettest month | Climate (Köppen) |
|---|---|---|---|---|---|---|---|---|
| Iquitos | 3.75° S | 103 metres (338 ft) | 26.4 °C (79.5 °F) | 26.9 °C (80.4 °F) (Oct,Nov) | 25.4 °C (77.7 °F) (Jul) | 2,857 millimetres (112.5 in) | 295 millimetres (11.6 in) (Mar) | Af |
| Oxapampa | 10.57° S | 1,810 metres (5,940 ft) | 18.4 °C (65.1 °F) | 19.2 °C (66.6 °F) (Oct,Jan,Feb) | 17.0 °C (62.6 °F) Jul) | 1,411 millimetres (55.6 in) | 203 millimetres (8.0 in) (Mar) | Cfb |
| Pucallpa | 8.38° S | 155 metres (509 ft) | 26.4 °C (79.5 °F) | 27.1 °C (80.8 °F) (Nov) | 25.3 °C (77.5 °F) (Jun) | 1,667 millimetres (65.6 in) | 190 millimetres (7.5 in) (Nov) | Am |
| Esperanza | 9.77° S | 232 metres (761 ft) | 25.4 °C (77.7 °F) | 26.2 °C (79.2 °F) (Oct) | 24.2 °C (75.6 °F) (Jul) | 1,870 millimetres (74 in) | 258 millimetres (10.2 in) (Jan) | Aw |
| Quincemil | 13.23° S | 643 metres (2,110 ft) | 22.7 °C (72.9 °F) | 23.9 °C (75.0 °F) (Oct) | 21.3 °C (70.3 °F) (Jul) | 5,016 millimetres (197.5 in) | 734 millimetres (28.9 in) (Jan) | Af |
While Quincemil has the highest precipitation of places in Peru with a weather station, climatologists say that the slopes of low mountains northwest of Quincemil in Manu National Park may receive more than 8,000 millimetres (310 in) of rain annually.[27]
El Niño
El Niño (the "boy child") and La Niña (the "girl child") are the manifestations of the El Niño–Southern Oscillation which influences weather around the world, but especially near the coasts of northern Peru and southern Ecuador. The warm phase, El Niño, occurs every two to seven years. Ocean temperatures on the coast of Peru increase by as much as 3 °C (5 °F) during the Austral summer, beginning about Christmas, the name El Niño referring to the birth of Jesus. El Niño brings warmer and sunnier weather to the coasts of Peru than normal. In especially impactful years, as occurred in 1982-1983, 1997-1998, and 2015-2017,[28] El Nino causes heavy rainfall in coastal northern Peru in what is a desert that rarely receives any rain at all. Floods and landslides (huaycos) are the consequence; the warm water negatively impacts fishing; and the southern Andes of Peru suffer reduced precipitation.[29]
Global warming
Climatic statistics cited in this article are for the period 1982-2012 and may become inaccurate in the future because of climate change and global warming.[30] Average annual temperatures rose by 1 °C (1.8 °F) from 1960 until 2016 and are predicted to increase by an additional 2 °C (3.6 °F) to 3 °C (5.4 °F) by 2065. Sea level is projected to rise by 50 centimetres (20 in) by 2100. Extreme weather events, including drought and flood, are anticipated to become more frequent.[31]
The most immediately visible problem of climatic change in Peru is the melting of glaciers in the Andes. Peru is home to 71 percent of the world's tropical glaciers and since 1970 glacial volume has decreased by 40 percent. Many areas of Peru depend upon glacial melt for water for consumption, irrigation, and industry. In the Cordillera Blanca, for example, glacial melt provides 80 percent of water in the rivers during the dry season and 4-8 percent during the rainy season. The consequence of increased glacial melt is floods during the wet season and less water in rivers during the dry season. The desert coast of Peru has 52 percent of Peru's population on 12 percent of its land area[32] and is especially vulnerable to fluctuations in its water supply, nearly all of which comes from rivers originating in the Andes. Accelerated glacial melt and the eventual disappearance of glaciers will severely impact the quantity of water available in the coastal and mountain regions.[33]
References
- Google Earth
- "Peru Climate". Climate-data.org. Retrieved 8 Aug 2020.
- "South America Precipitation Map". Research Gate. Retrieved 8 Aug 2020.
- "Peru Climate".
- "Lima Sea Temperature". Sea Temperature. Retrieved 8 Aug 2020.
- "Long Beach sea temperature". Sea Temperature. Retrieved 8 Aug 2020.
- Rundel, P. W., Dillion, M.O., Palma, B., Mooney, H.A., Gulmon, S. L., and Ehleringer, J. R., "The Phytogeography and Ecology of the Coastal Atacama and Peruvian Deserts," In Aliso. (1 ed., Vol. 13, pp. 1-49)
- "Lima, Peru. Weatherbase, http://www.weatherbase.com/weather/weather.php3?s=82648&cityname=Lima-Lima-Peru&units=metric, accessed 17 Jul 2016
- "Lima Sunshine". Weather & Climate. Retrieved 7 Aug 2020.
- "Current Results". Retrieved 7 Aug 2020.
- "London". Weatherbase. Retrieved 8 Aug 2020.
- "Peru". Weatherbase. Retrieved 8 Aug 2020.
- Pozorski, Shelia and Pozorski, Thomas, (2006a) Early Settlement and Subsistence in the Casma Valley, Iowa City: University of Iowa Press, pp 1-2. Downloaded from Project MUSE
- Dillon, Michael O., "The Solanaceae of the Lomas Formations of Coastal Peru and Chile," www.sacha.org/solanaceae/lomas_solanaceae.pdf, accessed 17 Jul 2017
- "South America, Site SA42, Lomas Formations, Peru" http://botany.si.edu/projects/cpd/sa/sa43.htm and "South America, Site SA43, Lomas Formations of the Atacama Desert, Chile", http://botany.si.edu/projects/cpd/sa/sa42.htm, accessed 16 July 2016
- Google Earth
- Peruvian Instituto Geografico Militar 1:100, 000 map series published in Lima, various dates from 1950's to present, Sheets 18-h, 19-h, 19-i, 20-i, 21-j, 27-q, 28-t, 28-u, 30-y, 31-q, 32-q, 32-s and 33-s cover the 6000m peaks of Peru.
- Hudson, Rex A. "Peru: A Country Study". General Publishing Office, Washington DC. Retrieved 9 Aug 2020.
- "UCAR Center for Science Education". Retrieved 9 Aug 2020.
- Hudson.
- Best time to visit. "Best time to visit, weather and climate Puno". Retrieved 9 Aug 2020.
- "Puno, Peru". Weatherbase. Retrieved 9 August 2020.
- Saavedra, Freddy; Kampf, Stephanie K.; Fassnacht, Steven R.; Sibold, Jason C. "A snow climatology of the Andes Mountains from MODIS snow cover date". Royal Meteorological Society. International Journal of Climatology. Retrieved 9 Aug 2020.
- Zimmerer, Karl S. "The Ecogeography of Andean Potatoes". Retrieved 8 Aug 2020.
- Maldonado Fonken, Monica Sofia. "An introduction to the Bofedales of the Peruvian High Andes". Research Gate. Retrieved 9 Aug 2020.
- "Climate of Oxapampa". Weatherspark. Retrieved 10 Aug 2020.
- "Del Manu". SERNAP. Retrieved 7 Aug 2020.
- "The 2015-2016 El Nino and Beyone". ECMWF Newsletter, No. 151, Spring 2017. Retrieved 10 Aug 2020.
- Rodriguez-Morata, Clara; Ballesteros-Canovas, Juan Antonio; Diaz, Henry F.; Rohrer, Mario. "The Nomalous 2017 El Nino event in Peru". Research Gate. Retrieved 10 Aug 2020.
- "Data Sources". Climate-Data.org. Retrieved 11 Aug 2020.
- "Climate Change Risk Profile Peru" (PDF). USAID Fact Sheet. Retrieved 16 Aug 2020.
- Hudson, Rex A. "Peru: A Country Study". Country Studies US. Retrieved 16 Aug 2020.
- Climate Change Risk Profile.
