Demographics of Uruguay
This article is about the demographic features of the population of Uruguay, including population density, ethnicity, education level, health of the populace, economic status, religious affiliations and other aspects of the population.
|
|
Population
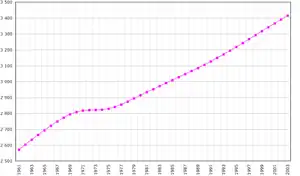
| Year | Pop. | ±% p.a. |
|---|---|---|
| 1852 | 132 | — |
| 1860 | 229.5 | +7.16% |
| 1908 | 1,042.7 | +3.20% |
| 1963 | 2,595.5 | +1.67% |
| 1975 | 2,788.4 | +0.60% |
| 1985 | 2,955.2 | +0.58% |
| 1996 | 3,163.8 | +0.62% |
| 2004 | 3,241 | +0.30% |
| 2011 | 3,286.3 | +0.20% |
According to the 2019 revision of the World Population Prospects[1][2] the total population was 3,449,285 in 2018, compared to only 2,239,000 in 1950. The proportion of children below the age of 15 in 2015 was 21.4%, 64.2% was between 15 and 65 years of age, while 14.4% was 65 years or older.[3]
| Total population | Proportion aged 0–14 (%) |
Proportion aged 15–64 (%) |
Proportion aged 65+ (%) | |
|---|---|---|---|---|
| 1950 | 2 239 000 | 27.9 | 63.9 | 8.2 |
| 1955 | 2 373 000 | 27.6 | 64.3 | 8.1 |
| 1960 | 2 539 000 | 27.8 | 64.1 | 8.1 |
| 1965 | 2 695 000 | 28.1 | 63.6 | 8.3 |
| 1970 | 2 810 000 | 27.9 | 63.3 | 8.8 |
| 1975 | 2 830 000 | 27.7 | 62.7 | 9.6 |
| 1980 | 2 916 000 | 26.9 | 62.7 | 10.4 |
| 1985 | 3 012 000 | 26.8 | 62.3 | 10.9 |
| 1990 | 3 110 000 | 26.0 | 62.4 | 11.6 |
| 1995 | 3 225 000 | 25.0 | 62.6 | 12.4 |
| 2000 | 3 321 000 | 24.5 | 62.4 | 13.0 |
| 2005 | 3 326 000 | 23.8 | 62.8 | 13.5 |
| 2010 | 3 374 000 | 22.5 | 63.7 | 13.8 |
| 2015 | 3 432 000 | 21.4 | 64.2 | 14.4 |
Structure of the population
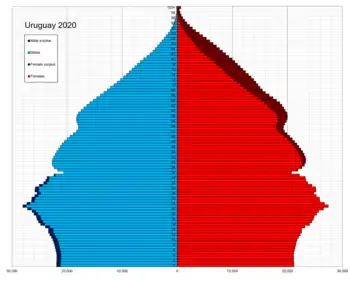
Structure of the population (04.10.2011) (Census):
| Age group | Male | Female | Total | % |
|---|---|---|---|---|
| Total | 1 577 416 | 1 708 461 | 3 285 877 | 100 |
| 0-4 | 112 704 | 107 641 | 220 345 | 6,71 |
| 5-9 | 121 820 | 116 248 | 238 068 | 7,25 |
| 10-14 | 131 022 | 125 530 | 256 552 | 7,81 |
| 15-19 | 133 042 | 128 649 | 261 691 | 7,96 |
| 20-24 | 119 928 | 121 078 | 241 006 | 7,33 |
| 25-29 | 112 852 | 115 533 | 228 385 | 6,95 |
| 30-34 | 113 884 | 119 481 | 233 365 | 7,10 |
| 35-39 | 108 704 | 113 817 | 222 521 | 6,77 |
| 40-44 | 98 612 | 104 486 | 203 098 | 6,18 |
| 45-49 | 95 812 | 102 961 | 198 773 | 6,05 |
| 50-54 | 93 175 | 101 390 | 194 565 | 5,92 |
| 55-59 | 81 828 | 91 179 | 173 007 | 5,27 |
| 60-64 | 69 864 | 80 911 | 150 775 | 4,59 |
| 65-69 | 58 769 | 72 794 | 131 563 | 4,00 |
| 70-74 | 47 705 | 64 690 | 112 395 | 3,42 |
| 75-79 | 36 806 | 56 853 | 93 659 | 2,85 |
| 80-84 | 24 912 | 45 593 | 70 505 | 2,15 |
| 85-89 | 11 535 | 25 891 | 37 426 | 1,14 |
| 90-94 | 3 636 | 10 477 | 14 113 | 0,43 |
| 95-99 | 733 | 2 813 | 3 546 | 0,11 |
| 100+ | 73 | 446 | 519 | 0,02 |
| Age group | Male | Female | Total | Percent |
|---|---|---|---|---|
| 0-14 | 365 546 | 349 419 | 714 965 | 21,76 |
| 15-64 | 1 027 701 | 1 079 485 | 2 107 186 | 64,13 |
| 65+ | 184 169 | 279 557 | 464 026 | 14,12 |
Vital statistics
UN estimates
The Population Department of the United Nations prepared the following estimates for Uruguay. [5]
| Period | Live births per year |
Deaths per year |
Natural change per year |
CBR* | CDR* | NC* | TFR* | IMR* | Life expectancy total |
Life expectancy males |
Life expectancy females |
|---|---|---|---|---|---|---|---|---|---|---|---|
| 1950–1955 | 49,000 | 24,000 | 25,000 | 21.2 | 10.5 | 10.7 | 2.73 | 57 | 66.0 | 63.3 | 69.3 |
| 1955–1960 | 54,000 | 25,000 | 29,000 | 21.9 | 10.0 | 11.9 | 2.83 | 53 | 67.0 | 64.2 | 70.3 |
| 1960–1965 | 57,000 | 25,000 | 32,000 | 21.9 | 9.5 | 12.4 | 2.90 | 48 | 68.3 | 65.3 | 71.5 |
| 1965–1970 | 56,000 | 26,000 | 30,000 | 20.5 | 9.6 | 10.8 | 2.80 | 47 | 68.5 | 65.5 | 71.8 |
| 1970–1975 | 60,000 | 28,000 | 32,000 | 21.1 | 10.0 | 11.1 | 3.00 | 46 | 68.7 | 65.6 | 72.1 |
| 1975–1980 | 58,000 | 29,000 | 29,000 | 20.2 | 10.1 | 10.1 | 2.89 | 42 | 69.5 | 66.3 | 73.1 |
| 1980–1985 | 54,000 | 29,000 | 25,000 | 18.3 | 9.8 | 8.5 | 2.57 | 34 | 70.9 | 67.6 | 74.5 |
| 1985–1990 | 56,000 | 30,000 | 26,000 | 18.2 | 9.8 | 8.4 | 2.53 | 23 | 72.1 | 68.6 | 75.7 |
| 1990–1995 | 58,000 | 31,000 | 27,000 | 18.2 | 9.7 | 8.5 | 2.49 | 20 | 73.0 | 69.2 | 76.8 |
| 1995–2000 | 55,000 | 31,000 | 24,000 | 16.9 | 9.5 | 7.4 | 2.30 | 16 | 74.2 | 70.4 | 77.9 |
| 2000–2005 | 53,000 | 31,000 | 22,000 | 15.9 | 9.5 | 6.5 | 2.20 | 14 | 75.3 | 71.6 | 78.9 |
| 2005–2010 | 51,000 | 31,000 | 20,000 | 15.1 | 9.3 | 5.8 | 2.12 | 13 | 76.4 | 72.7 | 79.9 |
| 2010–2015 | 49,000 | 32,000 | 17,000 | 14.5 | 9.4 | 5.1 | 2.05 | 11 | 77.1 | 73.6 | 80.5 |
| 2015–2020 | 49,000 | 32,000 | 17,000 | 14.1 | 9.3 | 4.8 | 2.00 | 10 | 77.9 | 74.5 | 81.1 |
| * CBR = crude birth rate (per 1000); CDR = crude death rate (per 1000); NC = natural change (per 1000); IMR = infant mortality rate per 1000 births; TFR = total fertility rate (number of children per woman) | |||||||||||
Total fertility rate (1880–1899)
The total fertility rate is the number of children born per woman. It is based on fairly good data for the entire period. Sources: Our World In Data and Gapminder Foundation.[6]
| Years | 1880 | 1881 | 1882 | 1883 | 1884 | 1885 | 1886 | 1887 | 1888 | 1889 | 1890[6] |
|---|---|---|---|---|---|---|---|---|---|---|---|
| Total Fertility Rate in Uruguay | 5.76 | 5.76 | 5.76 | 5.71 | 5.21 | 5.45 | 5.56 | 5.64 | 5.63 | 5.57 | 5.45 |
| Years | 1891 | 1892 | 1893 | 1894 | 1895 | 1896 | 1897 | 1898 | 1899[6] |
|---|---|---|---|---|---|---|---|---|---|
| Total Fertility Rate in Uruguay | 5.44 | 5.31 | 5.04 | 5.11 | 5.25 | 5.07 | 4.3 | 4.5 | 4.6 |
Births and deaths
| Average population[7][8] | Live births | Deaths | Natural change | Crude birth rate (per 1000) | Crude death rate (per 1000) | Natural change (per 1000) | Total fertility rate[fn 1][6] | |
|---|---|---|---|---|---|---|---|---|
| 1900 | 926,000 | 30,580 | 12,878 | 17,702 | 33.0 | 13.9 | 19.1 | 4.5 |
| 1901 | 951,000 | 31,703 | 12,504 | 19,199 | 33.3 | 13.1 | 20.2 | 4.41 |
| 1902 | 976,000 | 31,526 | 13,439 | 18,087 | 32.3 | 13.8 | 18.5 | 4.31 |
| 1903 | 1,004,000 | 32,600 | 13,673 | 18,927 | 32.5 | 13.6 | 18.9 | 4.34 |
| 1904 | 1,023,000 | 26,984 | 11,515 | 15,469 | 26.4 | 11.3 | 15.1 | 4.37 |
| 1905 | 1,056,000 | 33,709 | 13,612 | 20,097 | 31.9 | 12.9 | 19.0 | 4.4 |
| 1906 | 1,087,000 | 32,578 | 15,083 | 17,495 | 30.0 | 13.9 | 16.1 | 4.42 |
| 1907 | 1,124,000 | 33,657 | 15,561 | 18,096 | 29.9 | 13.8 | 16.1 | 4.45 |
| 1908 | 1,043,000 | 35,520 | 14,421 | 21,099 | 34.1 | 13.8 | 20.2 | 4.43 |
| 1909 | 1,079,000 | 35,663 | 15,249 | 20,414 | 33.1 | 14.1 | 18.9 | 4.41 |
| 1910 | 1,116,000 | 35,927 | 16,515 | 19,412 | 32.2 | 14.8 | 17.4 | 4.38 |
| 1911 | 1,160,000 | 37,530 | 16,552 | 20,978 | 32.4 | 14.3 | 18.1 | 4.36 |
| 1912 | 1,208,000 | 39,171 | 16,745 | 22,426 | 32.4 | 13.9 | 18.6 | 4.34 |
| 1913 | 1,261,000 | 40,315 | 15,374 | 24,941 | 32.0 | 12.2 | 19.8 | 4.22 |
| 1914 | 1,297,000 | 38,571 | 15,350 | 23,221 | 29.7 | 11.8 | 17.9 | 4.1 |
| 1915 | 1,327,000 | 38,046 | 16,602 | 21,444 | 28.7 | 12.5 | 16.2 | 3.98 |
| 1916 | 1,359,000 | 36,983 | 20,338 | 16,645 | 27.2 | 15.0 | 12.2 | 3.86 |
| 1917 | 1,387,000 | 36,752 | 17,348 | 19,404 | 26.5 | 12.5 | 14.0 | 3.74 |
| 1918 | 1,409,000 | 38,914 | 20,009 | 18,905 | 27.6 | 14.2 | 13.4 | 3.69 |
| 1919 | 1,442,000 | 39,307 | 18,904 | 20,403 | 27.3 | 13.1 | 14.1 | 3.64 |
| 1920 | 1,473,000 | 39,335 | 19,041 | 20,294 | 26.7 | 12.9 | 13.8 | 3.59 |
| 1921 | 1,505,000 | 39,611 | 18,449 | 21,162 | 26.3 | 12.3 | 14.1 | 3.53 |
| 1922 | 1,542,000 | 40,261 | 16,415 | 23,846 | 26.1 | 10.6 | 15.5 | 3.48 |
| 1923 | 1,579,000 | 40,231 | 18,110 | 22,121 | 25.5 | 11.5 | 14.0 | 3.45 |
| 1924 | 1,616,000 | 41,880 | 19,132 | 22,748 | 25.9 | 11.8 | 14.1 | 3.43 |
| 1925 | 1,653,000 | 42,167 | 19,332 | 22,835 | 25.5 | 11.7 | 13.8 | 3.4 |
| 1926 | 1,695,000 | 43,091 | 17,828 | 25,263 | 25.4 | 10.5 | 14.9 | 3.37 |
| 1927 | 1,737,000 | 42,845 | 19,939 | 22,906 | 24.7 | 11.5 | 13.2 | 3.34 |
| 1928 | 1,782,000 | 44,632 | 19,070 | 25,562 | 25.0 | 10.7 | 14.3 | 3.27 |
| 1929 | 1,823,000 | 44,236 | 19,660 | 24,576 | 24.3 | 10.8 | 13.5 | 3.2 |
| 1930 | 1,875,000 | 45,718 | 20,049 | 25,669 | 24.4 | 10.7 | 13.7 | 3.13 |
| 1931 | 1,922,000 | 44,854 | 21,163 | 23,691 | 23.3 | 11.0 | 12.3 | 3.06 |
| 1932 | 1,956,000 | 44,036 | 19,825 | 24,211 | 22.5 | 10.1 | 12.4 | 2.99 |
| 1933 | 1,982,000 | 41,650 | 20,358 | 21,292 | 21.0 | 10.3 | 10.7 | 2.93 |
| 1934 | 2,007,000 | 41,337 | 20,065 | 21,272 | 20.6 | 10.0 | 10.6 | 2.86 |
| 1935 | 2,030,000 | 41,426 | 21,514 | 19,912 | 20.4 | 10.6 | 9.8 | 2.8 |
| 1936 | 2,053,000 | 40,705 | 19,843 | 20,862 | 19.8 | 9.7 | 10.2 | 2.74 |
| 1937 | 2,080,000 | 41,337 | 21,561 | 19,776 | 19.9 | 10.4 | 9.5 | 2.68 |
| 1938 | 2,108,000 | 41,701 | 21,658 | 20,043 | 19.8 | 10.3 | 9.5 | |
| 1939 | 2,132,000 | 42,862 | 19,341 | 23,521 | 20.1 | 9.1 | 11.0 | |
| 1940 | 2,155,000 | 42,893 | 20,695 | 22,198 | 19.9 | 9.6 | 10.3 | |
| 1941 | 2,175,000 | 44,287 | 20,381 | 23,906 | 20.4 | 9.4 | 11.0 | |
| 1942 | 2,194,000 | 42,670 | 20,646 | 22,024 | 19.4 | 9.4 | 10.0 | |
| 1943 | 2,211,000 | 43,500 | 20,738 | 22,762 | 19.7 | 9.4 | 10.3 | |
| 1944 | 2,216,000 | 46,443 | 19,990 | 26,453 | 21.0 | 9.0 | 11.9 | |
| 1945 | 2,266,000 | 49,021 | 19,627 | 29,394 | 21.6 | 8.7 | 13.0 | |
| 1946 | 2,290,000 | 48,978 | 18,415 | 30,563 | 21.4 | 8.0 | 13.3 | |
| 1947 | 2,317,000 | 46,796 | 20,139 | 26,657 | 20.2 | 8.7 | 11.5 | |
| 1948 | 2,343,000 | 49,033 | 19,326 | 29,707 | 20.9 | 8.2 | 12.7 | |
| 1949 | 2,383,000 | 54,838 | 18,351 | 36,487 | 23.0 | 7.7 | 15.3 | |
| 1950 | 2,239,000 | 56,858 | 19,199 | 37,659 | 25.4 | 8.6 | 16.8 | |
| 1951 | 2,261,000 | 45,281 | 19,190 | 26,091 | 20.0 | 8.5 | 11.5 | |
| 1952 | 2,286,000 | 46,710 | 19,083 | 27,627 | 20.4 | 8.4 | 12.1 | |
| 1953 | 2,313,000 | 47,464 | 19,408 | 28,056 | 20.5 | 8.4 | 12.1 | |
| 1954 | 2,342,000 | 49,888 | 19,153 | 30,735 | 21.3 | 8.2 | 13.1 | |
| 1955 | 2,373,000 | 56,111 | 20,611 | 35,500 | 23.7 | 8.7 | 15.0 | |
| 1956 | 2,405,000 | 56,389 | 19,895 | 36,494 | 23.5 | 8.3 | 15.2 | |
| 1957 | 2,438,000 | 56,337 | 21,722 | 34,615 | 23.1 | 8.9 | 14.2 | |
| 1958 | 2,471,000 | 57,100 | 20,937 | 36,163 | 23.1 | 8.5 | 14.6 | |
| 1959 | 2,505,000 | 56,589 | 23,523 | 33,066 | 22.6 | 9.4 | 13.2 | |
| 1960 | 2,539,000 | 56,302 | 22,104 | 38,507 | 22.2 | 8.7 | 15.2 | |
| 1961 | 2,572,000 | 54,950 | 21,954 | 42,503 | 21.4 | 8.5 | 16.5 | |
| 1962 | 2,604,000 | 56,120 | 22,563 | 43,541 | 21.6 | 8.7 | 16.7 | |
| 1963 | 2,635,000 | 57,141 | 23,524 | 39,542 | 21.7 | 8.9 | 15.0 | |
| 1964 | 2,666,000 | 55,100 | 24,118 | 38,707 | 20.7 | 9.0 | 14.5 | |
| 1965 | 2,695,000 | 53,830 | 24,774 | 35,440 | 20.0 | 9.2 | 13.2 | |
| 1966 | 2,723,000 | 51,120 | 24,862 | 33,966 | 18.8 | 9.1 | 12.5 | |
| 1967 | 2,750,000 | 52,010 | 26,484 | 34,024 | 18.9 | 9.6 | 12.4 | |
| 1968 | 2,775,000 | 53,330 | 25,991 | 35,277 | 19.2 | 9.4 | 12.7 | |
| 1969 | 2,795,000 | 56,750 | 27,544 | 28,456 | 20.3 | 9.9 | 10.2 | |
| 1970 | 2,810,000 | 54,870 | 26,441 | 28,429 | 19.5 | 9.4 | 10.1 | |
| 1971 | 2,818,000 | 55,990 | 28,527 | 27,463 | 19.9 | 10.1 | 9.7 | |
| 1972 | 2,822,000 | 56,470 | 28,327 | 28,143 | 20.0 | 10.0 | 10.0 | |
| 1973 | 2,822,000 | 56,640 | 28,438 | 28,202 | 20.1 | 10.1 | 10.0 | |
| 1974 | 2,824,000 | 58,280 | 28,289 | 29,991 | 20.7 | 10.0 | 10.6 | |
| 1975 | 2,830,000 | 59,140 | 27,437 | 31,703 | 20.9 | 9.7 | 11.2 | |
| 1976 | 2,842,000 | 59,190 | 28,845 | 30,345 | 20.8 | 10.2 | 10.7 | |
| 1977 | 2,857,000 | 57,976 | 28,927 | 29,049 | 20.3 | 10.1 | 10.2 | |
| 1978 | 2,876,000 | 57,276 | 28,041 | 29,235 | 19.9 | 9.8 | 10.2 | |
| 1979 | 2,896,000 | 55,770 | 28,321 | 27,449 | 19.3 | 9.8 | 9.5 | |
| 1980 | 2,916,000 | 53,854 | 29,844 | 24,010 | 19.1 | 10.6 | 8.5 | |
| 1981 | 2,935,000 | 53,923 | 27,644 | 26,279 | 18.4 | 9.4 | 9.0 | |
| 1982 | 2,954,000 | 53,713 | 27,186 | 26,527 | 18.2 | 9.2 | 9.0 | |
| 1983 | 2,973,000 | 53,405 | 28,475 | 24,930 | 18.0 | 9.6 | 8.4 | |
| 1984 | 2,993,000 | 53,348 | 30,011 | 23,337 | 17.8 | 10.0 | 7.8 | |
| 1985 | 3,012,000 | 53,766 | 28,566 | 25,200 | 17.9 | 9.5 | 8.4 | |
| 1986 | 3,031,000 | 54,080 | 28,791 | 25,289 | 17.9 | 9.5 | 8.4 | |
| 1987 | 3,050,000 | 53,368 | 29,885 | 23,483 | 17.5 | 9.8 | 7.7 | |
| 1988 | 3,069,000 | 55,798 | 30,912 | 24,886 | 18.2 | 10.1 | 8.1 | |
| 1989 | 3,089,000 | 55,324 | 29,621 | 25,703 | 17.9 | 9.6 | 8.3 | |
| 1990 | 3,110,000 | 56,013 | 30,210 | 26,277 | 18.0 | 9.7 | 8.5 | |
| 1991 | 3,132,000 | 54,754 | 29,774 | 24,980 | 17.5 | 9.5 | 8.0 | 2.51 |
| 1992 | 3,155,000 | 54,190 | 30,008 | 24,182 | 17.2 | 9.5 | 7.7 | 2.49 |
| 1993 | 3,178,000 | 55,953 | 31,616 | 24,337 | 17.6 | 9.9 | 7.7 | 2.46 |
| 1994 | 3,201,000 | 55,990 | 30,122 | 25,868 | 17.5 | 9.4 | 8.1 | 2.43 |
| 1995 | 3,224,000 | 56,695 | 31,525 | 25,170 | 17.6 | 9.8 | 7.8 | 2.40 |
| 1996 | 3,248,000 | 58,862 | 31,108 | 27,754 | 18.1 | 9.6 | 8.5 | 2.40 |
| 1997 | 3,271,000 | 58,032 | 30,451 | 27,581 | 17.7 | 9.3 | 8.4 | 2.24 |
| 1998 | 3,292,000 | 54,760 | 31,917 | 22,843 | 16.6 | 9.7 | 6.9 | 2.29 |
| 1999 | 3,309,000 | 54,004 | 32,430 | 21,574 | 16.3 | 9.8 | 6.5 | 2.24 |
| 2000 | 3,321,000 | 52,770 | 30,456 | 22,314 | 15.9 | 9.2 | 6.7 | 2.21 |
| 2001 | 3,327,000 | 51,959 | 31,228 | 20,731 | 15.6 | 9.4 | 6.2 | 2.16 |
| 2002 | 3,328,000 | 51,953 | 31,628 | 20,325 | 15.6 | 9.5 | 6.1 | 2.18 |
| 2003 | 3,325,000 | 50,631 | 32,587 | 18,044 | 15.2 | 9.8 | 5.4 | 2.14 |
| 2004 | 3,324,000 | 50,052 | 32,220 | 17,832 | 15.1 | 9.7 | 5.4 | 2.13 |
| 2005 | 3,325,000 | 46,944 | 32,319 | 14,625 | 14.1 | 9.7 | 4.4 | 1.99 |
| 2006 | 3,330,000 | 47,410 | 31,056 | 16,354 | 14.2 | 9.3 | 4.9 | 2.01 |
| 2007 | 3,338,000 | 47,373 | 33,706 | 13,667 | 14.2 | 10.1 | 4.1 | 1.98 |
| 2008 | 3,349,000 | 47,484 | 31,363 | 16,121 | 14.2 | 9.4 | 4.8 | 1.97 |
| 2009 | 3,360,000 | 47,152 | 32,179 | 14,973 | 14.1 | 9.6 | 4.5 | 1.93 |
| 2010 | 3,372,000 | 47,420 | 33,474 | 13,946 | 14.1 | 10.0 | 4.2 | 1.92 |
| 2011 | 3,383,000 | 46,699 | 32,807 | 13,892 | 13.9 | 9.7 | 4.1 | 1.90 |
| 2012 | 3,426,000 | 48,200 | 33,002 | 15,198 | 14.3 | 9.8 | 4.5 | 1.94 |
| 2013 | 3,440,000 | 48,681 | 32,795 | 15,886 | 14.2 | 9.5 | 4.7 | 1.96 |
| 2014 | 3,453,000 | 48,368 | 32,120 | 16,248 | 14.0 | 9.4 | 4.6 | 1.96 |
| 2015 | 3,467,000 | 48,926 | 32,967 | 15,959 | 14.1 | 9.5 | 4.6 | 1.94 |
| 2016 | 3,479,000 | 47,049 | 34,274 | 12,775 | 13.5 | 9.8 | 3.7 | 1.88 |
| 2017 | 3,493,000 | 43,036 | 33,173 | 9,863 | 12.3 | 9.5 | 2.8 | 1.71 |
| 2018 | 3,506,000 | 40,139 | 34,269 | 5,870 | 11.4 | 9.8 | 1.6 | 1.60 |
| 2019 | 3,518,000 | 37,468 | 34,807 | 2,661 | 10.7 | 9.9 | 0.8 | 1.50 |
Origins and ethnicity
Uruguayans share a Spanish linguistic and heavily Spanish cultural background with its neighbour Argentina. Most Uruguayans are descended from colonial-era settlers and immigrants from Europe with almost 96% of the population being of either sole or partial European descent,[11] with a majority of these being Spaniards, followed closely by Italians, and smaller numbers of French, Germans, Portuguese, British (English or Scots), Irish, Swiss, Russians, Poles, Bulgarians, Hungarians, Ukrainians, Lithuanians, Estonians, Latvians, Swedes, Danes, Dutch, Belgians, Austrians, Croats, Serbs, Greeks and others.
There are also smaller numbers of Western Asian (Turks, Israelis, and Lebanese) and Caucasian ethnic groups (Armenians, Georgians, and Azeris).
Many Swiss settlements (colonias or "colonies"), such as Colonia Suiza, Colonia Valdense and Nueva Helvecia, were founded in the department of Colonia. Also, there are towns founded by early British settlers, such as Conchillas and Barker. A Russian colony called San Javier is found in the department of Río Negro. There are Mennonite colonies in the department of Río Negro and in the department of Canelones.
Many of the European immigrants arrived in the late 19th century and have heavily influenced the architecture and culture of Montevideo and other major cities. For this reason, Montevideo and life within the city are very reminiscent of Western Europe.
The rest of the Uruguayan population is Black/Afro-Uruguayan of African descent and about 1 or 2% are of Asian descent, mostly are Lebanese/Syrian Arab, and Chinese or Japanese ancestry.
Amerindians descendants make up a small population in the Rural North region, with Mestizos making up 6% of the population.
Demographic distribution
Metropolitan Montevideo, with about one and a half million inhabitants, is the capital and largest city. The rest of the urban population lives in about 20 towns. Montevideo is about 200 kilometers (120 mi) away from Buenos Aires in neighboring Argentina.
Uruguay is distinguished by its high literacy rate (97.3%) and a large urban middle class.
As a result of the low birth rate, high life expectancy, and relatively high rate of emigration of younger people, Uruguay's population is quite mature. In 2006, the country had a birth rate of 13.91 births per thousand population, lower than neighboring countries Argentina (16.73 births/1000 population)[3] and Brazil (16.56 births/1,000 population).
Emigration
During the past four decades, an estimated 500,000 Uruguayans had emigrated, principally to Brazil, Argentina and Europe. (Spain is the main destination for Uruguayans, but they are also drawn to the United Kingdom, Italy, France and Germany.) Other Uruguayans went to various countries in Europe, Australia and the USA.
Neighboring ties and short distances between Uruguayan cities and Argentine capital Buenos Aires, have drawn a path of success for very talented Uruguayans who settled in the neighbor country and became famous and locally accepted. Some famous Uruguayans who excelled in Argentina are entrepreneur and financier Juan Navarro, sports journalist Victor Hugo Morales, singer and actress Natalia Oreiro, soccer players Antonio Alzamendi, Enzo Francescoli and Carlos Goyen, actor Daniel Hendler, actress China Zorrilla, entertainer Carlos Perciavalle and former playboy and journalist Luis César Avilés.
Emigration to the United States also rose recently, but remains a small part of the US population. The majority of Uruguayans in the US live in New York City, New Jersey, Washington, D.C., Florida, and urban areas of California.
Religion
Uruguay has no official religion, church and state are officially separated, and religious freedom is guaranteed. A 2008 survey by the Instituto Nacional de Estadística of Uruguay gave Catholicism as the main religion, with 45.7% of the population, 9.0% are non-Catholic Christians, 0.6% are Animists or Umbandists (an Afro-Brazilian religion) and 0.4% Jewish. 30.1% reported believing in a god, but not belonging to any religion, while 14% were Atheist or Agnostic.[13] Among the sizeable Armenian community in Montevideo the dominant religion is Christianity, specifically Armenian Apostolic.[14]
Political observers consider Uruguay the most secular country in the Americas.[15] Uruguay's secularization began with the relatively minor role of the church in the colonial era, compared with other parts of the Spanish Empire. The small numbers of Uruguay's Indians and their fierce resistance to proselytism reduced the influence of the ecclesiastical authorities.[16]
After independence, anticlerical ideas spread to Uruguay, particularly from France, further eroding the influence of the church.[17] In 1837, civil marriage was recognized and in 1861 the state took over the running of public cemeteries. In 1907, divorce was legalized and in 1909, all religious instruction was banned from state schools.[16] Under the influence of the Colorado reformer José Batlle y Ordóñez (1903–1911) complete separation of church and state was introduced with the new constitution of 1917.[16]
Demographic statistics
Demographic statistics according to the World Population Review in 2019.[18]
- One birth every 11 minutes
- One death every 16 minutes
- One net migrant every 180 minutes
- Net gain of one person every 42 minutes
Demographic statistics according to the CIA World Factbook, unless otherwise indicated.[19]
Population
- 3,369,299 (July 2018 est.)
- 3,400,425 (July 2014 est.)
Note: The 2011 Census of the National Statistics Institute of Uruguay began in September 2011 and the preliminary results, stating population of departments, were announced in December 2011. Final results with numbers for localities were still pending as of 26 June 2012.
Age structure
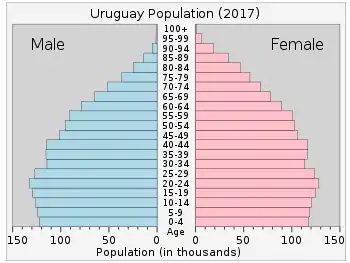
- 0-14 years: 19.91% (male 341,402 /female 329,474)
- 15-24 years: 15.56% (male 265,486 /female 258,611)
- 25-54 years: 39.48% (male 658,871 /female 671,172)
- 55-64 years: 10.68% (male 169,385 /female 190,392)
- 65 years and over: 14.38% (male 194,269 /female 290,237) (2018 est.)
Median age
- total: 35.1 years. Country comparison to the world: 82nd
- male: 33.3 years
- female: 36.9 years (2018 est.)
- total: 33.6 years
- male: 32 years
- female: 35.2 years (2011 est.)
Birth rate
- 13 births/1,000 population (2018 est.) Country comparison to the world: 150th
Death rate
- 9.4 deaths/1,000 population (2018 est.) Country comparison to the world: 54th
Total fertility rate
- 1.79 children born/woman (2018 est.) Country comparison to the world: 149th
Net migration rate
- -0.9 migrant(s)/1,000 population (2018 est.) Country comparison to the world: 139th
Population growth rate
- 0.27% (2018 est.) Country comparison to the world: 175th
- 0.24% (2011 est.)
Net migration rate
-1.45 migrant(s)/1,000 population (2011 est.)
Life expectancy at birth
- total population: 77.6 years. Country comparison to the world: 69th
- male: 74.4 years
- female: 80.8 years (2018 est.)
Urbanization
- urban population: 95.3% of total population (2018)
- rate of urbanization: 0.46% annual rate of change (2015-20 est.)
Sex ratio
- at birth: 1.04 male(s)/female
- under 15 years: 1.03 male(s)/female
- 15–64 years: 0.5 male(s)/female
- 65 years and over: 0.66 male(s)/female
- total population: 0.93 male(s)/female (2011 est.)
HIV/AIDS – adult prevalence rate
0.5% (2009 est.)
HIV/AIDS – people living with HIV/AIDS
9,900 (2009 est.)
HIV/AIDS – deaths
fewer than 500 (2007 est.)
Ethnic groups
Languages
Spanish (Uruguayan Spanish), Uruguayan Portuguese, Uruguayan Sign Language, Portuñol.
There are other ethnic minorities speaking their original languages: Italian, Catalan, German, Plautdietsch, Yiddish, etc.[20]
Literacy
definition: age 15 and over can read and write
- total population: 98.6%
- male: 98.2%
- female: 99% (2017 est.)
- total population: 98%
- male: 97.6%
- female: 98.4% (2003 est.)
School life expectancy (primary to tertiary education)
- total: 16 years
- male: 14 years
- female: 17 years (2008)
Unemployment, youth ages 15-24
- total: 23.8%. Country comparison to the world: 52nd
- male: 20.2%
- female: 28.7% (2016 est.)
Education expenditures
4.5% of GDP (2008)
Notes
- In fertility rates, 2.1 and above is a stable population and has been marked blue, 2 and below leads to an aging population and the result is that the population decreases.
References
- ""World Population prospects – Population division"". population.un.org. United Nations Department of Economic and Social Affairs, Population Division. Retrieved 9 November 2019.
- ""Overall total population" – World Population Prospects: The 2019 Revision" (xslx). population.un.org (custom data acquired via website). United Nations Department of Economic and Social Affairs, Population Division. Retrieved 9 November 2019.
- "World Population Prospects - Population Division - United Nations". esa.un.org.
- "Demographic Yearbook System". Unstats.un.org. Retrieved 15 January 2018.
- Population Division of the Department of Economic and Social Affairs of the United Nations Secretariat, World Population Prospects: The 2010 Revision Archived 6 May 2011 at the Wayback Machine
- Max Roser (2014), "Total Fertility Rate around the world over the last centuries", Our World In Data, Gapminder Foundation
- "United nations. Demographic Yearbooks". Unstats.un.org. Retrieved 15 January 2018.
- "Instituto Nacional de Estadistica: Estadisticas vitales". Ine.gub.uy. Archived from the original on 18 September 2013. Retrieved 15 January 2018.
- "Atlas Sociodemografico y de la Desigualdad en Uruguay, 2011: Ancestry" (PDF) (in Spanish). National Institute of Statistics. p. 15. Archived from the original (PDF) on 9 February 2014.
- Central Intelligence Agency (2016). "Uruguay". The World Factbook. Langley, Virginia: Central Intelligence Agency. Retrieved 1 January 2017.
- "Constituciones hispanoamericanas". Cervantesvirtual.com. Retrieved 15 January 2018.
- "South America :: URUGUAY". CIA The World Factbook.
- "Encuesta Continua de Hogares 2008 – Religion". Instituto Nacional de Estadística. Archived from the original on 14 November 2010. Retrieved 2010-12-02.
- 1/0 Technology Corp. – Paul R. Williams,John BUDDAY Running. "Armenian General Benevolent Union – Publications". Agbu.org. Archived from the original on 16 November 2010. Retrieved 2010-12-02.
- "UMM | Latin American Area Studies – Countries". Morris.umn.edu. 27 August 2009. Archived from the original on 14 July 2010. Retrieved 26 June 2010.
- "Religion – Uruguay". Library of Congress Country Studies. Retrieved 23 February 2011.
- "Explore Uruguay – About Uruguay Government". Explore Uruguay. Retrieved 23 March 2011.
- "Uruguay Population 2019", World Population Review
- "World Factbook EUROPE : United Kingdom", The World Factbook, 12 July 2018
- "Languages spoken in Uruguay". Ethnologue.org. Retrieved 7 August 2015.
| History |
|  | |||||||||
|---|---|---|---|---|---|---|---|---|---|---|---|
| Geography | |||||||||||
| Politics |
| ||||||||||
| Economy |
| ||||||||||
| Society |
| ||||||||||
| |||||||||||
| Indigenous | |||||||||
|---|---|---|---|---|---|---|---|---|---|
| Non-Indigenous |
| ||||||||