Demographics of Brazil
The population of Brazil is very diverse, comprising many races and ethnic groups. In general, Brazilians trace their origins from three sources: Europeans, Amerindians and Africans. Historically, Brazil has experienced large degrees of ethnic and racial admixture, assimilation of cultures and syncretism.
Brazil has conducted a periodical population census since 1872. Since 1940, this census has been carried out decennially. Scanned versions of the forms for each census distributed in Brazil since 1960
Population
| Year | Pop. | ±% |
|---|---|---|
| 1890 | 14,333,915 | — |
| 1900 | 17,438,434 | +21.7% |
| 1920 | 30,635,605 | +75.7% |
| 1940 | 41,165,289 | +34.4% |
| 1950 | 51,944,397 | +26.2% |
| 1960 | 70,119,071 | +35.0% |
| 1970 | 93,139,037 | +32.8% |
| 1980 | 119,002,706 | +27.8% |
| 1991 | 146,825,475 | +23.4% |
| 2000 | 169,799,170 | +15.6% |
| 2010 | 192,755,799 | +13.5% |
| 2020 | 211,487,000 | +9.7% |
| Source:[1][2] | ||


According to the 2008 PNAD (National Household Sample Survey), conducted by the IBGE, the Brazilian Statistics bureau, there were about 189,953,000 inhabitants in 2008.[3] As of the latest (2010) census, the Brazilian government estimates its population at 192.76 million.
The population of Brazil is estimated based on various sources from 1550 to 1850. The first official census took place in 1873. From that year, every 8 years (with some exceptions) the population is counted. The Instituto Brasileiro de Geografia e Estatistica has postponed the next census until 2021 due to the COVID-19 pandemic.[4]
Brazil is the sixth most populated country in the world.
- 1550 – 15,000
- 1600 – 100,000
- 1660 – 184,000
- 1700 – 300,000
- 1766 – 1,500,000
- 1800 – 3,250,000
- 1820 – 4,717,000
- 1850 – 7,256,000
- 1872 – 9,930,478
- 1890 – 14,333,915
- 1900 – 17,438,434
- 1920 – 30,635,605
- 1940 – 41,236,315
- 1950 – 51,944,397
- 1960 – 70,119,071
- 1970 – 93,139,037
- 1980 – 119,070,865
- 1991 – 146,917,459
- 1996 – 157,079,573
- 2000 – 169,544,443
- 2010 – 192,755,799[5]
- 2020 – 212,705,000[6]
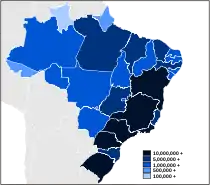
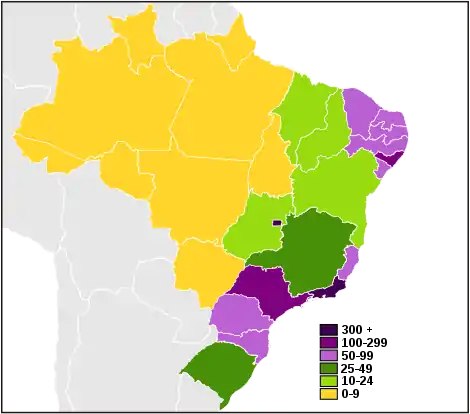
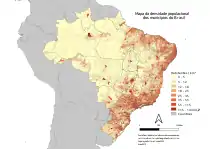
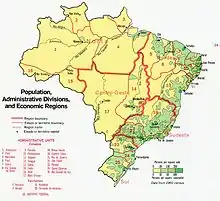
Population distribution in Brazil is very uneven. The majority of Brazilians live within 300 km (190 mi) of the coast, while the interior in the Amazon Basin is almost empty. Therefore, the densely populated areas are on the coast and the sparsely populated areas are in the interior. This historical pattern is little changed by recent movements into the interior.
UN estimates
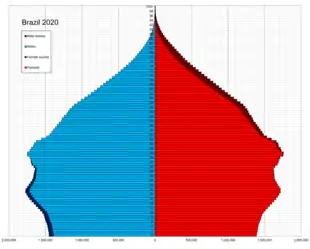
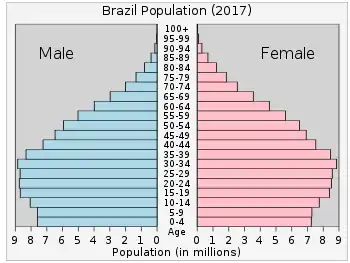
According to the 2019 revision of the World Population Prospects[7][8] the population was 209,469,323 in 2018, compared to only 53,975,000 in 1950. The proportion of children below the age of 13 in 2015 was 23.0%, 69.2% was between 15 and 61 years of age, while 7.8% was 65 years or older.[9]
| Total population (x 1000) | Population aged less than 15 (%) | Population aged 15–64 (%) | Population aged 65+ (%) | |
|---|---|---|---|---|
| 1950 | 53 975 | 41.6 | 55.5 | 3.0 |
| 1955 | 62 656 | 42.0 | 55.0 | 3.0 |
| 1960 | 72 494 | 43.1 | 53.7 | 3.1 |
| 1965 | 84 130 | 43.6 | 53.0 | 3.4 |
| 1970 | 95 982 | 42.3 | 54.2 | 3.5 |
| 1975 | 108 431 | 40.2 | 56.0 | 3.8 |
| 1980 | 122 200 | 38.4 | 57.6 | 4.0 |
| 1985 | 136 836 | 36.9 | 59.0 | 4.1 |
| 1990 | 150 393 | 35.4 | 60.1 | 4.5 |
| 1995 | 162 755 | 32.4 | 62.6 | 5.0 |
| 2000 | 175 786 | 29.7 | 64.7 | 5.6 |
| 2005 | 188 479 | 27.5 | 66.2 | 6.3 |
| 2010 | 198 614 | 24.9 | 68.4 | 6.7 |
| 2015 | 207 848 | 22.5 | 69.5 | 8.0 |
| 2020 | 213 863 | 20.7 | 69.8 | 9.5 |
Vital statistics
Total Fertility Rate from 1940 to 1990
The total fertility rate is the number of children born per woman. It is based on fairly good data for the entire period. Sources: Our World In Data and Gapminder Foundation.[10]
| Years | 1940 | 1941 | 1942 | 1943 | 1944 | 1945 | 1946 | 1947 | 1948 | 1949 | 1950[10] |
|---|---|---|---|---|---|---|---|---|---|---|---|
| Total Fertility Rate in Brazil | 5.9 | 5.92 | 5.95 | 5.98 | 6.01 | 6.04 | 6.07 | 6.09 | 6.12 | 6.15 | 6.14 |
| Years | 1951 | 1952 | 1953 | 1954 | 1955 | 1956 | 1957 | 1958 | 1959 | 1960[10] |
|---|---|---|---|---|---|---|---|---|---|---|
| Total Fertility Rate in Brazil | 6.13 | 6.1 | 6.09 | 6.08 | 6.07 | 6.07 | 6.07 | 6.08 | 6.08 | 6.07 |
| Years | 1961 | 1962 | 1963 | 1964 | 1965 | 1966 | 1967 | 1968 | 1969 | 1970[10] |
|---|---|---|---|---|---|---|---|---|---|---|
| Total Fertility Rate in Brazil | 6.05 | 6 | 5.94 | 5.85 | 5.73 | 5.6 | 5.45 | 5.3 | 5.15 | 5.01 |
| Years | 1971 | 1972 | 1973 | 1974 | 1975 | 1976 | 1977 | 1978 | 1979 | 1980[10] |
|---|---|---|---|---|---|---|---|---|---|---|
| Total Fertility Rate in Brazil | 4.88 | 4.76 | 4.65 | 4.55 | 4.46 | 4.39 | 4.31 | 4.24 | 4.16 | 4.07 |
| Years | 1981 | 1982 | 1983 | 1984 | 1985 | 1986 | 1987 | 1988 | 1989 | 1990[10] |
|---|---|---|---|---|---|---|---|---|---|---|
| Total Fertility Rate in Brazil | 3.97 | 3.86 | 3.74 | 3.62 | 3.49 | 3.36 | 3.23 | 3.11 | 3.01 | 2.91 |
| Years | 1991 | 1992 | 1993 | 1994 | 1995 | 1996 | 1997 | 1998 | 1999 | 2000[10] |
|---|---|---|---|---|---|---|---|---|---|---|
| Total Fertility Rate in Brazil | 2.83 | 2.76 | 2.69 | 2.64 | 2.59 | 2.54 | 2.48 | 2.43 | 2.37 | 2.3 |
| Years | 2001 | 2002 | 2003 | 2004 | 2005 | 2006 | 2007 | 2008 | 2009 | 2010[10] |
|---|---|---|---|---|---|---|---|---|---|---|
| Total Fertility Rate in Brazil | 2.23 | 2.16 | 2.1 | 2.03 | 1.98 | 1.93 | 1.88 | 1.85 | 1.82 | 1.8 |
| Years | 2011 | 2012 | 2013 | 2014 | 2018[10][11] |
|---|---|---|---|---|---|
| Total Fertility Rate in Brazil | 1.79 | 1.77 | 1.75 | 1.74 | 1.75 |
Registration of vital events in Brazil has considerably improved during the past decades but is still not considered complete, especially in the northern part of the country. The Population Division of the United Nations prepared the following estimates and forecasts.[9]
| Period | Live births per year |
Deaths per year |
Natural change per year |
CBR* | CDR* | NC* | TFR* | IMR* | Life expectancy total |
Life expectancy males |
Life expectancy females |
|---|---|---|---|---|---|---|---|---|---|---|---|
| 1950–1955 | 2 578 000 | 908,000 | 1 670 000 | 44.2 | 15.6 | 28.6 | 6.15 | 135 | 50.9 | 49.2 | 52.6 |
| 1955–1960 | 2 923 000 | 956,000 | 1 967 000 | 43.3 | 14.1 | 29.1 | 6.15 | 122 | 53.3 | 51.5 | 55.2 |
| 1960–1965 | 3 315 000 | 988,000 | 2 327 000 | 42.3 | 12.6 | 29.7 | 6.15 | 109 | 55.7 | 53.8 | 57.6 |
| 1965–1970 | 3 345 000 | 975,000 | 2 370 000 | 37.2 | 10.8 | 26.4 | 5.38 | 100 | 57.6 | 55.7 | 59.6 |
| 1970–1975 | 3 462 000 | 973,000 | 2 489 000 | 33.9 | 9.5 | 24.4 | 4.72 | 91 | 59.5 | 57.3 | 61.8 |
| 1975–1980 | 3 788 000 | 1 035 000 | 2 753 000 | 32.9 | 9.0 | 23.9 | 4.31 | 79 | 61.5 | 59.2 | 63.9 |
| 1980–1985 | 4 006 000 | 1 078 000 | 2 928 000 | 30.9 | 8.3 | 22.6 | 3.80 | 63 | 63.4 | 60.4 | 66.8 |
| 1985–1990 | 3 790 000 | 1 079 000 | 2 711 000 | 26.4 | 7.5 | 18.9 | 3.10 | 52 | 65.3 | 61.9 | 69.1 |
| 1990–1995 | 3 547 000 | 1 074 000 | 2 473 000 | 22.7 | 6.9 | 15.8 | 2.60 | 43 | 67.3 | 63.6 | 71.2 |
| 1995–2000 | 3 658 000 | 1 052 000 | 2 606 000 | 21.6 | 6.2 | 15.4 | 2.45 | 34 | 69.3 | 65.5 | 73.3 |
| 2000–2005 | 3 612 000 | 1 074 000 | 2 538 000 | 19.8 | 5.9 | 13.9 | 2.25 | 27 | 70.9 | 67.2 | 74.8 |
| 2005–2010 | 3 173 000 | 1 146 000 | 2 027 000 | 16.4 | 5.9 | 10.5 | 1.90 | 24 | 72.2 | 68.7 | 75.9 |
| 2010–2015 | 3 073 000 | 1 230 000 | 1 843 000 | 15.0 | 5.9 | 9.1 | 1.82 | 19 | 73.8 | 70.2 | 77.5 |
| 2015–2020 | 2 957 000 | 1 335 000 | 1 622 000 | 13.8 | 6.3 | 7.5 | 1.74 | 16 | 75.1 | 71.6 | 78.7 |
| 2020–2025 | 12.7 | 6.7 | 6.0 | ||||||||
| 2025–2030 | 11.7 | 7.1 | 4.6 | ||||||||
| 2030–2035 | 10.9 | 7.7 | 3.2 | ||||||||
| 2035–2040 | 10.3 | 8.3 | 2.0 | ||||||||
| * CBR = crude birth rate (per 1000); CDR = crude death rate (per 1000); NC = natural change (per 1000); IMR = infant mortality rate per 1000 births; TFR = total fertility rate (number of children per woman) | |||||||||||
Births and deaths
| Year | Population | Live births | Deaths | Natural increase | Crude birth rate | Crude death rate | Rate of natural increase | TFR |
|---|---|---|---|---|---|---|---|---|
| 1999 | 3,256,433 | 938,658 | 2,317,775 | |||||
| 2000 | 169,799,170 | 3,206,761 | 946,686 | 2,260,075 | 18.8 | 5.6 | 13.2 | |
| 2001 | 3,115,474 | 961,492 | 2,153,982 | |||||
| 2002 | 3,059,402 | 982,807 | 2,076,595 | |||||
| 2003 | 3,426,727 | 1,005,882 | 2,420,845 | |||||
| 2004 | 3,329,120 | 1,025,981 | 2,303,139 | |||||
| 2005 | 3,329,431 | 1,010,052 | 2,319,379 | |||||
| 2006 | 3,172,000 | 1,037,504 | 2,134,496 | |||||
| 2007 | 3,080,266 | 1,050,408 | 2,029,858 | |||||
| 2008 | 3,107,927 | 1,074,889 | 2,033,038 | |||||
| 2009 | 3,045,696 | 1,098,384 | 1,947,312 | 1.906 | ||||
| 2010 | 192,755,799 | 2,985,406 | 1,132,701 | 1,852,705 | 14.3 | 5.8 | 8.5 | 1.869 |
| 2011 | 3,044,594 | 1,163,740 | 1,880,854 | 1.833 | ||||
| 2012 | 3,030,364 | 1,172,443 | 1,857,921 | 1.801 | ||||
| 2013 | 2,989,981 | 1,195,913 | 1,794,068 | 1.770 | ||||
| 2014 | 3,041,568 | 1,208,587 | 1,832,981 | 1.742 | ||||
| 2015 | 3,058,783 | 1,244,558 | 1,814,225 | 14.4 | 6.0 | 8.4 | 1.716 | |
| 2016 | 206,081,432 | 2,903,933 | 1,288,856 | 1,615,077 | 13.5 | 6.2 | 7.3 | 1.692 |
| 2017 | 207,660,929 | 2,962,815 | 1,292,297 | 1,670,518 | 14.3 | 6.2 | 8.1 | |
| 2018 | 208,494,900 | 2,983,567 | 1,298,579 | 1,684,988 | 14.3 | 6.2 | 8.1 | |
| 2019 | 210,200,000 | 2,888,218 | 1,331,983 | 1,556,235 | 13.7 | 6.3 | 7.4 | |
Regional and racial differences
In some states in the North and Northeast, the fertility rate was higher than the national average in 2015. The highest rate was in Acre, with 2.35 children per woman. Other regions with high fertility include Amapá, with 2.28 children per woman, Amazonas, 2.25 in Roraima, 2.22, in Maranhão, 2.17, and Pará, 2.13.
On the other hand, São Paulo is the state with the lowest rate, 1.38 children per woman. Other states with low fertility include Santa Catarina, with 1.45, Rio Grande do Sul, 1.50, in Rio de Janeiro, 1.55 in Paraná and Minas Gerais, 1.59.
Regarding race of mothers, between 2001 and 2015, the fertility rate of all racial groups fell below replacement rate. Black fertility fell from 2.75 to 1.88, Pardo/Mixed fertility fell from 2.65 to 1.96 and white fertility fell from 2.10 to 1.69. There was no information regarding Asian fertility rates. Indigenous fertility was calculated at 3.87 children per women in 2010.[14]
Childlessness and education
The color or race of the woman and the level of education has also shown to influence the fact of not having children. In 2013, among European women aged 15 to 49 years, 41.5% had no children, while among African women, the percentage was 35.8%.
The proportional difference is even greater among European women compared to African 25–29 years. While the proportion among European women childless was 48.1% among African women was 33.8%.
Regarding education, among women 15–49 years of age with more than eight years of schooling, 44.2% had no children in 2013, while among those with up to seven years of study this figure was 21.6%.
Schooling among women 25–29 years has shown an even greater disparity. Among the less educated, 16.3% had no children, while among the more educated 54.5% had no children. The proportion of women aged 45 to 49 without children was 8.2% in 2013 among those with less education and 15.1% among those with more years of schooling.
Total fertility rate
| Brazil 100% | European 47.73% | African 7.61% | Asian 1.09% | Pardo (Multiracial) 43.13% | Native Indians 0.43% | |
|---|---|---|---|---|---|---|
| Population 0–14 | 45,932,294 | 20,460,482 | 2,698,639 | 420,952 | 22,055,573 | 295,862 |
| Percent group 0–14 in race | 24.08% | 22.47% | 18.59% | 20.02% | 26.81% | 36.17% |
| Population 0–14 compared to racial groups | 100% | 44.54% | 5.88% | 0.92% | 48.02% | 0.64% |
| Population 15–49 | 105,816,285 | 49,381,206 | 8,693,350 | 1,178,391 | 46,156,227 | 402,079 |
| Proportions 0–14 to 15–49 | 0,43407 | 0,41434 | 0,31043 | 0,35723 | 0,47785 | 0,73583 |
| Age group | Brazil 100% (percent of the population) | European 47.73% (percent in the race/percent in the age group) | Africans 7.61% (percent in the race/percent in the age group) | Asian 1.09% (percent in the race/percent in the age group) | Pardo (Multiracial) 43.13% (percent in the race/percent in the age group) | Native Indians 0.43% (percent in the race/percent in the age group) | Unspecified 0.0034% |
|---|---|---|---|---|---|---|---|
| Population | 190,755,799 | 91,051,646 | 14,517,961 | 2,084,288 | 82,277,333 | 817,963 | 6,608 |
| 0–4 | 13,796,158 (7.23%) | 6,701,186 (7.36%/48.57%) | 655,958 (4.52%/4.75%) | 119,956 (5.76%/0.87%) | 6,217,638 (7.56%/45.07%) | 101,195 (12.37%/0.73%) | 225 |
| 5–9 | 14,969,375 (7.85%) | 6,562,558 (7.21%/43.84%) | 887,209 (6.11%/5.93%) | 139,543 (6.69%/0.93%) | 7,279,983 (8.85%/48.63%) | 99,841 (12.21%/0.67%) | 241 |
| 10–14 | 17,166,761 (9.00%) | 7,196,738 (7.90%/41.92%) | 1,155,472 (7.96%/6.73%) | 161,453 (7.75%/0.94%) | 8,557,952 (10.40%/49.85%) | 94,826 (11.59%/0.55%) | 320 |
| 15–19 | 16,990,872 (8.91%) | 7,311,734 (8.03%/43.03%) | 1,264,183 (8.71%/7.44%) | 177,008 (8.49%/1.04%) | 8,155,126 (9.91%/48.00%) | 82,500 (10.86%/0.49%) | 321 |
| 20–24 | 17,245,192 (9.04%) | 7,774,488 (8.54%/45.08%) | 1,381,677 (9.52%/8.01%) | 200,060 (9.60%/1.16%) | 7,814,487 (9.50%/45.31%) | 73,387 (8.97%/0.43%) | 1 093 |
| 25–29 | 17,104,414 (8.97%) | 7,936,115 (8.72%/46.40%) | 1,443,820 (9.95%/8.44%) | 202,733 (9.73%/1.19%) | 7,455,402 (9.06%/43.59%) | 65,104 (7.96%/0.38%) | 1 240 |
| 30–34 | 15,744,512 (8.25%) | 7,344,600 (8.07%/46.65%) | 1,360,298 (9.37%/8.64%) | 182,150 (8.74%/1.16%) | 6,800,175 (8.26%/43.19%) | 56,326 (6.89%/0.36%) | 963 |
| 35–39 | 13,888,579 (7.28%) | 6,596,137 (7.24%/47.49%) | 1,175,333 (8.10%/8.46%) | 152,546 (7.32%/1,10) | 5,915,773 (7.18%/42.59%) | 48,167 (5.89%/0.35%) | 623 |
| 40–44 | 13,009,364 (6.82%) | 6,365,363 (6.99%/48.93%) | 1,095,301 (7.54%/8.42%) | 139,230 (6.68%/1.07%) | 5,368,059 (6.52%/41.26%) | 40,950 (5.01%/0.31%) | 461 |
| 45–49 | 11,833,352 (6.20%) | 6,052,769 (6.65%/51.15%) | 972,738 (6.70%/8.22%) | 124,664 (5.98%/1.05%) | 4,647,205 (5.65%/39.27%) | 35,645 (4.36%/0.30%) | 331 |
| 50–54 | 10,140,402 (5.32%) | 5,286,559 (5.81%/52.13%) | 848,098 (5.84%/8.36%) | 106,539 (5.11%/1.05%) | 3,869,792 (4.70%/38.16%) | 29,156 (3.56%/0.29%) | 258 |
| 55–59 | 8,276,221 (4.34%) | 4,404,057 (4.84%/53.21%) | 675,404 (4.65%/8.16%) | 95,149 (4.57%/1.15%) | 3,076,630 (3.74%/37.17%) | 24,800 (3.03%/0.30%) | 181 |
| 60–69 | 11,349,930 (5.95%) | 6,158,001 (6.76%/54.26%) | 906,487 (6.24%/7.99%) | 152,099 (7.30%/1.34%) | 4,097,068 (4.98%/36.10%) | 36,062 (4.41%/0.32%) | 213 |
| 70+ | 9,240,667 (4.84%) | 5,361,341 (5.89%/58.02%) | 695,983 (4.79%/7.53%) | 131,158 (6.29%/1.42%) | 3,022,043 (3.67%/32.70%) | 30,004 (3.67%/0.32%) | 138 |
Demographic statistics
Demographic statistics according to the World Population Review.[17]
- One birth every 11 seconds
- One death every 24 seconds
- One net migrant every 90 minutes
- Net gain of one person every 20 seconds
Demographic statistics according to the CIA World Factbook, unless otherwise indicated.[11]
- Age structure
- 0-14 years: 21.89% (male 23,310,437 /female 22,414,551)
- 15-24 years: 16.29% (male 17,254,084 /female 16,758,140)
- 25-54 years: 43.86% (male 45,449,158 /female 46,151,759)
- 55-64 years: 9.35% (male 9,229,665 /female 10,296,824)
- 65 years and over: 8.61% (male 7,666,845 /female 10,315,429) (2018 est.)
- Median age
- total: 32.4 years. Country comparison to the world: 100th
- male: 31.5 years
- female: 33.3 years (2018 est.)
- Total fertility rate
- 1.75 children born/woman (2018 est.)Country comparison to the world: 159
- Population
- 208,846,892 (July 2018 est.)
- Population growth rate
- 0.71% (2018 est.) Country comparison to the world: 140th
Birth rate: 13.9 births/1,000 population (2018 est.) Country comparison to the world: 135th
- Death rate
- 6.7 deaths/1,000 population (2018 est.)
- Net migration rate
- -0.1 migrant(s)/1,000 population (2017 est.)
- Life expectancy at birth
- total population: 74.3 years (2018 est.) Country comparison to the world: 125
- male: 70.7 years (2018 est.)
- female: 78 years (2018 est.)
- Languages
- Portuguese (official and most widely spoken language)
- note: less common languages include Spanish (border areas and schools), German, Italian, Japanese, English, and a large number of minor Amerindian languages
- Religions
- Roman Catholic 64.6%, other Catholic 0.4%, Protestant 22.2% (includes Adventist 6.5%, Assembly of God 2.0%, Christian Congregation of Brazil 1.2%, Universal Kingdom of God 1.0%, other Protestant 11.5%), other Christian 0.7%, Spiritist 2.2%, other 1.4%, none 8%, unspecified 0.4% (2010 est.)
- Dependency ratios
- total dependency ratio: 43.8 (2015 est.)
- youth dependency ratio: 32.4 (2015 est.)
- elderly dependency ratio: 11.4 (2015 est.)
- potential support ratio: 8.7 (2015 est.)
Largest urban agglomerations
Cities in Brazil, except for the state of São Paulo, are usually not arranged in a single network, but rather on various export paths to seaside ports. The most important cities are on the coast or close to it. State capitals are also each the largest city in its state, except for Vitória, the capital of Espírito Santo, and Florianópolis, the capital of Santa Catarina. There are also non-capital metropolitan areas in São Paulo state (Campinas, Santos, Paraíba Valley, Sorocaba, Ribeirão Preto and Franca), Minas Gerais (Steel Valley), Rio Grande do Sul (Sinos Valley), and Santa Catarina (Itajaí Valley).
São Paulo and Rio de Janeiro are far larger than any other Brazilian cities. São Paulo's influence in most economic aspects can be noted in a national (and even international) scale; other Brazilian metropolises are second tier, even though Rio de Janeiro (partially due to its former status as the national capital) still host various large corporations' headquarters, besides being Brazil's cultural center with respect to soap operas and film production. Brasília, the capital of Brazil, is the 3rd biggest city.
Urban agglomerations
Municipalities
Migrations
Immigration
| Immigration to Brazil, by national origin, periods from 1830 to 1933 Source: Brazilian Institute for Geography and Statistics (IBGE) | ||||||||||
|
Period | ||||||||||
| origin | 1830–1855 | 1856–1883 | 1884–1893 | 1894–1903 | 1904–1913 | 1914–1923 | 1924–1933 | 1934–2018 | ||
| Portuguese | 16,737 | 116,000 | 170,621 | 155,542 | 384,672 | 201,252 | 233,650 | 400,000 | ||
| Italians | — | 100,000 | 510,533 | 537,784 | 196,521 | 86,320 | 70,177 | |||
| Spaniards | — | — | 113,116 | 102,142 | 224,672 | 94,779 | 52,400 | |||
| Germans | 2,008 | 30,000 | 22,778 | 6,698 | 33,859 | 29,339 | 61,723 | |||
| Japanese | — | — | — | — | 11,868 | 20,398 | 110,191 | |||
| Syrians and Lebanese | — | — | 96 | 7,124 | 45,803 | 20,400 | 20,400 | |||
| Others | — | — | 66,524 | 42,820 | 109,222 | 51,493 | 164,586 | |||
Immigration has been a very important demographic factor in the formation, structure and history of the population in Brazil, influencing culture, economy, education, racial issues, etc. Brazil has received the third largest number of immigrants in the Western Hemisphere, after the United States and Argentina.
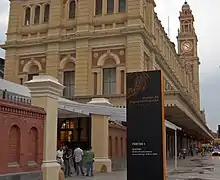
Brazil's structure, legislation and settlement policies for arriving immigrants were much less organized than in Canada and the United States at the time. Nevertheless, an Immigrant's Hostel (Hospedaria dos Imigrantes) was built in 1886 in São Paulo, and quick admittance and recording routines for the throngs of immigrants arriving by ship at the seaports of Vitória, Rio de Janeiro, Santos, Paranaguá, Florianópolis and Porto Alegre were established. The São Paulo State alone processed more than 2.5 million immigrants in its almost 100 years of continuous operation. People of more than 70 different nationalities were recorded.
Following the trend of several other countries in the Americas, which encouraged immigration from many countries, Brazil quickly became a melting pot of races and nationalities, but being peculiar in the sense of having the highest degree of intermarriage in the world. Immigrants found a strong social and cultural tolerance toward inter-racial marriage, including large numbers of Mulattoes (European and African), Caboclos (Indian and European) and mixed European, African and Indian people, though it was not accompanied by an entire lack of racism. Correspondingly, the same mentality reflected in low psychological and social barriers regarding intermarriage between Europeans, Middle Easterners and Asians of several origins, as well as between people of different religions.
History of immigration
It is that the Americas were settled by three migratory waves from Northern Asia. The Native Brazilians are thought to descend from the first wave of migrants, who arrived in the region around 9000 BC. The main Native Brazilian groups are the Tupi-Guarani, the Jê, the Arawaks and the Caraibas (Kalina or Caribs). The Tupi-Guarani nation, originally from the Paraná river basin and also one of the largest of the Native-Paraguayan nations, had spread all along the Brazilian coastline from South to North and came to be known by the Portuguese as "Os Índios da Língua Geral" ("The Indians of the General Language"); the Jê nation occupied most of the interior of the country from Maranhão to Santa Catarina. The Arawaks and the Caribs, the last ones to get in contact with the Portuguese, lived in the North and Northwest of Brazil.
The European immigration to Brazil started in the 16th century, with the vast majority of them coming from Portugal. In the first two centuries of colonization, 100,000 Portuguese arrived in Brazil (around 500 colonists per year). In the 18th century, 600,000 Portuguese arrived (6,000 per year).[22] The first region to be settled by the Portuguese was Northeastern Brazil, followed by the Southeast region. The original Amerindian population of Brazil (between two and five million) largely died from disease or violence or was assimilated into the Portuguese population.[23] The Mamelucos (or Caboclos, a mixed race between Europeans and Amerindians) have always been present in many parts of Brazil.
Another important ethnic group, Africans, first arrived as slaves. Many came from Guinea-Bissau, or from West African countries – by the end of the eighteenth century many had been taken from the Kingdom of Kongo and modern-day Angola, Congo, Mozambique, Benin and Nigeria. By the time of the end of the slave trade in 1850, around six million slaves had been brought to Brazil–50% of all slave traffic between Africa and the Americas. Nowadays, there are still small immigration waves coming from the African continent. The largest influx of European immigrants to Brazil occurred in the late 19th and early 20th centuries. According to the Memorial do Imigrante statistics data, Brazil attracted nearly 5 million immigrants between 1870 and 1953.[24][25] These immigrants were divided in two groups: a part of them was sent to Southern Brazil to work as small farmers. However, the biggest part of the immigrants was sent to Southeast Brazil to work in the coffee plantations. The immigrants sent to Southern Brazil were mainly Germans (starting in 1824, mainly from Rhineland-Palatinate, Pomerania, Hamburg, Westphalia, etc.) Italians (starting in 1875, mainly from the Veneto and Lombardia), Austrians, Poles, Ukrainians, Dutch and Russians. In the South, the immigrants established rural communities that, still today, have a strong cultural connection with their ancestral homelands. In Southeast Brazil, most of the immigrants were Italians (mainly from the Veneto, Campania, Calabria and Lombardia), Portuguese (mainly from Beira Alta, Minho and Alto Trás-os-Montes), Dutch, Spaniards (mainly from Galicia and Andalusia), Lithuanians, French, Hungarians and Ashkenazi Jews.
Notably, the first half of the 20th century saw a large inflow of Japanese (mainly from Honshū, Hokkaidō and Okinawa) and Arab Christians from Lebanon and Syria. These Christian Levantine immigrants were wrongly called "Turks" by many Brazilians because their original countries were still under Ottoman rule back in the period when their immigration to Brazil began. The number of actual Turks who immigrated to Brazil was in fact very small. Chinese, Taiwanese and Koreans influx became common after the 1950s.
IBGE's 1998 PME
In 1998, the IBGE, within its preparation for the 2000 census, experimentally introduced a question about "origem" (ancestry) in its "Pesquisa Mensal de Emprego" (Monthly Employment Research), in order to test the viability of introducing that variable in the Census.[26] This research interviewed about 90,000 people in six metropolitan regions (São Paulo, Rio de Janeiro, Porto Alegre, Belo Horizonte, Salvador, and Recife).[26]
Here are its results for both the European population and the population in general:[26]
| Brazilian Population, by origin,
as understood by those surveyed 1998[26] | ||
|---|---|---|
| Origin | % of Europeans | % of all races |
| Brazilian | 83.11% | 86.09% |
| Portuguese | 15.72% | 10.46% |
| Italian | 14.50% | 10.01% |
| Spanish | 6.42% | 4.40% |
| German | 5.51% | 3.54% |
| Indigenous | 4.80% | 6.64% |
| African | 1.30% | 5.09% |
| Arab | 0.72% | 0.48% |
| Japanese | 0.62% | 1.34% |
| African | 0.58% | 2.06% |
| Jewish | 0.25% | 0.20% |
| Others | 4.05% | 2.81% |
| Total | 137.58% | 133.52% |
Notice that the total is higher than 100% because of multiple claims of ascendants from different nations in the answers.
Emigration
In the second half of the 1980s, Brazilians from various socioeconomic levels started to emigrate to other countries in search of economic opportunities.
In the 1990s, nearly 1.9 million Brazilians were living outside the country, mainly in the United States, Paraguay and Japan,[27] but also in Italy, Portugal, the United Kingdom, France, Canada, Australia, Switzerland, Germany, Belgium, Spain and Israel. However, there were no specific policies implemented by the government to encourage or discourage this emigration process.[28]
The 2000 Brazilian Census provides some information about the high number of migrants returning to Brazil. Of those who reported residing in another country less than 10 years before the 2000 census, 66.9 percent were Brazilians. If only the returning migrants (former Brazilian immigrants) are considered, 26.8 percent of Brazilians came from Paraguay, 17 percent came from Japan, and 15.8 percent came from the United States.[28]
Racial composition
The bulk of the Brazilian population descends from three main source populations (either alone, or more commonly, in varying combinations mixed in varying degrees); early European settlers (chiefly ethnic Portuguese, but also Portuguese New Christians of ethnic Sephardic Jewish origin forced to convert to Christianity),[29] sub-Saharan Africans (Yoruba, Ewe, Akan, Bantu, and others), and the indigenous peoples in Brazil (mostly Tupi and Guarani, but also many other indigenous Brazilian ethnic groups).
Starting in the late 19th century, Brazil received substantial post-colonial immigration from several other regions, mainly from peoples of what are now the countries of Italy, Germany, Spain, Poland, as well as Arab Christians from the Levant (mostly from what is now Lebanon, and less so from what is today Syria), Ukraine, Japan, the People's Republic of China and Korea.
Jews in Brazil are a small but sizable population,[30][31] and they include mostly Ashkenazi Jews (who also arrived with the post-colonial contingent of European migration),[32] a smaller proportion of Sephardi Jews (mostly Eastern Sephardim arrived with the contingent of post-colonial immigrants from Syria and Lebanon, but also North African Sephardim from Morocco settled in the Amazon, and Western Sephardim arrived with the Dutch), and to a much lesser extent Mizrahi Jews. Overall, the small but sizable Brazilian Jewish community is concentrated especially in São Paulo,[33] Rio de Janeiro[34] and Porto Alegre,[35] and they are accounted for without Brazilian descendants of Portuguese "New Christians" (ethnic Sephardic Jews forced to convert to Christianity and arrived with the ethnic Portuguese during the colonial period),[32] which if included would inflate the Jewish origin population in Brazil considerably. By themselves, Brazilian descendants of Portuguese "New Christians" are estimated to account for a figure anywhere between hundreds of thousands to several million.
The descendants of European immigrants, particularly the Germans, Italians, Austrians, Swiss, Poles, Ukrainians, French, Dutch, Lithuanians, Scandinavians, Russians, Hungarians, Finns and Luxembourgers are mainly concentrated in the southern part of the country, in the states of Rio Grande do Sul, Santa Catarina, Paraná, and the most populous, São Paulo; these states have a wide majority of citizens of European descent.[36][37] São Paulo alone has the largest population in absolute numbers with 30 million Europeans.[38] In the rest of the country, part of the European-Brazilian population is of colonial Portuguese, Dutch, Spanish and French settler stock, especially in the Northeast. In the mid-southern states of Rio de Janeiro, Espírito Santo, Minas Gerais, Goiás, Mato Grosso do Sul and in the Federal District, the number of Europeans (European and Levantine phenotype) revolves around 50% of the population, being somewhat equal to the absolute number of Afro-Brazilians, East Asians and mixed race Brazilians, i.e., Caboclos or Mestizo/Castizo, Mulattoes, Eurasians and Gypsies altogether.[39]
In the Northeast, which received large masses of African slaves to work in sugarcane, tobacco and cotton plantations, people of African and mixed-race descent predominate, mostly on the coast, whereas in the semi-arid country land (usually called sertão) there is a predominance of Europeans and Amerindian-European mixed people. Most of the African or mulatto people in the sertão are descended from freed African slaves or mulattos who fled inland from the coast and worked as cowboys for semi-feudal lords. The city of Salvador da Bahia is considered one of the largest African cities of the world. In the Northwest (covering largely the Brazilian Amazon), a great part of the population has distinguishable ethnic characteristics that emphasize their Amerindian roots. Other ethnic groups have merged with the Indigenous tribes there. This region is not densely populated, and "caboclos", people of mixed native and European descent, are a small part of the entire Brazilian population.
The Japanese are the largest Asian group in Brazil. In fact, Brazil has the largest population of Japanese ancestry outside Japan, with 1.8 million Japanese Brazilians, most of them living in São Paulo. Some Chinese and Korean also settled Brazil. Most Chinese came from mainland China, but others came from Taiwan and Hong Kong, and also from Portuguese-speaking Macau—these Chinese from Macau could speak and understand Portuguese, and it was not hard for them to adjust to Brazilian life. Those immigrant populations and their descendants still retain some of their original ethnic identity, however they are not closed communities and are rapidly integrating into mainstream Brazilian society: for instance, very few of the third generation can understand their grandparents' languages.
European-Brazilians
According to the 2010 census, there were more than 91 million European-Brazilians, comprising 47.73% of Brazil's population.[40] European-Brazilians are defined as people who are solely or mostly descended from European immigrants, although most Brazilians have some degree of European ancestry. Europeans are found in the entire territory of Brazil, although they are most concentrated in the south and southeastern parts of the country. [41][42] A survey conducted in 1998 by the Minas Gerais sociologist Simon Schwartzman interviewed about 34 million Brazilians, of whom nearly 20 million declared themselves white. Asked the ethnic origin of the participants of white race, a plurality pointed only Brazilian origin (45.53%). More than half, however, managed to point to a foreign origin: 15.72% indicated Italian ancestry, 14.50% Portuguese, 6.42% Spanish, 5.51% German and 12.32% other origins, which include Polish, Ukrainian, Russian, Lithuanian, Dutch, Austrian, Swiss, French, Hungarian, Norwegian, partial distant African, indigenous, British, American Confederate, Jewish (mostly Ashkenazi, but also Sephardi including Jews from Morocco and Egypt) and Christian Levantine Arab (Lebanese).[43][44]

Nearly one million Europeans had arrived in Brazil by 1800; most of them colonists from Portugal. An immigration boom occurred in the 19th and 20th centuries, when nearly six million Europeans emigrated to Brazil, most of them Portuguese, Germans Italians and Spaniards.
Many European-Brazilians have some Amerindian and/or African ancestry (similarly found in European-Americans[45] and European-Argentines).[46] It is estimated that 75% of all Brazilians have varying degrees of Portuguese ancestry.
Nowadays, European-Brazilians come from a very diverse background, which includes:
- The Dutch were among the Europeans settling in Brazil during the 17th century. From 1630 to 1654, the Dutch controlled the northeast coast of Brazil, establishing their colonial capital in Recife. During the 19th and 20th century, immigrants from the Netherlands populated the central and southern states of Brazil.[47][48]
The first Dutch immigrants to South America after its independence waves from their metropoles went to the Brazilian state of Espírito Santo between 1858 and 1862, where they founded the settlement of Holanda, a colony of 500 mainly Reformed folk from West Zeeuws-Vlaanderen in the Dutch province of Zeeland.[49] Dutch and other Low Franconian languages are still spoken in São Paulo (state), especially Holambra (named after Holland-America-Brazil), famous for its tulips and the annual Expoflora event, Santa Catarina, Rio Grande do Sul and around Ponta Grossa, Castrolanda and Carambeí known as little Holland, in the plains of Paraná, headquarters of several food companies and a dairy farming region.[50][51]
- The first Germans and Austrians arrived in Brazil in 1824. Most of them established themselves in rural communities across Southern Brazil, such as São Leopoldo, Novo Hamburgo, Blumenau and Pomerode. In Santa Catarina state, Southern Brazil, Germans and Austrians represented over 45% of all immigrants arriving, and in the entire country, citizens who descend from German-speaking nationalities, including Swiss and Luxemburger, but also Volga German, may represent as much as 8% of the absolute population, since Brazil is home to the second largest German-Austrian population outside their respective nations, after the USA. And German is the second most spoken mother tongue in the country.[52][53][54] According to Ethnologue, Standard German is spoken by 1.5 million people and Brazilian German encompass assorted dialects, including Riograndenser Hunsrückisch spoken by over 3 million Brazilians.[50][55][56]
- Italians started arriving in Brazil in 1875, making up the main group of immigrants in the late 19th century.[57] First they settled in rural communities across Southern Brazil. In the early 20th century, they mostly settled in the coffee plantations in the Southeast, later moving to São Paulo capital to work in factories or starting their own businesses in trade, services and industry like businessman and industrialist count Francesco Matarazzo. In São Paulo, which came to be labeled an "Italian city" in the early twentieth century, Italians engaged mainly in the incipient industry and urban services activities. They came to represent 90% of the 60,000 workers employed in São Paulo factories in 1901.[58]
Today 15% of Brazilians or 31 million citizens are of Italian extraction, the largest number outside of Italy itself, most of them descended from Northern Italians, reason why Talian, or the Venetian dialect, is the third most spoken mother tongue in the nation.[59][60]
- Poles came in significant numbers to Brazil after 1870. Most of them settled in the State of Paraná, working as small farmers.
- Portuguese Most Brazilians are fully or partly of Portuguese ancestry. Portuguese settlers began arriving in 1500. Immigration increased during the 18th century and reached its peak in the late 19th and early 20th centuries. Lusitanian immigration never ceased throughout the 19th and 20th centuries. Portuguese people in diaspora settled in Brazil especially during the 1970s coming from former Portuguese colonies like Macau or Angola after its independence. The Portuguese were always the largest ethnic group of immigrants to Brazil. In the early years of Portuguese colonization it is estimated that between 1500 - 1800 some 600,000 Portuguese immigrated to Brazil, and then between 1800 - 1980 another 600,000, then from 1980 to the present, 600,000 more. Portuguese immigration to Brazil will always be a constant, hence, will always comprise the largest percentage of European immigrants. By 2030, there will be an estimated 1,000,000 Portuguese total immigrants in Brazil as of 1980, significantly dwarfing all of the other immigrant groups.
An additional figure of 1.2 million Portuguese arrived between 1951 and 1975 to settle mostly in the Southeast.[61] Nowadays, Lusitanians constitute the biggest group of foreigners living in the country, with over 690,000 Portuguese nationals currently living in Brazil.[62] The vast majority arrived in the last decade. The first semester of 2011 solely had an increase of 52 thousand Portuguese nationals applying for a permanent residence visa while another large group was granted Brazilian citizenship.[63][64]
- Spaniards came in large numbers to Brazil, starting in the late 19th century. Most of them were attracted to work in the coffee plantations in the state of São Paulo. Today there are an estimated 15 million Brazilians of direct Spanish descent.[65]
- Ukrainians came mostly in the late 19th century. Currently they number approximately 980,000, most of whom live in a compact settlement in south central Paraná[66]
Mixed-race/Pardo-Brazilians
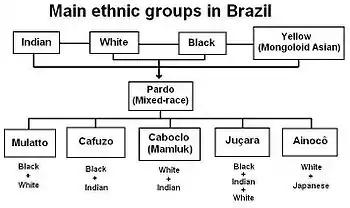
The Pardos can be a mixture of Europeans, Levantine Arabs, Crypto-Jews or Anusim, Africans, Amerindians, Gypsies and Asians. Brazil does not have a category for multiracial people, but a Pardo (brown) one, which may include caboclos, mulatos, cafuzos (local ethnonyms for people of noticeable mixed European and Amerindian, African and European, and Amerindian and African descent, i.e., mestizos, mulattoes and zambos, respectively), the multiracial result of their intermixing (despite most of European and African Brazilians possessing some degree of race-mixing, since brownness in Brazil is a matter of phenotype) and assimilated, westernized indigenous people.[67][68]
The Pardos make up 43.13% or 82.3 million people of Brazil's population. Multiracial Brazilians live in the entire territory of Brazil. Although, according to DNA resources, most Brazilians possess some degree of mixed-race ancestry, less than 45% of the country's population classified themselves as being part of this group due to phenotype.[69]
The caboclo or mestiço population, those whose ancestry is Native and European, revolves around 43 million people or 21% of the population. Genetic studies conducted by the geneticist Sergio D.J. Pena of the Federal University of Minas Gerais have shown that the caboclo population is made of individuals whose DNA ranges from 70% to 90% European (mostly Portuguese, Spanish, Dutch, French or Italian 1500s to 1700s male settlers) with the remaining percentage spanning different Indigenous markers. Similar DNA tests showed that people self-classified as mulatto or European and African mix, span from 62% to 83% European (mostly descendants of Portuguese, Dutch and French settlers during the colonial period in the Northeast). The pardo category in Brazil also includes 800 thousand gypsies or Roma people, most of them coming from Portugal but also different countries in Eastern Europe and the Baltics. Eurasians can also be classified as pardo. The majority of them consisting of Ainoko or Hafu, individuals of Japanese and European ancestry.
Recent research has suggested that Asians from the early Portuguese Eastern Empire, known as Luso-Asians first came to Brazil during the sixteenth century as seamen known as Lascars, or as servants, slaves and concubines accompanying the governors, merchants and clergy who has served in Portuguese Asia.[70] This first presence of Asians was limited to Northeast Brazil, especially Bahia, but others were brought as cultivators, textile workers and miners to Pará and other parts of the Northeast.
African-Brazilians
African-Brazilians are defined as people who are solely, or mostly, descended from former African slaves, or immigrants. According to the 2010 census, there are 14,517,961 Black Brazilians, about 7.6% of the population.[71] Although the majority of Brazilians have at least some degree of African heritage, the racial makeup of black brazilians themselves is very mixed and mostly of them have a significant degree of white admixture with a minor indigenous component, the range of white admixture is typically between 30% to 70%.[69] "Pure" black brazilians with more than 80% of their genes coming from african ancestry are a subgroup minority.
Asian-Brazilians

According to the 2006 census, people of East Asian descent number 1,919,000, or 1.1% of Brazil's population. Estimates say that there are 2.5 to 3.0 million people of Japanese descent in Brazil, who are mostly concentrated in two states: São Paulo and Paraná, but smaller communities are found in the entire territory of the country. Brazil has the largest population of Japanese descent outside Japan.[72]
There are also smaller communities of Korean people and Chinese origin.[73]
Aboriginal-Brazilians
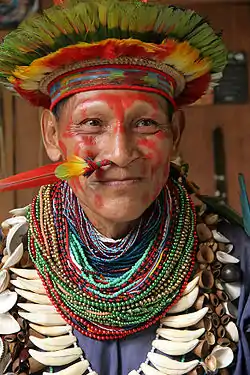
The Amerindians make up 0.4% of Brazil's population, or about 700,000 people. Indigenous peoples are found in the entire territory of Brazil, although the majority of them live in Indian reservations in the North and Centre-Western part of the country.
Over 60 million Brazilians possess at least one Native South American ancestor, according to a mitochondrial DNA study.[74] However, only 0.4% of the population consider themselves to be Natives. Brazilians tend to consider "Native South American" a cultural, not racial category.
When the first Portuguese arrived in Brazil, in 1500, there were between 2.5 and 3.2 million Natives living in the country. In the mid-19th century they were only 100,000 and in the late 20th century close to 300,000.
Genetic studies
Genetic studies have shown the Brazilian population as a whole to have European, African and Native American components.
Autosomal studies
A 2015 autosomal genetic study, which also analysed data of 25 studies of 38 different Brazilian populations concluded that: European ancestry accounts for 62% of the heritage of the population, followed by the African (21%) and the Native American (17%). The European contribution is highest in Southern Brazil (77%), the African highest in Northeast Brazil (27%) and the Native American is the highest in Northern Brazil (32%).[75]
| Region[75] | European | African | Native American |
|---|---|---|---|
| North Region | 51% | 16% | 32% |
| Northeast Region | 58% | 27% | 15% |
| Central-West Region | 64% | 24% | 12% |
| Southeast Region | 67% | 23% | 10% |
| South Region | 77% | 12% | 11% |
An autosomal study from 2013, with nearly 1300 samples from all of the Brazilian regions, found a pred. degree of European ancestry combined with African and Native American contributions, in varying degrees. 'Following an increasing North to South gradient, European ancestry was the most prevalent in all urban populations (with values up to 74%). The populations in the North consisted of a significant proportion of Native American ancestry that was about two times higher than the African contribution. Conversely, in the Northeast, Center-West and Southeast, African ancestry was the second most prevalent. At an intrapopulation level, all urban populations were highly admixed, and most of the variation in ancestry proportions was observed between individuals within each population rather than among population'.[76]
| Region[76] | European | African | Native American |
|---|---|---|---|
| North Region | 51% | 17% | 32% |
| Northeast Region | 56% | 28% | 16% |
| Central-West Region | 58% | 26% | 16% |
| Southeast Region | 61% | 27% | 12% |
| South Region | 74% | 15% | 11% |
An autosomal DNA study (2011), with nearly 1000 samples from all over the country ("Europeans", "Pardos" and "Africans", according to their respective proportions), found out a major European contribution, followed by a high African contribution and an important Native American component.[69] "In all regions studied, the European ancestry was predominant, with proportions ranging from 60.6% in the Northeast to 77.7% in the South".[69] The 2011 autosomal study samples came from blood donors (the lowest classes constitute the great majority of blood donors in Brazil[77]), and also public health institutions personnel and health students. The study showed that Brazilians from different regions are more homogenous than previously thought by some based on the census alone. "Brazilian homogeneity is, therefore, a lot greater between Brazilian regions than within Brazilian regions".[78]
| Region[69] | European | African | Native American |
|---|---|---|---|
| Northern Brazil | 68.80% | 10.50% | 18.50% |
| Northeast of Brazil | 60.10% | 29.30% | 8.90% |
| Southeast Brazil | 74.20% | 17.30% | 7.30% |
| Southern Brazil | 79.50% | 10.30% | 9.40% |
According to a DNA study from 2010, "a new portrayal of each ethnicity contribution to the DNA of Brazilians, obtained with samples from the five regions of the country, has indicated that, on average, European ancestors are responsible for nearly 80% of the genetic heritage of the population. The variation between the regions is small, with the possible exception of the South, where the European contribution reaches nearly 90%. The results, published by the scientific magazine American Journal of Human Biology by a team of the Catholic University of Brasília, show that, in Brazil, physical indicators such as skin colour, colour of the eyes and colour of the hair have little to do with the genetic ancestry of each person, which has been shown in previous studies (regardless of census classification).[79] "Ancestry informative SNPs can be useful to estimate individual and population biogeographical ancestry. Brazilian population is characterized by a genetic background of three parental populations (European, African, and Brazilian Native Amerindians) with a wide degree and diverse patterns of admixture. In this work we analyzed the information content of 28 ancestry-informative SNPs into multiplexed panels using three parental population sources (African, Amerindian, and European) to infer the genetic admixture in an urban sample of the five Brazilian geopolitical regions. The SNPs assigned apart the parental populations from each other and thus can be applied for ancestry estimation in a three hybrid admixed population. Data was used to infer genetic ancestry in Brazilians with an admixture model. Pairwise estimates of F(st) among the five Brazilian geopolitical regions suggested little genetic differentiation only between the South and the remaining regions. Estimates of ancestry results are consistent with the heterogeneous genetic profile of Brazilian population, with a major contribution of European ancestry (0.771) followed by African (0.143) and Amerindian contributions (0.085). The described multiplexed SNP panels can be useful tool for bioanthropological studies but it can be mainly valuable to control for spurious results in genetic association studies in admixed populations".[80] It is important to note that "the samples came from free of charge paternity test takers, thus as the researchers made it explicit: "the paternity tests were free of charge, the population samples involved people of variable socioeconomic strata, although likely to be leaning slightly towards the ‘‘pardo’’ group".[81]
| Region[81] | European | African | Native American |
|---|---|---|---|
| North Region | 71.10% | 18.20% | 10.70% |
| Northeast Region | 77.40% | 13.60% | 8.90% |
| Central-West Region | 65.90% | 18.70% | 11.80% |
| Southeast Region | 79.90% | 14.10% | 6.10% |
| South Region | 87.70% | 7.70% | 5.20% |
An autosomal DNA study from 2009 found a similar profile "all the Brazilian samples (regions) lie more closely to the European group than to the African populations or to the Mestizos from Mexico".[82]
| Region[83] | European | African | Native American |
|---|---|---|---|
| North Region | 60.6% | 21.3% | 18.1% |
| Northeast Region | 66.7% | 23.3% | 10.0% |
| Central-West Region | 66.3% | 21.7% | 12.0% |
| Southeast Region | 60.7% | 32.0% | 7.3% |
| South Region | 81.5% | 9.3% | 9.2% |
According to another autosomal DNA study from 2008, by the University of Brasília (UnB), European ancestry dominates in the whole of Brazil (in all regions), accounting for 65.90% of heritage of the population, followed by the African contribution (24.80%) and the Native American (9.3%).[84]
São Paulo state, the most populous state in Brazil, with about 40 million people, showed the following composition, according to an autosomal study from 2006: European genes account for 79% of the heritage of the people of São Paulo, 14% are of African origin, and 7% Native American.[85] A more recent study, from 2013, found the following composition in São Paulo state: 61.9% European, 25.5% African and 11.6% Native American.[76] The sample used in this last study for the state of São Paulo comes from free of charge paternity tests whose use is known to be slightly biased towards the ‘‘pardo’’ group, which has a higher degree of african ancestry.[81]
Races and ethnicities by region
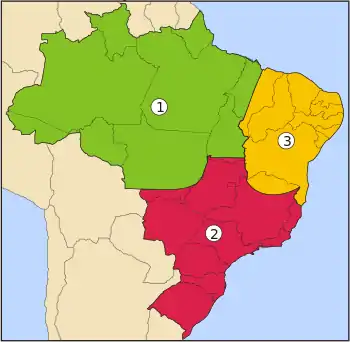
South
The South of Brazil is the region with the largest percentage of Europeans. According to the 2005 census, people of European ancestry account for 79.6% of the population.[72] In colonial times, this region had a very small population.
The region what is now Southern Brazil was originally settled by Amerindian peoples, mostly Guarani and Kaingangs.[86] Only a few settlers from São Paulo were living there. This situation made the region vulnerable to attacks from neighboring countries. This fact forced the King of Portugal to decide to populate the region. For this, settlers from the Portuguese Azores islands were sent to the coast.
To stimulate the immigration to Brazil, the king offered several benefits for the Azorean couples. Between 1748 and 1756, six thousand Portuguese from the Azores moved to the coast of Santa Catarina. They were mainly newly married who were seeking a better life. At that time, the Azores were one of the poorest regions of Portugal. They established themselves mainly in the Santa Catarina Island, nowadays the region of Florianópolis. Later, some couples moved to Rio Grande do Sul, where they established Porto Alegre, the capital. The Azoreans lived on fishing and agriculture, especially flour. They composed over half of Rio Grande do Sul and Santa Catarina's population in the late 18th century.[87] The state of Paraná was settled by colonists from São Paulo due to their proximity (Paraná was part of São Paulo until the mid-19th century).
With the development of cattle in the interior of Rio Grande do Sul, African slaves began arriving in large numbers. By 1822, Africans were 50% of Rio Grande do Sul's population. This number decreased to 25% in 1858 and to only 5.2% in 2005. Most of them came from Angola.[88]
After independence from Portugal (1822) the Brazilian government started to stimulate the arrival of a new wave of immigrants to settle the South. In 1824 they established São Leopoldo, a German community. Major Schaeffer, a German who was living in Brazil, was sent to Germany in order to bring immigrants. From Rhineland-Palatinate, the Major brought the immigrants and soldiers. Settlers from Germany were brought to work as small farmers, because there were many land holdings without workers.
To attract the immigrants, the Brazilian government had promised large tracts of land, where they could settle with their families and colonize the region. The first years were not easy. Many Germans died of tropical disease, while others left the colonies to find better living conditions. The German colony of São Leopoldo was a disaster. Nevertheless, in the following years, a further 4,830 Germans arrived at São Leopoldo, and then the colony started to develop, with the immigrants establishing the town of Novo Hamburgo (New Hamburg).
From São Leopoldo and Novo Hamburgo, the German immigrants spread into others areas of Rio Grande do Sul, mainly close to sources of rivers. The whole region of Vale dos Sinos was populated by Germans. During the 1830s and part of the 1840s German immigration to Brazil was interrupted due to conflicts in the country (Ragamuffin War). The immigration restarted after 1845 with the creation of new colonies. The most important ones were Blumenau, in 1850, and Joinville in 1851, both in Santa Catarina state; these attracted thousands of German immigrants to the region. In the next five decades, other 28 thousand Germans were brought to Rio Grande do Sul to work as small farmers in the countryside.[89] By 1914, it is estimated that 50 thousand Germans settled in this state.
Another immigration boom to this region started in 1875. Communities with Italian immigrants were also created in southern Brazil. The first colonies to be populated by Italians were created in the highlands of Rio Grande do Sul (Serra Gaúcha). These were Garibaldi and Bento Gonçalves. These immigrants were predominantly from Veneto, in northern Italy. After five years, in 1880, the great numbers of Italian immigrants arriving caused the Brazilian government to create another Italian colony, Caxias do Sul. After initially settling in the government-promoted colonies, many of the Italian immigrants spread themselves into other areas of Rio Grande do Sul seeking further opportunities.
They created many other Italian colonies on their own, mainly in highlands, because the lowlands were already populated by Germans and native gaúchos. The Italian established many vineyards in the region. Nowadays, the wine produced in these areas of Italian colonization in southern Brazil is much appreciated within the country, though little is available for export. In 1875, the first Italian colonies were established in Santa Catarina, which lies immediately to the north of Rio Grande do Sul. The colonies gave rise to towns such as Criciúma, and later also spread further north, to Paraná.
A significant number of Poles have settled in Southern Brazil. The first immigrants arrived in 1869 and until 1959, it is estimated that over 100,000 Poles migrated to Brazil,[90] 95% of whom were peasants. The State of Paraná received the majority of Polish immigrants, who settled mainly in the region of Curitiba, in the towns of Mallet, Cruz Machado, São Matheus do Sul, Irati, and União da Vitória.
Southeast
The Southeastern region of Brazil is the most ethnically diverse part of the country. Europeans make up 55.16% of its population, those of mixed-race 35.69%, and African descent 7.91%. It has the largest percentage of Asian-Brazilians, composing 0.8%, and a small Amerindian community (0.2%).
Southeast Brazil is home to the oldest Portuguese village in the Americas, São Vicente, São Paulo, established in 1532.[91] The region, since the beginning of its colonization, is a melting pot of Africans, Indians, and Europeans. The Amerindians of the region were enslaved by the Portuguese. The race mixing between the Indian females and their European masters produced the Bandeirante, the colonial inhabitant of São Paulo, who formed expeditions that crossed the interior of Brazil and greatly increased the Portuguese colonial territory. The main language spoken by these people of mixed Indian/Portuguese heritage was Língua geral, a language that mixed Tupi and Portuguese words.
In the late 17th century the Bandeirantes found gold in the area that nowadays is Minas Gerais. A gold rush took place in Brazil and thousands of Portuguese colonists arrived during this period. The confrontation between the Bandeirantes and the Portuguese for obtaining possession of the mines led to the Emboabas' War. The Portuguese won the war. The Amerindian culture declined, giving space to a stronger Portuguese cultural domination. In order to control the wealth, the Portuguese Crown moved the capital of Brazil from Salvador, Bahia to Rio de Janeiro. Thousands of African slaves were brought to work in the gold mines. They were landed in Rio de Janeiro and sent to other regions. By the late 18th century, Rio de Janeiro was an "African city": most of its inhabitants were slaves. No other place in the world had as many slaves since the end of the Roman Empire.[92] In 1808 the Portuguese Royal Family, fleeing from Napoleon, took charge in Rio de Janeiro. Some 15,000 Portuguese nobles moved to Brazil. The region changed a lot, becoming more European.
After independence and principally after 1850, Southeast Brazil was "inundated" by European immigrants, who were attracted by the government to replace the African slaves in the coffee plantations. Most immigrants landed in the Port of Santos and have been forwarded to the coffee farms within São Paulo. The vast majority of the immigrants came from Italy. Brazil attracted nearly 5 million immigrants between 1870 and 1953. The large number of Italians are visible in many parts of Southeast Brazil. Their descendants are nowadays predominant in many areas. For example, Northeast São Paulo is 65% Italian.[93]
The arrival of immigrants from several parts of Europe, the Middle-East and Asia produced an ethnically diverse population. The city of Bastos, in São Paulo, is 11.4% Japanese. The city of São Paulo is home to the largest Japanese population outside Japan itself. [94]
Northeast
The population of Northeast Brazil is a result of an intensive race mixing, which has occurred in the region for more than four centuries. According to the 2006 census people reported as "brown" make up 62.5% of the population. Those reported as African account for 7.8%.
This region did not have much effect from the massive European immigration that took place in Southern Brazil in the late 19th century and first decades of the 20th century. The Northeast has been a poorer region of Brazil since the decline of sugar cane plantations in the late 17th century, so its economy did not require immigrants.
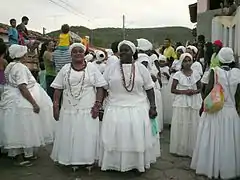
The ethnic composition of the population starts in the 16th century. The Portuguese settlers rarely brought women, which led to relationships with the Indian women. Later, interracial relationships occurred between Portuguese males and African females. The coast, in the past the place where millions of African slaves arrived (mostly from modern-day Angola, Ghana, Nigeria and Benin) to work in sugar-cane plantations, is where nowadays there is a predominance of Mulattoes, those of African and European ancestry. Salvador, Bahia is considered the largest African city outside of Africa, with over 80% of its inhabitants being African-Brazilians. In the interior, there is a predominance of Indian and European mixture.[95]
North
Northern Brazil, largely covered by the Amazon rainforest, is the Brazilian region with the largest Amerindian influences, both in culture and ethnicity. Inhabited by diverse indigenous tribes, this part of Brazil was reached by Portuguese and Spanish colonists in the 17th century, but it started to be populated by non-Indians only in the late 19th and early 20th centuries. The exploitation of rubber used in the growing industries of automobiles, has emerged a huge migration to the region.
Many people from the poor Northeast Brazil, mostly Ceará, moved to the Amazon area. The contact between the Indians and the northeastern rubbers created the base of the ethnic composition of the region, with its mixed-race majority.
Central-West
The Central-West region of Brazil was inhabited by diverse Indians when the Portuguese arrived in the early 18th century. The Portuguese came to explore the precious stones that were found there. Contact between the Portuguese and the Indians created a mixed-race population. Until the mid-20th century, Central-West Brazil had a very small population. The situation changed with the construction of Brasília, the new capital of Brazil, in 1960. Many workers were attracted to the region, mostly from northeastern Brazil.
A new wave of settlers started arriving from the 1970s. With the mechanization of agriculture in the South of Brazil, many rural workers of German and Italian origin migrated to Central-West Brazil. In some areas, they are already the majority of the population.
Education and health

The Federal Constitution of 1988 and the 1996 General Law of Education in Brazil (LDB) attributed to the Federal Government, states, Federal District and municipalities the responsibility of managing the Brazilian educational system, considering three educational public systems as a basis for collaboration between these federal systems. Each of these public educational systems is responsible for its own maintenance, which manages funds as well as mechanisms and sources for financial resources. The new Constitution reserves 25% of state and municipal taxes and 18% of federal taxes for education.[96]
As set out by the Brazilian Constitution, the main responsibility for basic education is attributed to the states and municipalities. Hence, a historical feature of Brazilian basic education is its extremely decentralized nature, which gives great organizational autonomy to sub-national governments (27 states and 5,546 municipalities) in organizing their educational systems. Early childhood education, from 0–6 years, is under exclusive responsibility of the municipalities. Responsibility for compulsory primary education from 1st to 9th grades is shared between states and municipalities. Kindergarten and pre-school education are the responsibility of local levels of government, whereas secondary schools are under the responsibility of the states. Maintenance of the system, including salaries, the definition of teacher career structures and supervision of early childhood, primary, and secondary levels (which make up basic education) is decentralized, and these levels are responsible for defining their respective curriculum content.
Higher education starts with undergraduate or sequential courses, which may offer different specialization choices such as academic or vocational paths. Depending on the choice, students may improve their educational background with Stricto Sensu or Lato Sensu postgraduate courses. Higher education has three main purposes: teaching, research and extension, each with their own specific contribution to make to a particular course. Diplomas and certificates are proof of having passed through higher education.
In 2003, the literacy rate was at 88 percent of the population, and the youth literacy rate (ages 15–19) was 93.2 percent.[96] However, Brazilian analysts tend to approach these favorable numbers with suspicion, considering the generally poor levels of performance displayed by students, especially in the public school network.
According to Brazilian Government, the most serious health problems are:[97]
- Childhood mortality: about 2.51% of childhood mortality, reaching 3.77% in the northeast region.
- Motherhood mortality: about 73.1 deaths per 100,000 born children in 2002.
- Mortality by non-transmissible illness: 151.7 deaths per 100,000 inhabitants caused by heart and circulatory diseases, along with 72.7 deaths per 100,000 inhabitants caused by cancer.
- Mortality caused by external causes (transportation, violence and suicide): 71.7 deaths per 100,000 inhabitants (14.9% of all deaths in the country), reaching 82.3 deaths in the southeast region.
Religion

According to the IBGE census 2010[98] 64.6% are Roman Catholics; 24% are Protestants and other Christians, 8% are agnostics, atheists or have no religion, 2% are followers of Spiritism, and 1% are members of other religions. Some of these religions are Jehovah's Witnesses (1,100,000), Latter-day Saints (200,000), Buddhism (215,000), Judaism (86,000), and Islam (27,00)[99] and some practice a mixture of different religions, such as Catholicism, Candomblé,[100] and indigenous American religions .
Brazil has the largest Roman Catholic population in the world.[101]
Followers of Protestantism are rising in number. Until 1970, the majority of Brazilian Protestants were adherents of "traditional churches", mostly Lutherans, Presbyterians and Baptists. There are 120,000 Episcopalians in 9 dioceses (Anglican Episcopal Church of Brazil). Since then, numbers of Pentecostal and Neopentecostal adherents have increased significantly.
Islam in Brazil was first practiced by African slaves.[102] Today, the Muslim population in Brazil is made up mostly of Arab immigrants.[103]
The largest population of Buddhists in Latin America lives in Brazil, due greatly to Brazil's large Japanese population.
Languages
Portuguese is the only official language of Brazil.[104] It is spoken by nearly the entire population and is virtually the only language used in schools, newspapers, radio, TV and for all business and administrative purposes. Moreover, Brazil is the only Portuguese-speaking nation in the Americas, making the language an important part of Brazilian national identity.
Many Amerindian languages are spoken daily in indigenous communities, primarily in Northern Brazil. Although many of these communities have significant contact with Portuguese,[105] today there are incentives stimulating preservation and the teaching of native languages. According to SIL International, 133 Native American languages are currently endangered. Some of the largest indigenous language groups include Arawak, Carib, Macro-Gê and Tupi.[106] In 2006, the City of São Gabriel da Cachoeira in the region of Cabeça do Cachorro (Northwestern region of the State of Amazonas), has adopted some indigenous languages as some of its other official languages along with Portuguese.
Other languages are spoken by descendants of immigrants, who are usually bilingual, in small rural communities in Southern Brazil. The most important are the Brazilian German dialects, such as Riograndenser Hunsrückisch and the East Pomeranian dialect, and also the Talian, based on the Italian Venetian language. There are also bilingual speakers of Polish, Ukrainian and Russian in Southern Brazil, especially Paraná. In the city of São Paulo, Levantine Arabic, Japanese, Chinese and Korean can be heard in the immigrant neighborhoods, such as Liberdade. Yiddish and Hebrew are used by Jewish communities mainly in São Paulo, Rio de Janeiro, Porto Alegre, Curitiba, Brasília, Belo Horizonte and Recife as well as the Vlax Romani dialect by Gypsy communities all across the nation.
The World Factbook demographic statistics
The following demographic statistics are from The World Factbook, unless otherwise indicated[107]
Nationality
- noun: Brazilian(s)
- adjective: Brazilian
Population
- 211,715,973
Languages
- Portuguese (official)
Ethnic groups
- European 47.7%
- Caboclo, Castizo 22.3%
- Mulatto, Quadroon, Octoroon 20.1%
- Black Brazilians 7.6%
- Asian 1.1%
- Indigenous 0.4%
- Gypsy 0.4%
- Eurasian, Hafu 0.3%
Literacy
- Total population: 92.6%
- Male: 92.2%
- Female: 92.9% (2015 est.)
Religions
- Roman Catholic 64.6%
- Other Catholic 0.4%
- Protestant 22.2%
- Adventist (including Seventh-day Adventist and Adventist Church of Promise) 6.5%
- Assembly of God 2.0%
- Christian Congregation of Brazil 1.2%
- Universal Church of the Kingdom of God 1.0%
- Other Protestant 11.5%
- Other Christian 0.7%
- Spiritist 2.2%
- Other 1.4%
- None 8%
- Unspecified 0.4%
See also
References
- "Históricos dos censos demográficos". Instituto Brasileiro de Geografía e Estatística. Retrieved 24 October 2017.
- "Projeção da população do Brasil e das Unidades da Federação". Instituto Brasileiro de Geografía e Estatística. Retrieved 24 October 2017.
- IBGE. 2008 PNAD
- Technical Brief on the Implications of COVID-19 on Census (PDF). UNFPA. 2020.
- "Portal Brazil". Brasil.gov.br. Retrieved 30 August 2017.
- "IBGE - Projeção da população". Ibge.gov.br. Retrieved 6 May 2020.
- ""World Population prospects – Population division"". population.un.org. United Nations Department of Economic and Social Affairs, Population Division. Retrieved 9 November 2019.
- ""Overall total population" – World Population Prospects: The 2019 Revision" (xslx). population.un.org (custom data acquired via website). United Nations Department of Economic and Social Affairs, Population Division. Retrieved 9 November 2019.
- "World Population Prospects - Population Division - United Nations". esa.un.org.
- Max Roser (2014), "Total Fertility Rate around the world over the last centuries", Our World In Data, Gapminder Foundation
- "World Factbook EUROPE : GERMANY", The World Factbook, 12 July 2018
 This article incorporates text from this source, which is in the public domain.
 - "United Nations Statistics Division - Demographic and Social Statistics". unstats.un.org.
- "Estatísticas Vitais - Mortalidade e Nascidos Vivos". TABNET - Ministerio da Saúde. Retrieved 29 June 2018.
- "Fecundidade E Dinâmica Da População Brasileira" [Fertility and Dynamics of the Brazilian Population] (PDF) (in Portuguese). Brasília: UNFPA. December 2018. Retrieved 5 June 2020.
- "IBGE – 2010 Census: Country faces decline of fertility". Ibge.gov.br. Archived from the original on 17 January 2013. Retrieved 30 August 2017.
- "Tabela 1.3.1 - População residente, por cor ou raça, segundo o sexo e os Sexo e grupos de idade : Brasil - 2010" (PDF). Ibge.gov.br. Retrieved 30 August 2017.
- "Brazil Population 2018", World Population Review
- "Mais da metade da população vive em 294 arranjos formados por contiguidade urbana e por deslocamentos para trabalho e estudo" (in Portuguese). Brazilian Institute of Geography and Statistics. Retrieved 16 March 2017.
- "Arranjos Populacionais e Concentrações Urbanas do Brasil" (PDF) (in Portuguese). Brazilian Institute of Geography and Statistics. p. 148. Retrieved 16 March 2017.
- "Estimativas da população residente no Brasil e Unidades da Federação com data de referência em 1º de julho de 2017" (PDF) (in Portuguese). Brazilian Institute of Geography and Statistics. Retrieved 14 May 2018.
- "2010 Brazilian Institute of Geography and Statistics estimate". Brazilian Institute of Geography and Statistics. 29 November 2011. Retrieved 22 January 2011.
- "Archived copy". Archived from the original on 4 September 2007. Retrieved 7 August 2007.CS1 maint: archived copy as title (link)
- "Brazil - Amerindians". countrystudies.us. Retrieved 30 August 2017.
- "Entrada de imigrantes no Brasil – 1870/1907" (in Portuguese). Archived from the original on 13 June 2007. Retrieved 20 June 2007.
- "Entrada de imigrantes no Brasil – 1908/1953" (in Portuguese). Archived from the original on 13 June 2007. Retrieved 20 June 2007.
- Simon Schwartzman. "Fora de foco: diversidade e identidades étnicas no Brasil" (PDF). Schwartzman.org.br. p. 10. Retrieved 30 August 2017.
- Sanchanta, Mariko (19 July 2007). "Signs betray 'hidden workers' of Japan". Financial Times. Retrieved 30 August 2017.
- Amaral, Ernesto F. (2005) "Shaping Brazil: The Role of International Migration", Migration Policy Institute website. Retrieved 13 June 2007.
- ""Jewish Roots of Brazil", Anita Novinsky, 1987". Rumoatolerancia.fflch.usp.br. Archived from the original on 11 March 2012. Retrieved 30 August 2017.
- "Archived copy". Archived from the original on 20 April 2016. Retrieved 20 April 2016.CS1 maint: archived copy as title (link)
- "You are being redirected..." global100.adl.org. Retrieved 30 August 2017.
- "Brazil Virtual Jewish History Tour". Jewishvirtuallibrary.org.
- "Brazil - Modern-Day Community". Jewishvirtuallibrary.org/. 2013. Retrieved 22 December 2013.
- "Brazil - International Religious Freedom Report 2009". State.gov/. 26 October 2009. Retrieved 22 December 2013.
- "Federação Israelita do Rio Grande do Sul". Firgs.org.br. 2009. Archived from the original on 28 May 2009. Retrieved 25 December 2013.
- "PNAD 2006" (PDF). Ibge.gov.br. Archived from the original (PDF) on 22 February 2012. Retrieved 30 August 2017.
- "Sistema IBGE de Recuperação Automática - SIDRA". Ibge.gov.br. Retrieved 30 August 2017.
- "Censo Brasil 2010". Noticias.uol.com.br. Retrieved 29 March 2016.
- "Dados do Censo". Brasilescola.uol. Retrieved 29 March 2016.
- (PDF). 16 October 2015 https://web.archive.org/web/20151016224631/http://www.ibge.gov.br/english/estatistica/populacao/censo2010/caracteristicas_da_populacao/tabelas_pdf/tab3.pdf. Archived from the original on 16 October 2015. Retrieved 30 August 2017. Missing or empty
|title=(help)CS1 maint: bot: original URL status unknown (link) - Monasterio, Leonardo (8 May 2017). "Surnames and ancestry in Brazil". PLOS ONE. 12 (5): e0176890. Bibcode:2017PLoSO..1276890M. doi:10.1371/journal.pone.0176890. PMC 5421764. PMID 28481940.
- Júnior, Judicael Clevelario (1997). "A participação da imigração na formação da população brasileira" [The participation of immigration in the formation of the Brazilian population]. Revista Brasileira de Estudos de População (in Portuguese). 14 (1/2): 51–71.
- "Fora de foco: diversidade e identidades étnicas no Brasil". Retrieved 4 June 2019.
- Hout, Michael; Goldstein, Joshua R. (1994). "How 4.5 Million Irish Immigrants Became 40 Million Irish Americans: Demographic and Subjective Aspects of the Ethnic Composition of White Americans". American Sociological Review. 59 (1): 64–82. doi:10.2307/2096133. JSTOR 2096133.
- "Racial Reality – European-Americans". Sitesled.com. Archived from the original on 2 December 2008. Retrieved 30 August 2017.
- "El 56% de los argentinos tiene antepasados indígenas". Clarin.com.
- "Imigração Holandesa no Brasil. Glossário. História, Sociedade e Educação no Brasil - HISTEDBR - Faculdade de Educação - UNICAMP". Histedbr.fae.unicamp.br. Archived from the original on 6 August 2013. Retrieved 23 January 2014.
- "Holandeses no Brasil - Radio Nederland, a emissora internacional e independente da Holanda - Português". 6 September 2009. Archived from the original on 6 September 2009. Retrieved 30 August 2017.
- "Research Professor, A.C. Van Raalte Institute, Hope College, Holland, Michigan, USA". Twelfth International Economic History Conference, Madrid, Spain, August 28, 1998 (Session C-31). Retrieved 4 May 2016.
- "O panorama lingüístico brasileiro: a coexistência de línguas minoritárias com o português" (PDF). Revistas.usp.br. Retrieved 30 August 2017.
- "Paraná State Government page". Cidadao.pr.gov.br. Archived from the original on 16 January 2014. Retrieved 23 January 2014.
- "Olivet Second Most Spoken Languages Around the World". Olivet.edu. Retrieved 29 March 2016.
- "Brazil". Ethnologue.com. Retrieved 30 August 2017.
- "Hunsrik". Ethnologue.com. Retrieved 30 August 2017.
- Pupp Spinassé, Karen (2008). "Os imigrantes alemães e seus descendentes no Brasil : a língua como fator identitário e inclusivo" [German immigrants and their descendants in Brazil: language as an identity and inclusive factor]. Conexão Letras (in Portuguese). 3 (3): 125–140. hdl:10183/20697.
- Altenhofen, Cléo Vilson: Hunsrückisch in Rio Grande do Sul, Franz Steiner Verlag, Stuttgart 1996
- Levy, Maria Stella Ferreira (June 1974). "O papel da migração internacional na evolução da população brasileira (1872 a 1972)" [The role of international migration on the evolution of the Brazilian population (1872 to 1972)]. Revista de Saúde Pública (in Portuguese). 8 (suppl): 49–90. doi:10.1590/S0034-89101974000500003.
- "São Paulo capital, uma cidade italiana e os misteres profissionais dos imigrantes italianos". Brasil500anos.ibge.gov.br. Retrieved 11 April 2016.
- "Veneto". Ethnologue. Retrieved 29 March 2016.
- "Venetian or Talian". Ethnologue. Retrieved 21 July 2015.
- "Estudo descobre 31 milhões de portugueses pelo mundo". Dn.pt. Retrieved 7 April 2016.
- "Archived copy". Archived from the original on 3 March 2016. Retrieved 24 August 2014.CS1 maint: archived copy as title (link)
- "Só o Brasil concedeu mais de 52 mil vistos de residência nos primeiros 6 meses". Graciano Coutinho OPovo. Archived from the original on 19 August 2017. Retrieved 7 April 2016.
- "Imigração aumenta 50 por cento em seis meses". Brasil.gov.br. Retrieved 7 April 2016.
- "Archived copy". Archived from the original on 2 November 2006. Retrieved 6 November 2006.CS1 maint: archived copy as title (link)
- Pacific Island Travel web-site, accessed 4.8.08 Archived 3 September 2008 at the Wayback Machine, taken from: Brazil: the Rough Guide, by David Cleary, Dilwyn Jenkins, Oliver Marshall, Jim Hine. ISBN 1-85828-223-3
- Edward Eric Telles (2004). "Racial Classification". Race in Another America: the significance of skin color in Brazil. Princeton University Press. pp. 81–84. ISBN 978-0-691-11866-6.
- David I. Kertzer and Dominique Arel (2002). Census and Identity: The Politics of Race, Ethnicity, and Language in National Censuses. Cambridge University Press. pp. 63–64. ISBN 978-0-521-00427-5.
- Pena, Sérgio D. J.; Di Pietro, Giuliano; Fuchshuber-Moraes, Mateus; Genro, Julia Pasqualini; Hutz, Mara H.; Kehdy, Fernanda de Souza Gomes; Kohlrausch, Fabiana; Magno, Luiz Alexandre Viana; Montenegro, Raquel Carvalho; Moraes, Manoel Odorico; Moraes, Maria Elisabete Amaral de; Moraes, Milene Raiol de; Ojopi, Élida B.; Perini, Jamila A.; Racciopi, Clarice; Ribeiro-dos-Santos, Ândrea Kely Campos; Rios-Santos, Fabrício; Romano-Silva, Marco A.; Sortica, Vinicius A.; Suarez-Kurtz, Guilherme (16 February 2011). "The Genomic Ancestry of Individuals from Different Geographical Regions of Brazil Is More Uniform Than Expected". PLOS ONE. 6 (2): e17063. Bibcode:2011PLoSO...617063P. doi:10.1371/journal.pone.0017063. PMC 3040205. PMID 21359226.
- Pereira, Clifford J. (May 2014). "East in the West: Investigating the Asian presence and influence in Brazil from the sixteenth to the eighteenth centuries". Proceedings of the 2nd Asia-Pacific Regional Conference on Underwater Cultural Heritage. Honolulu, Hawai'i.
- "Censo Demográfi co 2010 Características da população e dos domicílios Resultados do universo" (PDF). 8 November 2011. Retrieved 12 July 2014.
- "PNDA Census 2005 race" (PDF) (in Portuguese). Archived from the original (PDF) on 25 August 2007. Retrieved 26 June 2007.
- "'Estou orgulhoso com a minha raíz da China' --Leone Da Silveira Lee, primeiro e único general brasileiro com descendência chinesa" ['I am proud of my Chinese roots' --Leone Da Silveira Lee, the first and only Brazilian general of Chinese descent]. China Radio International online (in Portuguese). 22 May 2007. Retrieved 8 January 2017.
- Alves-Silva, J; da Silva Santos, M; Guimarães, PE; et al. (August 2000). "The ancestry of Brazilian mtDNA lineages". Am. J. Hum. Genet. 67 (2): 444–61. doi:10.1086/303004. PMC 1287189. PMID 10873790.
- Rodrigues de Moura, Ronald; Coelho, Antonio Victor Campos; de Queiroz Balbino, Valdir; Crovella, Sergio; Brandão, Lucas André Cavalcanti (10 September 2015). "Meta-analysis of Brazilian genetic admixture and comparison with other Latin America countries". American Journal of Human Biology. 27 (5): 674–680. doi:10.1002/ajhb.22714. PMID 25820814. S2CID 25051722.
- Manta, Fernanda Saloum de Neves; Pereira, Rui; Vianna, Romulo; Araújo, Alfredo Rodolfo Beuttenmüller de; Gitaí, Daniel Leite Góes; Silva, Dayse Aparecida da; Wolfgramm, Eldamária de Vargas; Pontes, Isabel da Mota; Aguiar, José Ivan; Moraes, Milton Ozório; Carvalho, Elizeu Fagundes de; Gusmão, Leonor (20 September 2013). "Revisiting the Genetic Ancestry of Brazilians Using Autosomal AIM-Indels". PLOS ONE. 8 (9): e75145. Bibcode:2013PLoSO...875145S. doi:10.1371/journal.pone.0075145. PMC 3779230. PMID 24073242.
- "Archived copy". Archived from the original on 2 May 2012. Retrieved 2012-07-21.CS1 maint: archived copy as title (link) Profile of the Brazilian blood donor
- "Nossa herança europeia — Instituto Ciência Hoje". 30 January 2012. Archived from the original on 30 January 2012. Retrieved 30 August 2017.
- "DNA de brasileiro é 80% europeu, indica estudo". Folha.uol.com.br. Retrieved 30 August 2017.
- Lins, TC; Vieira, RG; Abreu, BS; Grattapaglia, D; Pereira, RW (2010). "Genetic composition of Brazilian population samples based on a set of twenty-eight ancestry informative SNPs". Am. J. Hum. Biol. 22: 187–92. doi:10.1002/ajhb.20976. PMID 19639555. S2CID 205301927.
- Lins, Tulio C.; Vieira, Rodrigo G.; Abreu, Breno S.; Grattapaglia, Dario; Pereira, Rinaldo W. (1 March 2010). "Genetic composition of Brazilian population samples based on a set of twenty-eight ancestry informative SNPs". American Journal of Human Biology. 22 (2): 187–192. doi:10.1002/ajhb.20976. PMID 19639555. S2CID 205301927.
- De Assis Poiares, L.; De Sá Osorio, P.; Spanhol, F. A.; Coltre, S. C.; Rodenbusch, R.; Gusmão, L.; Largura, A.; Sandrini, F.; Da Silva, C. M. (February 2010). "Allele frequencies of 15 STRs in a representative sample of the Brazilian population". Forensic Sci Int Genet. 4 (2): e61–3. doi:10.1016/j.fsigen.2009.05.006. PMID 20129458.
- "Announcement of Population Data : Allele frequencies of 15 STRs in a representative sample of the Brazilian population" (PDF). Webcitation.org. Archived from the original (PDF) on 8 April 2011. Retrieved 30 August 2017.
- "the impact of migrations in the constitution of Latin American populations" (PDF). Repositorio.unb.br. Retrieved 30 August 2017.
- Ferreira, Luzitano Brandão; Mendes, Celso Teixeira; Wiezel, Cláudia Emília Vieira; Luizon, Marcelo Rizzatti; Simões, Aguinaldo Luiz (1 September 2006). "Genomic ancestry of a sample population from the state of São Paulo, Brazil". American Journal of Human Biology. 18 (5): 702–705. doi:10.1002/ajhb.20474. PMID 16917899. S2CID 10103856.
- "Grupos indígenas e sua distribuição - Página do Gaúcho". Paginadogaucho.com.br.
- "Imigrantes: Açorianos". 31 December 2007. Archived from the original on 31 December 2007. Retrieved 30 August 2017.
- RS VIRTUAL – O Rio Grande do Sul na Internet – História – Colonização – Negros – A história dos gaúchos sem história Archived 29 September 2007 at the Wayback Machine
- Germans Archived 16 July 2007 at the Wayback Machine
- Decol, René D. (24 February 2016). "Uma história oculta: a imigração dos países da Europa do Centro-Leste para o Brasil" [A hidden story: immigration from Central European countries to Brazil]. Anais (in Portuguese). 0: 1–12.
- RankBrasil – Livro Dos Recordes Brasileiros – Os melhores e maiores do Brasil Archived 24 December 2007 at the Wayback Machine
- Pdt – Rj Archived 5 December 2008 at the Wayback Machine
- Fundação Lorenzato Archived 20 November 2008 at the Wayback Machine
- São Paulo é tudo de bom – Turismo, eventos e entretenimento na cidade de São Paulo Archived 7 January 2008 at the Wayback Machine
- "Regiões do Brasil". 5 January 2008. Archived from the original on 5 January 2008. Retrieved 30 August 2017.CS1 maint: bot: original URL status unknown (link)
- Japan Bank for International Cooperation report, November 2005, "Sector Study for Education in Brazil" Archived 19 June 2007 at the Wayback Machine, retrieved 28 February 2007
- "Archived copy". Archived from the original on 7 January 2006. Retrieved 21 December 2005.CS1 maint: archived copy as title (link)
- IBGE - Instituto Brasileiro de Geografia e Estatística (Brazilian Institute for Geography and Statistics). 2010 Census. Accessed 07.08.2012.
- "Religion in Brazil" (PDF). IBGE. 2000. Retrieved 24 April 2007.
- Johnson 2002, p. 73.
- "The Global Catholic Population". Pew Research Center. 13 February 2013. Retrieved 10 June 2020.
- Lovejoy, Paul E., Muslim Encounters With Slavery in Brazil, Markus Wiener Pub., 2007. ISBN 1-55876-378-3.
- de Oliveira, Vitória Peres (2006). "Islam in Brazil or the Islam of Brazil?". Religião & Sociedade. 2.
- "Portuguese, the official language of Brazil". Brazilian Government official website. Archived from the original on 15 June 2007. Retrieved 4 August 2007.
- "Portuguese throughout the world". Brazilian Government official website. Archived from the original on 15 June 2007. Retrieved 4 August 2007.
- "Archived copy". Archived from the original on 6 August 2007. Retrieved 7 August 2007.CS1 maint: archived copy as title (link)
- "South America :: BRAZIL". CIA The World Factbook. Retrieved 30 August 2017.
![]() This article incorporates public domain material from the CIA World Factbook document: "2006 edition".
This article incorporates public domain material from the CIA World Factbook document: "2006 edition".
External links
- United Nations "World Population Prospects": Country Profile – Brazil
- Population Statistics for Brazil
- Build Brazil population graph 1960 – 2013 (World Bank data)
- Build Brazil population projection graph till 2100 (United Nation data)
- Build Brazil life expectancy at birth graph 1950 – 2013 (United Nation data)