Demographics of Bolivia
The demographic characteristics of the population of Bolivia are known from censuses, with the first census undertaken in 1826 and the most recent in 2012. The National Institute of Statistics of Bolivia (INE) has performed this task since 1950. The population of Bolivia in 2012 reached 10 million for the first time in history. The population density is 9.13 inhabitants per square kilometer, and the overall life expectancy in Bolivia at birth is 68.2 years. The population has steadily risen from the late 1800s to the present time. The natural growth rate of the population is positive, which has been a continuing trend since the 1950s; in 2012, Bolivia's birth rate continued to be higher than the death rate. Bolivia is in the third stage of demographic transition. In terms of age structure, the population is dominated by the 15–64 segment. The median age of the population is 23.1, and the gender ratio of the total population is 0.99 males per female.
| Demographics of Bolivia | |
|---|---|
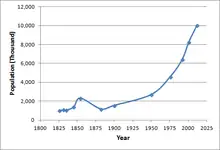 Scatter plot of the population of Bolivia (in thousands) from 1826–2012 | |
| Population | 10,027,254 (2012) |
| Density | 9.1 people/km2 (2012) |
| Growth rate | 21.2% (2012) |
| Birth rate | 23.7 per 1,000 pop. (2013) |
| Death rate | 6.6 per 1,000 pop. (2013) |
| Life expectancy | 68.87 years (2014) |
| • male | 65.4 years (2013) |
| • female | 71.1 years (2013) |
| Fertility rate | 2.8 children born/woman (2013) |
| Infant mortality rate | 39.7 deaths/1,000 live births (2013) |
| Age structure | |
| 0–14 years | 31.0% (2012) |
| 15–64 years | 63.1% (2012) |
| 65 and over | 6.1% (2012) |
| Sex ratio | |
| Total | 0.99 male/female (2012) |
| Under 15 | 1.05 male/female (2012) |
| 15–64 years | 0.96 male/female (2012) |
| 65 and over | 0.88 male/female (2012) |
| Nationality | |
| Nationality | noun: Bolivian(s), adjective: Bolivian |
| Major ethnic | Quechua 45.6%, Ayamara 42.4% (2012) |
| Minor ethnic | 37 other ethnic groups (2012) |
| Language | |
| Official | Spanish, Quechua, Aymara, Guarani, and 34 other native languages |
Bolivia is inhabited mostly by Quechua (45.6%) and Aymara (42.4%), while minorities include 37 indigenous groups (0.3% average per group). Spanish, Quechua, Aymara, Guarani languages, as well as 34 other native languages are the official language of Bolivia. Spanish is the most-spoken language (60.7%) within the population. The main religions of Bolivia are the Catholic Church (81.8%), Evangelicalism (11.5%), and Protestantism (2.6%). There is a literacy rate of 91.2%. An estimated 7.6% of the country's gross domestic product (GDP) is spent on education. The average monthly household income was Bs.1,378 ($293) in 1994. In December 2013 the unemployment rate was 3.2% of the working population. The average urbanization rate in Bolivia is 67%.
Population
.png.webp)
.png.webp)
.png.webp)
| Year | Pop. | ±% p.a. |
|---|---|---|
| 1826 | 997,427 | — |
| 1831 | 1,088,768 | +1.77% |
| 1835 | 1,060,777 | −0.65% |
| 1845 | 1,378,896 | +2.66% |
| 1854 | 2,326,126 | +5.98% |
| 1882 | 1,172,156 | −2.42% |
| 1900 | 1,555,818 | +1.59% |
| 1950 | 2,704,165 | +1.11% |
| 1976 | 4,613,486 | +2.08% |
| 1992 | 6,420,792 | +2.09% |
| 2001 | 8,274,325 | +2.86% |
| 2012 | 10,027,254 | +1.76% |
| Source: 1826,[1] 1831–2001,[2] 2012[3] | ||
The first true estimate of the population of Bolivia came in 1826, in which 997,427 inhabitants were estimated. This number was calculated from the 1796 census organized by Francisco Gil de Taboada, which consisted of several Bolivian cities.[1] The first modern census was completed in 1831, and ten have been completed since then. The organizer of Bolivia's censuses has changed throughout the years—Andrés de Santa Cruz (1831), The Bolivian Statistical Office (1835, 1854, 1882), The Bolivian Statistical Commission (1845), The National Immigration Bureau and The Statistics and Geographic Propaganda (1900), and The Department of Statistics and Censuses (1950)—with the INE conducting the census since 1976.[1] The national census is supposed to be conducted every ten years, however, the 2012 census was late because of "climatic factors and the financing." The 2012 census was conducted on 21 November 2012, in which 10,027,254 inhabitants were in the country. The estimated cost of the census was $50 million.[4][5]
With a population of 10.0 million in 2012, Bolivia ranks 87th in the world by population.[3] Its population density is 9.13 inhabitants per square kilometer. The overall life expectancy in Bolivia is 65.4. The total fertility rate is 2.87 children per mother.[6] Since 1950, the World Health Organization (WHO) estimates the birth rate exceeded the death rate of the country.[7] The population of Bolivia has been increasing since 1900, and has only had a negative per annum growth rate twice in its history (1835 and 1882). Bolivia is in the third stage of demographic transition. There were 562,461 immigrants in Bolivia in 2012, with the most (40.5%) coming from Argentina.[8] In 2008, there were 48,809 marriages in Bolivia, and 5,887 divorces throughout the country in 2011.[9][10]
Cities
| Rank | Name | Department | Pop. | Rank | Name | Department | Pop. | ||
|---|---|---|---|---|---|---|---|---|---|
 Santa Cruz de la Sierra  El Alto |
1 | Santa Cruz de la Sierra | Santa Cruz | 1,453,549 | 11 | Montero | Santa Cruz | 109,518 |  La Paz 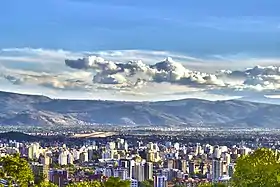 Cochabamba |
| 2 | El Alto | La Paz | 848,840 | 12 | Trinidad | Beni | 106,422 | ||
| 3 | La Paz | La Paz | 764,617 | 13 | Warnes | Santa Cruz | 96,406 | ||
| 4 | Cochabamba | Cochabamba | 630,587 | 14 | Yacuíba | Tarija | 91,998 | ||
| 5 | Oruro | Oruro | 264,683 | 15 | La Guardia | Santa Cruz | 89,080 | ||
| 6 | Sucre | Chuquisaca | 259,388 | 16 | Riberalta | Beni | 89,003 | ||
| 7 | Tarija | Tarija | 205,346 | 17 | Viacha | La Paz | 80,388 | ||
| 8 | Potosí | Potosí | 189,652 | 18 | Villa Tunari | Cochabamba | 72,623 | ||
| 9 | Sacaba | Cochabamba | 169,494 | 19 | Cobija | Pando | 55,692 | ||
| 10 | Quillacollo | Cochabamba | 137,029 | 20 | Tiquipaya | Cochabamba | 53,062 | ||
Vital statistics
| Year | Population | Births | Deaths | Natural change | Crude birth rate | Crude death rate | Natural change | Fertility rates |
|---|---|---|---|---|---|---|---|---|
| 1950 | 2,714 | 134 | 70 | 64 | 46.9 | 24.4 | 22.5 | 6.75 |
| 1955 | 3,100 | 149 | 73 | 76 | 46.8 | 23.0 | 23.8 | 6.75 |
| 1960 | 3,353 | 163 | 77 | 86 | 45.9 | 21.5 | 24.4 | 6.63 |
| 1965 | 3,751 | 181 | 81 | 100 | 45.4 | 20.2 | 25.2 | 6.56 |
| 1970 | 4,217 | 203 | 85 | 118 | 45.3 | 19.0 | 26.3 | 6.50 |
| 1975 | 4,786 | 208 | 81 | 127 | 41.1 | 16.0 | 25.1 | 5.80 |
| 1980 | 5,369 | 220 | 76 | 144 | 38.6 | 13.3 | 15.3 | 5.30 |
| 1985 | 6,041 | 238 | 72 | 166 | 37.1 | 11.3 | 25.8 | 5.00 |
| 1990 | 6,794 | 259 | 71 | 188 | 36.0 | 9.9 | 25.1 | 4.8 |
| 1995 | 7,635 | 263 | 71 | 192 | 32.7 | 8.9 | 23.8 | 4.32 |
| 2000 | 8,495 | 270 | 72 | 198 | 30.3 | 8.1 | 22.2 | 3.96 |
| 2005 | 9,355 | 267 | 73 | 194 | 27.3 | 7.5 | 19.8 | 3.50 |
| 2010 | 10,157 | 274 | 76 | 198 | 25.9 | 7.1 | 18.8 | 3.25 |
| 2015 | 11,025 | 282 | 79 | 203 | 24.5 | 6.9 | 17.6 | 3.04 |
| • All statistics are per 1,000 inhabitants • All data comes from estimations from the United Nations.[7] | ||||||||
| Year | Population | Live births | Deaths | Natural increase | Crude birth rate | Crude death rate | Rate of natural increase | TFR |
|---|---|---|---|---|---|---|---|---|
| 2009 | 346,029 | |||||||
| 2010 | 298,494 | 44,953 | 253,541 | |||||
| 2011 | 311,365 | 47,130 | 264,235 | |||||
| 2012 | 10,351,118 | 252,954 | 69,315 | 183,639 | 24.44 | 6.70 | 17.74 | 3.06 |
| 2013 | 10,507,789 | 252,455 | 68,564 | 183,891 | 24.03 | 6.53 | 17.50 | 3.01 |
| 2014 | 10,665,841 | 251,804 | 67,943 | 183,861 | 23.61 | 6.37 | 17.24 | 2.96 |
| 2015 | 10,825,013 | 251,008 | 67,427 | 183,581 | 23.19 | 6.23 | 16.96 | 2.91 |
| 2016 | 10,985,059 | 250,081 | 67,000 | 183,081 | 22.77 | 6.10 | 16.67 | 2.87 |
| 2017 | 11,145,770 | 249,030 | 66,665 | 182,365 | 22.34 | 5.98 | 16.36 | 2.82 |
| 2018 | 11,307,314 | 248,830 | 66,628 | 182,202 | 22.01 | 5.89 | 16.12 | 2.78 |
| 2019 | 11,469,896 | 248,556 | 66,662 | 181,894 | 21.67 | 5.81 | 15.86 | 2.74 |
| 2020 | 11,633,371 | 248,215 | 66,760 | 181,455 | 21.34 | 5.74 | 15.60 | 2.70 |
Fertility and Births
Total Fertility Rate (TFR) (Wanted Fertility Rate) and Crude Birth Rate (CBR):[13]
| Year | CBR (Total) | TFR (Total) | CBR (Urban) | TFR (Urban) | CBR (Rural) | TFR (Rural) |
|---|---|---|---|---|---|---|
| 1989 | 5,0 (3,2) | 4,0 (2,6) | 6,4 (4,1) | |||
| 1994 | 34 | 4,8 (2,7) | 32 | 3,8 (2,4) | 37 | 6,3 (3,3) |
| 1998 | 30.4 | 4,2 (2,5) | 27.4 | 3,3 (2,2) | 35.4 | 6,4 (3,2) |
| 2003 | 28 | 3,8 (2,1) | 26 | 3,1 (1,9) | 32 | 5,5 (2,6) |
| 2008 | 26 | 3,5 (2,0) | 24 | 2,8 (1,9) | 28 | 4,9 (2,4) |
Structure of the population[11]
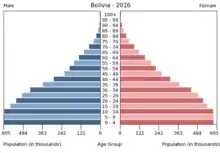
Structure of the population (21 November 2012) (Census) :
| Age Group | Male | Female | Total | % |
|---|---|---|---|---|
| Total | 5,019,447 | 5,040,409 | 10,059,856 | 100 |
| 0–4 | 556,294 | 533,654 | 1,089,948 | 10.83 |
| 5–9 | 504,623 | 488,031 | 992,654 | 9.87 |
| 10–14 | 549,866 | 528,298 | 1,078,164 | 10.72 |
| 15–19 | 559,285 | 546,999 | 1,106,284 | 11.00 |
| 20–24 | 493,018 | 485,588 | 978,606 | 9.73 |
| 25–29 | 407,293 | 410,102 | 817,395 | 8.13 |
| 30–34 | 372,197 | 381,634 | 753,831 | 7.49 |
| 35–39 | 310,162 | 320,870 | 631,032 | 6.27 |
| 40–44 | 270,971 | 273,730 | 544,701 | 5.41 |
| 45–49 | 228,006 | 233,978 | 461,984 | 4.59 |
| 50–54 | 199,526 | 203,694 | 403,220 | 4.01 |
| 55–59 | 159,128 | 164,897 | 324,025 | 3.22 |
| 60–64 | 134,457 | 145,410 | 279,867 | 2.78 |
| 65–69 | 98,098 | 106,431 | 204,529 | 2.03 |
| 70–74 | 71,902 | 80,521 | 152,423 | 1.52 |
| 75–79 | 44,974 | 54,302 | 99,276 | 0.99 |
| 80–84 | 36,230 | 46,633 | 81,095 | 0.81 |
| 85–89 | 15,884 | 22,039 | 37,923 | 0.38 |
| 90–94 | 5,996 | 8,669 | 14,665 | 0.15 |
| 95+ | 3,305 | 4,929 | 8,234 | 0.08 |
| Age group | Male | Female | Total | Percent |
|---|---|---|---|---|
| 0–14 | 1,610,783 | 1,549,983 | 3,160,766 | 31.42 |
| 15–64 | 3,134,043 | 3,166,902 | 6,300,945 | 62.63 |
| 65+ | 274,621 | 323,524 | 598,145 | 5.95 |
Life expectancy
| Period | Life expectancy in Years |
Period | Life expectancy in Years |
|---|---|---|---|
| 1950–1955 | 40.0 | 1985–1990 | 53.8 |
| 1955–1960 | 41.4 | 1990–1995 | 56.5 |
| 1960–1965 | 43.0 | 1995–2000 | 59.3 |
| 1965–1970 | 44.7 | 2000–2005 | 62.1 |
| 1970–1975 | 46.7 | 2005–2010 | 65.0 |
| 1975–1980 | 48.9 | 2010–2015 | 67.7 |
| 1980–1985 | 51.2 |
Source: UN World Population Prospects[14]
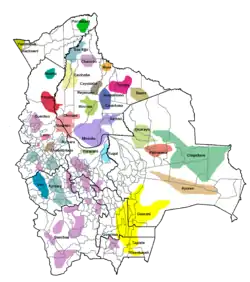
Ethnic groups
Languages
The official languages of Bolivia are Spanish[15] (60.7%), Quechua[15] (21.2%), Aymara[15] (14.6), and Guaraní[15] (0.6%), plus another 33 native languages.[15] Originally only Spanish, Aymara, and Quechua were the official languages until the 2009 Constitution was passed.[16][17] According to the 2001 census, 60.7% of the population over six years old are able to speak Spanish and/or speaks it as a native language.
Religion
In a 2012 Gallup poll, 87% answered affirmatively when asked "Is religion important in your daily life?"[18] Christianity is the largest religion in Bolivia, with Roman Catholicism being the largest denomination.[19]
Education
The literacy rate in Bolivia is 94.98%.[20]
Health
Healthcare expenditured comprised only 4.9% of the GDP.[6] According to the 2013 World Factbook, Bolivia ranks 161st in life expectancy with an average age of 68.2 years.[6] In 2009, the World Factbook estimated 12,000 people are living in Bolivia with HIV/AIDS (0.2%) and less than 1,000 of that population died from it.[6] In 2003, it was estimated by the World Health Organization (WHO) that 31.9% of the adult population (12–64) were smokers.[21] According to 2008 WHO data, 17.9% of the population is obese.[22] In 2011, there were 3,255 healthcare institutions, of which 1,134 are considered "first class" (medical personnel and registered nurses) by the Bolivian Ministry of Health Management.[23] The hospitals employed an estimated 10,000 medical doctors in 2001.[24]
In 2012, the causes of death in Bolivia were:[25]
|
|
Economic indicators
Personal income, jobs, and unemployment
The average monthly income in 2016 was estimated in 4,319 Bs. This was a substantial increase from the average monthly income in 1994 of Bs.1,378 ($293). [26] Since May 2019, the minimum wage in Bolivia is Bs.2,122 ($307) per month.[27] The unemployment rate in Bolivia in 2015 was 7.4%.[6] There are an estimated 4.7 million workers in Bolivia. Of that population, 48% are considered to be employed in services, 32% are industrial workers (mining, smelting, petroleum, food and beverages, tobacco, handicrafts, clothing, jewelry), and 32% are agricultural workers (soybeans, coffee, coca, cotton, corn, sugarcane, rice, potatoes; Brazil nuts; timber).[6] In comparison with other countries in South America, Bolivia's median equivalent household income in terms of the Purchasing Power Standard stands at $5,000, which ranks last in South America.[6]
Urbanization and housing
The 2012 census recorded a total of 3,158,691 households in Bolivia—an increase of 887,960 from 2001.[28] In 2009, 75.4% of homes were classified as a house, hut, or Pachuichi; 3.3% were apartments; 21.1% were rented out homes; and 0.1% were mobile homes.[29] The urbanization rate of Bolivia is 67%.[6]
Notes
- "Hitos En La Producción Estadística" [Milestones in Statistical Production] (in Spanish). National Institute of Statistics of Bolivia. 2 November 2011. Archived from the original on 20 January 2014. Retrieved 25 January 2014.
- "Censo en Bolivia se Inició en 1831" [Census in Bolivia Began in 1831]. La Opinión (in Spanish). 18 November 2012. Retrieved 19 January 2014.
- National Institute of Statistics of Bolivia 2012, p. 4
- "El Gobierno Realizará el Censo 2012 el 21 de Noviembre" [The Government will make the 2012 Census on 21 November]. Los Tiempos (in Spanish). 19 April 2013. Archived from the original on 1 February 2014. Retrieved 22 January 2014.
- "Censo 2012: Bolivia Tiene 10.389.913 habitantes" [Census 2012: Bolivia has 10,389,913 inhabitants]. Los Tiempos (in Spanish). 23 January 2013. Archived from the original on 1 February 2014. Retrieved 22 January 2014.
- "South American :: Bolivia". World Factbook. Central Intelligence Agency. Retrieved 21 January 2014.
- "World Population Prospects: The 2012 Revision". United Nations. Retrieved 19 January 2014.
- National Institute of Statistics of Bolivia 2012, p. 30
- "Bolivia: Número de Matrimonios Registrados, por Departamento" [Bolivia: Number of Marriage Registrations, by Department]. National Institute of Statistics of Bolivia. Archived from the original on 2 February 2014. Retrieved 23 January 2014.
- "En Bolivia Registran más de 16 Divorcios Diarios" [In Bolivia, Divorces Recorded more than 16 per Day]. La Razon (in Spanish). 28 September 2012. Retrieved 25 January 2014.
- http://unstats.un.org/unsd/demographic/products/dyb/dyb2.htm
- https://www.ine.gob.bo/index.php/censos-y-proyecciones-de-poblacion-sociales/
- http://microdata.worldbank.org/index.php/catalog/dhs#_r=&collection=&country=&dtype=&from=1890&page=2&ps=&sk=&sort_by=nation&sort_order=&to=2014&topic=&view=s&vk=
- "World Population Prospects – Population Division – United Nations". Retrieved 15 July 2017.
- "South America :: BOLIVIA". CIA The World Factbook.
- Arnade, Charles (14 March 2013). "Bolivia: Languages and Religion". Encyclopædia Britannica. Retrieved 20 January 2014.
- Political Constitution of the State - Article 5
- "Gallup World View". Gallup. Retrieved 23 February 2014.
- Religion affiliation in Bolivia as of 2018. Based on Latinobarómetro. Survey period: June 15 to August 2, 2018, 1,200 respondents.
- 2012 census
- "Bolivia: Smoking Prevalence" (PDF). World Health Organization. p. 1. Retrieved 21 January 2014.
- "Bolivia (Plurinational State of)" (PDF). World Health Organization. 2011. Retrieved 21 January 2014.
- "Según Diagnóstico: Bolivia Cuenta con 3.255 Centros de Salud" [According to Diagnosis: Bolivia has 3,255 Health Centers]. La Patria. 2 December 2012. Retrieved 22 January 2014.
- "Field Listing :: Physicians Density". The World Factbook. Central Intelligence Agency. 2001. Retrieved 23 January 2014. The number of 10,000 comes from the physician density (1.22/1,000 inhabitants) multiplied by the population (8,274,325) in 2001.
- "Diez eEnfermedades son Principales Causas de Mortalidad en el País" [Ten Diseases are Leading Causes of Mortality in the Country]. FM Bolivia (in Spanish). 20 July 2012. Archived from the original on 1 February 2014. Retrieved 23 January 2014.
- Israel 1994, p. 11
- "Bolivia MOF Announces Minimum Wage Increase". Bloomberg Tax. 3 May 2019. Retrieved 18 September 2019.
- National Institute of Statistics of Bolivia 2012, p. 16
- "Bolivia: Hogares por Tipo y Tenencia de la Vivienda, Según Área Geográfica, 2000 – 2009" [Bolivia: Households by Type and Tenure, According to Geographic Area, 2000 – 2009]. National Institute of Statistics of Bolivia. Archived from the original on 13 November 2013. Retrieved 28 January 2014.
References
- National Institute of Statistics of Bolivia (2012). "Bolivia Caracteristicas de Populacion y Vivienda: Censo Nacional de Populacion y Vivienda 2012" [Bolivia Characteristics of Population and Housing: National Censo of Population and Housing 2012] (PDF) (PDF) (in Spanish). Bolivian National Institute of Statistics. Archived from the original (PDF) on 9 February 2014. Retrieved 19 January 2014.
- Díaz-Domínguez, Alejandro (2009). "Nota Metodológica: Midiendo Religión en Encuestas de Latinoamérica" [Methodological Note: Measuring Religion Polls in Latin America] (PDF). Perspectivas desde el Barómetro de las Américas (PDF) (in Spanish) (29). Archived from the original (PDF) on 24 June 2010. Retrieved 19 January 2014.
- Israel, Debra (1994). "Impact of Increased Access and Price on Household Water Use in Urban Bolivia" (PDF) (PDF). Indiana State University. Retrieved 19 January 2014.
External links
- Indigenous Peoples distribution map - Bolivian Ministry of Health and Sports Virtual Public Health Library official website
