Ecological footprint
The ecological footprint is a method promoted by the Global Footprint Network to measure human demand on natural capital, i.e. the quantity of nature it takes to support people or an economy.[2][3][4] It tracks this demand through an ecological accounting system. The accounts contrast the biologically productive area people use for their consumption to the biologically productive area available within a region or the world (biocapacity, the productive area that can regenerate what people demand from nature). In short, it is a measure of human impact on the environment.
.svg.png.webp)
.svg.png.webp)
| −9 | −8 | −7 | −6 | −5 | −4 | −3 | −2 | −1 | 0 | 2 | 4 | 6 | 8 |
Footprint and biocapacity can be compared at the individual, regional, national or global scale. Both footprint and biocapacity change every year with number of people, per person consumption, efficiency of production, and productivity of ecosystems. At a global scale, footprint assessments show how big humanity's demand is compared to what Earth can renew. Global Footprint Network estimates that, as of 2014, humanity has been using natural capital 1.7 times as fast as Earth can renew it, which they describe as meaning humanity's ecological footprint corresponds to 1.7 planet Earths.[1][5]
Ecological footprint analysis is widely used around the world in support of sustainability assessments.[6] It enables people to measure and manage the use of resources throughout the economy and explore the sustainability of individual lifestyles, goods and services, organizations, industry sectors, neighborhoods, cities, regions and nations.[2]
Overview
The first academic publication about ecological footprints was by William Rees in 1992.[7] The ecological footprint concept and calculation method was developed as the PhD dissertation of Mathis Wackernagel, under Rees' supervision at the University of British Columbia in Vancouver, Canada, from 1990–1994.[8] Originally, Wackernagel and Rees called the concept "appropriated carrying capacity".[9] To make the idea more accessible, Rees came up with the term "ecological footprint", inspired by a computer technician who praised his new computer's "small footprint on the desk".[10] In 1996, Wackernagel and Rees published the book Our Ecological Footprint: Reducing Human Impact on the Earth.[11]
The simplest way to define ecological footprint is the amount of the environment necessary to produce the goods and services necessary to support a particular lifestyle.[12]
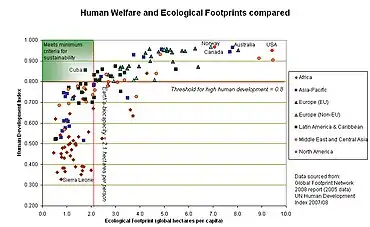
The model is a means of comparing consumption and lifestyles, and checking this against biocapacity. The tool can inform policy by examining to what extent a nation uses more (or less) than is available within its territory, or to what extent the nation's lifestyle would be replicable worldwide. The footprint can also be a useful tool to educate people about overconsumption, with the aim of altering personal behavior. Ecological footprints may be used to argue that many current lifestyles are not sustainable. Such a global comparison also clearly shows the inequalities of resource use on this planet.
The GHG footprint or the more narrow carbon footprint are a component of the ecological footprint. Often, when only the carbon footprint is reported, it is expressed in weight of CO
2 (or CO2e representing GHG warming potential (GGWP)), but it can also be expressed in land areas like ecological footprints. Both can be applied to products, people or whole societies.[13]
Methodology
The focus of ecological footprint accounting is renewable resources. The total amount of such resources which the planet produces according to this model has been dubbed biocapacity. Ecological footprints can be calculated at any scale: for an activity, a person, a community, a city, a town, a region, a nation, or humanity as a whole. Footprint values are categorized for carbon, food, housing, goods and services. This approach can be applied to an activity such as the manufacturing of a product or driving of a car. This resource accounting is similar to life-cycle analysis wherein the consumption of energy, biomass (food, fiber), building material, water and other resources are converted into a normalized measure of land area called global hectares (gha).
Since 2003, Global Footprint Network has calculated the ecological footprint from UN data sources for the world as a whole and for over 200 nations (known as the National Footprint Accounts). The total footprint number of Earths needed to sustain the world's population at that level of consumption are also calculated. Every year the calculations are updated to the latest year with complete UN statistics. The time series are also recalculated with every update since UN statistics sometimes correct historical data sets. Results are available on an open data platform.[1] Lin et al. (2018) finds that the trends for countries and the world have stayed consistent despite data updates.[5] Also, a recent study by the Swiss Ministry of Environment independently recalculated the Swiss trends and reproduced them within 1–4% for the time period that they studied (1996–2015).[14] Since 2006, a first set of ecological footprint standards exist that detail both communication and calculation procedures. The latest version are the updated standards from 2009.[15]
The ecological footprint accounting method at the national level is described on the website of Global Footprint Network[15] or in greater detail in academic papers, including Borucke et al.[16]
The National Accounts Review Committee has published a research agenda on how to improve the accounts.[17]
Footprint measurements
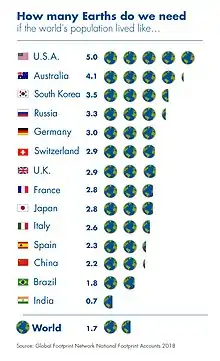
For 2014 Global Footprint Network estimated humanity's ecological footprint as 1.7 planet Earths. According to their calculations this means that humanity's demands were 1.7 times more than what the planet's ecosystems renewed.[1][5]
In 2007, the average biologically productive area per person worldwide was approximately 1.8 global hectares (gha) per capita. The U.S. footprint per capita was 9.0 gha, and that of Switzerland was 5.6 gha, while China's was 1.8 gha.[18][19] The WWF claims that the human footprint has exceeded the biocapacity (the available supply of natural resources) of the planet by 20%.[20] Wackernagel and Rees originally estimated that the available biological capacity for the 6 billion people on Earth at that time was about 1.3 hectares per person, which is smaller than the 1.8 global hectares published for 2006, because the initial studies neither used global hectares nor included bioproductive marine areas.[11]
.jpg.webp)
According to the 2018 edition of the National footprint accounts, humanity's total ecological footprint has exhibited an increasing trend since 1961, growing an average of 2.1% per year (SD= 1.9).[5] Humanity's ecological footprint was 7.0 billion gha in 1961 and increased to 20.6 billion gha in 2014.[5] The world-average ecological footprint in 2014 was 2.8 global hectares per person.[5] The carbon footprint is the fastest growing part of the ecological footprint and accounts currently for about 60% of humanity's total ecological footprint.[5]
The Earth's biocapacity has not increased at the same rate as the ecological footprint. The increase of biocapacity averaged at only 0.5% per year (SD = 0.7).[5] Because of agricultural intensification, biocapacity was at 9.6 billion gha in 1961 and grew to 12.2 billion gha in 2016.[5]
According to Wackernagel and his organisation, the Earth has been in "overshoot", where humanity is using more resources and generating waste at a pace that the ecosystem can't renew, since the 1970s.[5] In 2018, Earth Overshoot Day, the date where humanity has used more from nature than the planet can renew in the entire year, was estimated to be August 1.[22] Now more than 85% of humanity lives in countries that run an ecological deficit.[2]
According to Rees, "the average world citizen has an eco-footprint of about 2.7 global average hectares while there are only 2.1 global hectare of bioproductive land and water per capita on earth. This means that humanity has already overshot global biocapacity by 30% and now lives unsustainabily by depleting stocks of 'natural capital'."[23]
Footprint by country
The world-average ecological footprint in 2013 was 2.8 global hectares per person.[5] The average per country ranges from over 10 to under 1 global hectares per person. There is also a high variation within countries, based on individual lifestyle and economic possibilities.[2]
The Western Australian government State of the Environment Report included an Ecological Footprint measure for the average Western Australian seven times the average footprint per person on the planet in 2007, a total of about 15 hectares.[24]
Studies in the United Kingdom
The UK's average ecological footprint is 5.45 global hectares per capita (gha) with variations between regions ranging from 4.80 gha (Wales) to 5.56 gha (East England).[19]
BedZED, a 96-home mixed-income housing development in South London, was designed by Bill Dunster Architects and sustainability consultants BioRegional for the Peabody Trust. Despite being populated by relatively average people, BedZED was found to have a footprint of 3.20 gha (not including visitors), due to on-site renewable energy production, energy-efficient architecture, and an extensive green lifestyles program that included London's first carsharing club. Findhorn Ecovillage, a rural intentional community in Moray, Scotland, had a total footprint of 2.56 gha, including both the many guests and visitors who travel to the community. However, the residents alone had a footprint of 2.71 gha, a little over half the UK national average and one of the lowest ecological footprints of any community measured so far in the industrialized world.[25][26] Keveral Farm, an organic farming community in Cornwall, was found to have a footprint of 2.4 gha, though with substantial differences in footprints among community members.[27]
Ecological footprint at the individual level
In a 2012 study of consumers acting 'green' vs. 'brown' (where green people are "expected to have significantly lower ecological impact than 'brown' consumers"), the conclusion was "the research found no significant difference between the carbon footprints of green and brown consumers".[28][29] A 2013 study concluded the same.[30][31]
Reviews and critiques
Early criticism was published by van den Bergh and Verbruggen in 1999,[32] which was updated in 2014.[33] Their colleague Fiala published similar criticism in 2008.[34]
A comprehensive review commissioned by the Directorate-General for the Environment (European Commission) was published in June 2008. The European Commission's review found the concept unique and useful for assessing progress on the EU’s Resource Strategy. They also recommended further improvements in data quality, methodologies and assumptions.[35]
Blomqvist et al.[36] published a critical paper in 2013. It lead to a reply from Rees and Wackernagel (2013),[37] and a rejoinder by Blomqvist et al. (2013).[38]
An additional strand of critique is from Giampietro and Saltelli (2014),[39] with a reply from Goldfinger et al., 2014,[40] and a rejoinder by Giampietro and Saltelli (2014).[41] A joint paper authored by the critical researchers (Giampietro and Saltelli) and proponents (various Global Footprint Network researchers) summarised the terms of the controversy in a paper published by the journal Ecological indicators.[42] Additional comments were offered by van den Bergh and Grazi (2015).[43]
A number of national government agencies have performed collaborative or independent research to test the validity of the ecological footprint accounting method and its results.[44] They have largely confirmed the accounts' results; those who reproduced the assessment generating near-identical results. Such reviews include those of Switzerland,[45] [46] Germany,[47] France,[48] Ireland,[49] the United Arab Emirates[50] and the European Commission.[51][52]
Global Footprint Network has summarized methodological limitations and criticism in a comprehensive report available on its website.[53]
Some researchers have misinterpreted ecological footprint accounting as a social theory or a policy guideline, while in reality it is merely a metric that adds up human demands that compete for the planet's regenerative capacity. Examples of such confusions include Grazi et al. (2007) who performed a systematic comparison of the ecological footprint method with spatial welfare analysis that includes environmental externalities, agglomeration effects and trade advantages. Not recognizing that the ecological footprint is merely a metric, they conclude that the footprint method does not lead to maximum social welfare.[54] Similarly, Newman (2006) has argued that the ecological footprint concept may have an anti-urban bias, as it does not consider the opportunities created by urban growth.[55] He argues that calculating the ecological footprint for densely populated areas, such as a city or small country with a comparatively large population — e.g. New York and Singapore respectively — may lead to the perception of these populations as "parasitic". But in reality, ecological footprints just document the resource dependence of cities - like a fuel gauge documents a car's fuel availability. Newman questions the metric because these communities have little intrinsic biocapacity, and instead must rely upon large hinterlands. Critics argue that this is a dubious characterization since farmers in developed nations may easily consume more resources than urban inhabitants, due to transportation requirements and the unavailability of economies of scale. Furthermore, such moral conclusions seem to be an argument for autarky. This is similar to blaming a scale for the user's dietary choices. Some even take this train of thought a step further, claiming that the footprint denies the benefits of trade. Therefore such critics argue that the footprint can only be applied globally.[56] Others have made the opposite argument showing that national assessments do provide helpful insights.[57]
Since this metric tracks biocapacity, the replacement of original ecosystems with high-productivity agricultural monocultures can lead to attributing a higher biocapacity to such regions. For example, replacing ancient woodlands or tropical forests with monoculture forests or plantations may therefore decrease the ecological footprint. Similarly if organic farming yields were lower than those of conventional methods, this could result in the former being "penalized" with a larger ecological footprint.[58] Complementary biodiversity indicators attempt to address this. The WWF's Living Planet Report combines the footprint calculations with the Living Planet Index of biodiversity.[59] A modified ecological footprint that takes biodiversity into account has been created for use in Australia.[60]
See also
- Carbon footprint
- Dependency theory
- Earth Overshoot Day formerly also called Ecological Debt Day
- Ecological economics
- Ecosystem valuation
- Environmental impact assessment
- Greenhouse debt
- Greenhouse gas emissions accounting
- Happy Planet Index
- Life cycle assessment
- List of countries by ecological footprint
- Netherlands fallacy
- Our Common Future
- Overshoot (population)
- Physical balance of trade
- Simon–Ehrlich wager
- Social metabolism
- The Limits to Growth
- Water footprint
References
- "Home page". footprintnetwork.org. Global Footprint Network. Retrieved 2018-10-10.
- "Ecological Footprint: Overview". footprintnetwork.org. Global Footprint Network. Retrieved 16 April 2017.
- Wackernagel, Mathis; Lin, David; Evans, Mikel; Hanscom, Laurel; Raven, Peter (2019). "Defying the Footprint Oracle: Implications of Country Resource Trends". Sustainability. 11 (7): 2164. doi:10.3390/su11072164.
- Yasin, Iftikhar; Ahmad, Nawaz; Chaudhary, M. Aslam (2019-07-22). "Catechizing the Environmental-Impression of Urbanization, Financial Development, and Political Institutions: A Circumstance of Ecological Footprints in 110 Developed and Less-Developed Countries". Social Indicators Research. doi:10.1007/s11205-019-02163-3. ISSN 0303-8300.
- Lin, D; Hanscom, L; Murthy, A; Galli, A; Evans, M; Neill, E; Mancini, MS; Martindill, J; Medouar, F-Z; Huang, S; Wackernagel, M. (2018). "Ecological Footprint Accounting for Countries: Updates and Results of the National Footprint Accounts, 2012–2018". Resources. 7(3): 58. https://doi.org/10.3390/resources7030058
- Lyndhurst, Brook (June 2003). "London's Ecological Footprint A review" (PDF). Mayor of London. Greater London Authority (commissioned by GLA Economics).
- Rees, William E. (October 1992). "Ecological footprints and appropriated carrying capacity: what urban economics leaves out". Environment & Urbanization. 4 (2): 121–130. doi:10.1177/095624789200400212.
- Wackernagel, M. (1994). Ecological Footprint and Appropriated Carrying Capacity: A Tool for Planning Toward Sustainability (PDF) (PhD thesis). Vancouver, Canada: School of Community and Regional Planning. The University of British Columbia. OCLC 41839429.
- Wackernagel, Mathis, 1991. "Land Use: Measuring a Community's Appropriated Carrying Capacity as an Indicator for Sustainability"; and "Using Appropriated Carrying Capacity as an Indicator, Measuring the Sustainability of a Community." Report I & II to the UBC Task Force on Healthy and Sustainable Communities, Vancouver.
- William Safire, On Language: Footprint, New York Times Magazine, February 17, 2008
- Wackernagel, M. and W. Rees. 1996. Our Ecological Footprint: Reducing Human Impact on the Earth. Gabriola Island, BC: New Society Publishers. ISBN 0-86571-312-X.
- "Ecological Footprint". WWF. Retrieved 11 May 2020.
- Benn, Hilary; Milliband, Ed. "Guidance on how to measure and report your greenhouse gas emissions" (PDF). GOV.UK. Department for Environment, Food and Rural Affairs (UK). Retrieved 9 November 2016.
- Environmental Footprints of Switzerland. Federal Office for the Environment. 2018. p. 87.
- "Data". footprintnetwork.org. Global Footprint Network. Retrieved 16 July 2018.
- Borucke, M; Moore, D; Cranston, G; Gracey, K; Lazarus, E; Morales, J.C.; Wackernagel, M. (2013). "Accounting for demand and supply of the biosphere's regenerative capacity: The National Footprint Accounts' underlying methodology and framework". Ecological Indicators. 24: 518–533. doi:10.1016/j.ecolind.2012.08.005.
- A Research Agenda for Improving National Ecological Footprint Accounts Retrieved: 2007-11-11 Archived November 28, 2007, at the Wayback Machine
- or Archived 2009-01-29 at the Wayback Machine Living Planet Report 2008 outlines scenarios for humanity's future. Global Footprint Network. Retrieved: 2009-02-15
- Chambers, N. et al. (2004) Scotland’s Footprint. Best Foot Forward. ISBN 0-9546042-0-2.
- Global ecosystems 'face collapse' BBC News. Retrieved: 2007-05-18.
- "Sustainable Development: Sustainable development is successful only when it improves citizens' well-being without degrading the environment". footprintnetwork.org. Global Footprint Network.
- "Earth Overshoot Day". footprintnetwork.org. Global Footprint Network.
- Rees, William E. (30 August 2011). "The Human Nature of Unsustainability". postcarbon.org. Post Carbon Institute. Retrieved 29 July 2016.
- Report identifies population and consumption as an environmental priority Archived 2016-10-18 at the Wayback Machine, accessed 6 March 2016.
- Findhorn eco-footprint is ‘world’s smallest’ Archived 2009-01-23 at the Wayback Machine Sunday Herald, August 11, 2008.
- Tinsley, S. and George, H. (2006) Ecological Footprint of the Findhorn Foundation and Community. Moray. Sustainable Development Research Centre, UHI Millennium Institute.
- Radical Routes (2006) How to work out your Ecological Footprint. Leeds. Radical Routes.
- Alden Wicker (1 March 2017). "Conscious consumerism is a lie. Here's a better way to help save the world". Quartz. Retrieved 13 February 2018.
A 2012 study compared footprints of “green” consumers who try to make eco-friendly choices to the footprints of regular consumers. And they found no meaningful difference between the two.
- Csutora, M. "The ecological footprint of green and brown consumers. Introducing the behaviour-impact-gap (BIG) problem" (PDF). European Round Table on Sustainable Consumption and Production (ERSCP) 2012. 15th European Roundtable on Sustainable Consumption and Production. Retrieved 13 February 2018.
The research found no significant difference between the carbon footprints of green and brown consumers suggesting that individual environmental behaviour does not always modify consumption patterns significantly.
- David Roberts (1 December 2017). "Wealthier people produce more carbon pollution — even the "green" ones". Vox. Retrieved 13 February 2018.
Environmental identity will lead to some relatively low-impact (high-signaling) pro-environmental behaviors, but it rarely drives serious reductions in the biggest sources of lifestyle emissions. Environmental self-identification rises with income, but so do emissions. (A 2012 study and a 2013 study, both based on a survey in Hungary, found roughly the same thing.)
- Tabi, Andrea (2013). "Does pro-environmental behaviour affect carbon emissions?". Energy Policy. 63: 972–981. doi:10.1016/j.enpol.2013.08.049.
no significant difference is found between the impacts of environmentally aware and environmentally unaware consumers, i.e. both ‘Brown’ and ‘Supergreen’ consumers consume approximately the same amount of energy and produce approximately the same amount of carbon emissions
- J.C.J.M. van den Bergh; H. Verbruggen (1999). "Spatial sustainability, trade and indicators: an evaluation of the 'ecological footprint'" (PDF). Ecological Economics. 29 (1): 63–74. doi:10.1016/s0921-8009(99)00032-4. Archived from the original (PDF) on 2007-10-09. Archived 2010-06-27 at the Wayback Machine
- van den Bergh, Jeroen C.J.M; Grazi, Fabio (2014). "Ecological Footprint Policy? Land Use as an Environmental Indicator". Journal of Industrial Ecology. 18 (1): 10–19. doi:10.1111/jiec.12045. ISSN 1088-1980.
- Fiala, N. (2008). "Measuring sustainability: Why the ecological footprint is bad economics and bad environmental science". Ecological Economics. 67 (4): 519–525. doi:10.1016/j.ecolecon.2008.07.023.
- Analysis of the potential of the Ecological Footprint and related assessment tools for use in the EU’s Thematic Strategy on the Sustainable Use of Natural Resources is available at: http://ec.europa.eu/environment/natres/studies.htm
- Blomqvist, L.; Brook, B.W.; Ellis, E.C.; Kareiva, P.M.; Nordhaus, T.; Shellenberger, M. (2013). "Does the shoe fit? Real versus imagined ecological footprints". PLoS Biology. 11 (11): e1001700. doi:10.1371/journal.pbio.1001700. PMC 3818165. PMID 24223517.
- Rees, W.E.; Wackernagel, M. (2013). "The Shoe Fits, but the Footprint is Larger than Earth". PLoS Biology. 11 (11): e1001701. doi:10.1371/journal.pbio.1001701. PMC 3818166. PMID 24223518.
- Blomqvist, L.; Brook, B.W.; Ellis, E.C.; Kareiva, P.M.; Nordhaus, T.; et al. (2013b). "The ecological footprint remains a misleading metric of global sustainability". PLoS Biology. 11 (11): e1001702. doi:10.1371/journal.pbio.1001702. PMC 3818167. PMID 24223519.
- Giampietro, M. Saltelli A. (2014a): Footprint to nowhere, Ecological Indicators 46: 610–621.
- Goldfinger; Wackernagel, S. M.; Galli, A.; Lazarus, E.; Lin, D. (2014). "Footprint facts and fallacies: A response to Giampietro and Saltelli (2014) "Footprints to Nowhere"". Ecological Indicators. 46: 622–632. doi:10.1016/j.ecolind.2014.04.025.
- Giampietro, M.; Saltelli, A.; et al. (2014b). "Footworking in circles: Reply to Goldfinger et al. (2014) "Footprint Facts and Fallacies: A Response to Giampietro and Saltelli (2014) Footprints to nowhere"". Ecological Indicators. 46: 260–263. doi:10.1016/j.ecolind.2014.06.019.
- Alessandro Galli , Mario Giampietro , Steve Goldfinger , Elias Lazarus , David Lin , Andrea Saltelli , Matthis Wackernagel , Felix Müller, 2016, Questioning the ecological footprint , Ecological Indicators, 69, 224–232.
- Van; den Bergh, J.; Grazi, Fabio (2015). "Reply to the first systematic response by the Global Footprint Network to criticism: A real debate finally?". Ecological Indicators. 58: 458–463. doi:10.1016/j.ecolind.2015.05.007.
- Global Footprint Network's website links to those studies on their website https://www.footprintnetwork.org/reviews
- Switzerland's ecological footprint: A contribution to the sustainability debate https://www.bfs.admin.ch/bfs/en/home/statistics/catalogues-databases/publications.assetdetail.343230.html (technical and descriptive report)
- BAFU (Federal Office for the Environment). 2018. Umwelt-Fussabdrücke der Schweiz (Environmental Footprints of Switzerland). Bundesamt für Umwelt BAFU, Bern. https://www.bafu.admin.ch/bafu/de/home/themen/wirtschaft-konsum/publikationen-studien/publikationen/umwelt-fussabdruecke-der-schweiz.html
- http://www.umweltdaten.de/publikationen/fpdf-l/3489.pdf Archived 2011-06-10 at the Wayback Machine
- Une expertise de l'empreinte écologique, Edité par COMMISSARIAT GENERAL AU DEVELOPPEMENT DURABLE - SERVICE DE L'OBSERVATION ET DES STATISTIQUES. Orléans - 2010 https://side.developpement-durable.gouv.fr/Default/doc/SYRACUSE/202277
- http://erc.epa.ie/safer/iso19115/displayISO19115.jsp?isoID=56#files
- United Arab Emirates – Al Basama Al Beeiya Initiative http://www.agedi.ae/ecofootprintuae/default.aspx Archived 2010-05-28 at the Wayback Machine
- Eurostat – http://epp.eurostat.ec.europa.eu/cache/ITY_OFFPUB/KS-AU-06-001/EN/KS-AU-06-001-EN.PDF Archived 2011-04-09 at the Wayback Machine
- DG Environment – June 2008: "Potential of the Ecological Footprint for monitoring environmental impact from natural resource use" http://ec.europa.eu/environment/natres/studies.htm
- Global Footprint Network - Limitations and Criticism. https://www.footprintnetwork.org/our-work/ecological-footprint/limitations-and-criticisms/ This page also links to a 50 page guidebook to criticisms.
- F. Grazi; J.C.J.M. van den Bergh; P. Rietveld (2007). "Welfare economics versus ecological footprint: modeling agglomeration, externalities and trade" (PDF). Environmental and Resource Economics. 38 (1): 135–153. doi:10.1007/s10640-006-9067-2. hdl:1871/23693.
- Newman, Peter (October 2006). "The environmental impact of cities". Environment and Urbanization. 18 (2): 275–295. doi:10.1177/0956247806069599. ISSN 0956-2478.
- "Planning and Markets: Peter Gordon and Harry W. Richardson". Pam.usc.edu. Archived from the original on 2010-06-27. Retrieved 2012-11-08.
- Wackernagel, Mathis; Lin, David; Evans, Mikel; Hanscom, Laurel; Raven, Peter. 2019. "Defying the Footprint Oracle: Implications of Country Resource Trends." Sustainability 2019, 11(7), 2164; https://doi.org/10.3390/su11072164, https://www.mdpi.com/2071-1050/11/7/2164/htm
- Lenzen, M., C. Borgstrom Hansson and S. Bond (2006) On the bioproductivity and land-disturbance metrics of the Ecological Footprint. University of Sydney, ISA Research Paper, June, 06, in collaboration with WWF. Retrieved: 2007-06-04.
- Loh, J., R. Green, T. Ricketts, J. Lamoreux, M. Jenkins, V. Kapos and J. Randers (2005). "The Living Planet Index: using species population time series to track trends in biodiversity" (PDF). Philosophical Transactions of the Royal Society. 360 (1454): 289–295. doi:10.1098/rstb.2004.1584. PMC 1569448. PMID 15814346.CS1 maint: multiple names: authors list (link)
- Lenzen, Manfred; Murray Shauna A. (2001). "A modified ecological footprint method and its application to Australia". Ecological Economics. 37 (2): 229–255. doi:10.1016/S0921-8009(00)00275-5.
Further reading
- Rees, W. E. and M. Wackernagel (1994) Ecological footprints and appropriated carrying capacity: Measuring the natural capital requirements of the human economy, in Jansson, A. et al.. Investing in Natural Capital: The Ecological Economics Approach to Sustainability. Washington D.C.:Island Press. ISBN 1-55963-316-6
- Wackernagel, M; Schulz, NB; Deumling, D; Linares, AC; Jenkins, M; Kapos, V; Monfreda, C; Loh, J; et al. (2002). "Tracking the ecological overshoot of the human economy". Proc. Natl. Acad. Sci. U.S.A. 99 (14): 9266–71. Bibcode:2002PNAS...99.9266W. doi:10.1073/pnas.142033699. PMC 123129. PMID 12089326.
- Lenzen, M. and Murray, S. A. 2003. The Ecological Footprint – Issues and Trends. ISA Research Paper 01-03
- Chambers, N., Simmons, C. and Wackernagel, M. (2000), Sharing Nature's Interest: Ecological Footprints as an Indicator of Sustainability. Earthscan, London ISBN 1-85383-739-3 (see also http://www.ecologicalfootprint.com)
- Raudsepp-Hearne C, Peterson GD, Tengö M, Bennett EM, Holland T, Benessaiah K, MacDonald GM, Pfeifer L (2010). "Untangling the Environmentalist's Paradox: Why is Human Well-Being Increasing as Ecosystem Services Degrade?". BioScience. 60 (8): 576–589. doi:10.1525/bio.2010.60.8.4.
- Ohl, B.; Wolf, S.; & Anderson, W. (2008). "A modest proposal: global rationalization of ecological footprint to eliminate ecological debt". Sustainability: Science, Practice, & Policy. 4 (1): 5–16. doi:10.1080/15487733.2008.11908010. Archived from the original on 2009-01-24. Retrieved 2009-03-11.
External links
- WWF "Living Planet Report", a biannual calculation of national and global footprints
- GreenScore City Index, a quarterly calculation of city footprints in Canada
- US Environmental Footprint Factsheet
- Interview with Bill Rees
| Fields |  | |
|---|---|---|
| Related |
| |
| Applied |
| |