Edinburgh North (UK Parliament constituency)
Edinburgh North was a burgh constituency of the House of Commons of the Parliament of the United Kingdom from 1918 to 1983. It elected one Member of Parliament (MP) using the first-past-the-post voting system.
| Edinburgh North | |
|---|---|
| Former Burgh constituency for the House of Commons | |
| Major settlements | Edinburgh |
| 1918–1983 | |
| Number of members | One |
| Replaced by | Edinburgh Central, Edinburgh Leith, Edinburgh East and Edinburgh West[1] |
| Created from | Edinburgh Central, Edinburgh West and Leith Burghs |
Boundaries
In 1918 the constituency consisted of the "Broughton, Calton, St. Andrew's and St. Stephen's Municipal Wards of Edinburgh."
Members of Parliament
Election results
Elections in the 1910s
| Party | Candidate | Votes | % | ±% | |
|---|---|---|---|---|---|
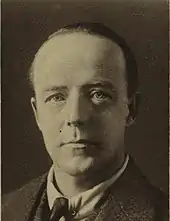
| C | Unionist | Rt Hon. James Avon Clyde | 11,879 | 63.0 | |
| Liberal | James Johnston | 6,986 | 37.0 | ||
| Majority | 4,893 | 26.0 | |||
| Turnout | 18,865 | 53.0 | |||
| Unionist win | |||||
| C indicates candidate endorsed by the coalition government. | |||||
Elections in the 1920s

Runciman
| Party | Candidate | Votes | % | ±% | |
|---|---|---|---|---|---|
| Unionist | Patrick Johnstone Ford | 9,944 | 44.8 | -18.2 | |
| Liberal | Rt Hon. Walter Runciman | 8,469 | 38.1 | +1.1 | |
| Labour | David Graham Pole | 3,808 | 17.1 | New | |
| Majority | 1,475 | 6.7 | -19.3 | ||
| Turnout | 22,221 | 62.3 | +9.3 | ||
| Unionist hold | Swing | -9.7 | |||
| Party | Candidate | Votes | % | ±% | |
|---|---|---|---|---|---|
| Unionist | Patrick Johnstone Ford | 14,805 | 61.8 | +17.0 | |
| Liberal | P. H. Allan | 9,165 | 38.2 | +0.1 | |
| Majority | 5,640 | 23.6 | +16.9 | ||
| Turnout | 23,970 | ||||
| Unionist hold | Swing | +8.4 | |||
| Party | Candidate | Votes | % | ±% | |
|---|---|---|---|---|---|
| Liberal | Peter Wilson Raffan | 13,744 | 55.7 | +17.5 | |
| Unionist | Patrick Johnstone Ford | 10,909 | 44.3 | -17.5 | |
| Majority | 2,835 | 11.4 | N/A | ||
| Turnout | 24,653 | 66.3 | |||
| Liberal gain from Unionist | Swing | +17.5 | |||

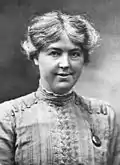
Stewart
| Party | Candidate | Votes | % | ±% | |
|---|---|---|---|---|---|
| Unionist | Patrick Johnstone Ford | 14,461 | 49.3 | +5.0 | |
| Labour | Eleanor Stewart | 8,192 | 27.9 | New | |
| Liberal | Peter Wilson Raffan | 6,669 | 22.7 | -33.0 | |
| Majority | 6,269 | 21.4 | N/A | ||
| Turnout | 29,322 | 78.0 | +11.7 | ||
| Unionist gain from Liberal | Swing | N/A | |||
| Party | Candidate | Votes | % | ±% | |
|---|---|---|---|---|---|
| Unionist | Sir Patrick Johnstone Ford | 13,993 | 39.7 | -9.6 | |
| Labour | Eleanor Stewart | 11,340 | 32.2 | +4.3 | |
| Liberal | William Mitchell | 9,877 | 28.1 | +5.4 | |
| Majority | 2,653 | 7.5 | -13.9 | ||
| Turnout | 35,210 | 73.8 | -4.2 | ||
| Unionist hold | Swing | -6.9 | |||
Elections in the 1930s
| Party | Candidate | Votes | % | ±% | |
|---|---|---|---|---|---|
| Unionist | Sir Patrick Johnstone Ford | 26,361 | 75.03 | +35.3 | |
| Labour | Robert Gibson | 8,771 | 24.97 | -7.2 | |
| Majority | 17,590 | 50.06 | +42.5 | ||
| Turnout | 35,132 | 74.38 | +0.60 | ||
| Registered electors | 47,234 | ||||
| Unionist hold | Swing | +19.05 | |||

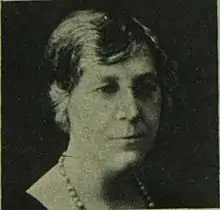
Chrystal Macmillan
| Party | Candidate | Votes | % | ±% | |
|---|---|---|---|---|---|
| Unionist | Alexander Galloway Erskine Erskine-Hill | 20,776 | 66.53 | -8.50 | |
| Labour | Gerald Walker Crawford | 8,654 | 27.71 | +2.74 | |
| Liberal | Jessie Chrystal Macmillan | 1,798 | 5.76 | New | |
| Majority | 12,122 | 38.82 | -11.26 | ||
| Turnout | 31,228 | 66.75 | -7.63 | ||
| Registered electors | 46,786 | ||||
| Unionist hold | Swing | -5.62 | |||
Elections in the 1940s
General Election 1939/40:
Another General Election was required to take place before the end of 1940. The political parties had been making preparations for an election to take place from 1939 and by the end of this year, the following candidates had been selected;
- Unionist: Alexander Erskine-Hill
- Labour: Gerald Walker Crawford
| Party | Candidate | Votes | % | ±% | |
|---|---|---|---|---|---|
| Labour | Eustace George Willis | 12,825 | 45.10 | +17.39 | |
| Unionist | Sir Alexander Galloway Erskine Erskine-Hill | 12,270 | 43.14 | -23.39 | |
| Liberal | Charles Hampton Johnston | 3,344 | 11.76 | +6.0 | |
| Majority | 555 | 1.96 | New | ||
| Turnout | 28,439 | 64.75 | -2.00 | ||
| Registered electors | 43,921 | ||||
| Labour gain from Unionist | Swing | +20.39 | |||
Elections in the 1950s
| Party | Candidate | Votes | % | ±% | |
|---|---|---|---|---|---|
| Unionist | James Latham McDiarmid Clyde | 17,826 | 51.21 | +8.07 | |
| Labour | Eustace George Willis | 13,683 | 39.31 | -5.79 | |
| Liberal | Iain Padruig Crawford | 3,303 | 9.49 | -2.27 | |
| Majority | 4,143 | 11.90 | N/A | ||
| Turnout | 34,812 | 78.71 | +13.96 | ||
| Registered electors | 44,226 | ||||
| Unionist gain from Labour | Swing | +6.93 | |||
| Party | Candidate | Votes | % | ±% | |
|---|---|---|---|---|---|
| Unionist | James Latham McDiarmid Clyde | 20,836 | 58.79 | +7.58 | |
| Labour | Eustace George Willis | 14,604 | 41.21 | +1.90 | |
| Majority | 6,232 | 17.58 | +5.68 | ||
| Turnout | 35,440 | 80.01 | +1.30 | ||
| Registered electors | 44,294 | ||||
| Unionist hold | Swing | +2.84 | |||
| Party | Candidate | Votes | % | ±% | |
|---|---|---|---|---|---|
| Unionist | William Rankine Milligan | 11,413 | 59.41 | +0.62 | |
| Labour | George Scott | 7,799 | 40.59 | -0.62 | |
| Majority | 3,614 | 18.82 | +1.24 | ||
| Turnout | 19,212 | ||||
| Unionist hold | Swing | ||||
| Party | Candidate | Votes | % | ±% | |
|---|---|---|---|---|---|
| Unionist | William Rankine Milligan | 20,425 | 61.73 | +2.94 | |
| Labour | George Scott | 12,664 | 38.27 | -2.94 | |
| Majority | 7,761 | 23.46 | +5.88 | ||
| Turnout | 33,089 | 72.01 | -8.00 | ||
| Registered electors | 45,952 | ||||
| Unionist hold | Swing | +2.94 | |||
| Party | Candidate | Votes | % | ±% | |
|---|---|---|---|---|---|
| Unionist | William Rankine Milligan | 19,991 | 64.02 | +2.29 | |
| Labour | George Gordon Stott | 11,235 | 35.98 | -2.29 | |
| Majority | 8,756 | 28.04 | +4.59 | ||
| Turnout | 31,226 | 73.87 | +1.86 | ||
| Registered electors | 42,270 | ||||
| Unionist hold | Swing | +2.29 | |||
Elections in the 1960s
| Party | Candidate | Votes | % | ±% | |
|---|---|---|---|---|---|
| Unionist | Walter Francis John Montagu Douglas Scott, Lord Dalkeith | 12,109 | 54.20 | -9.82 | |
| Labour | Ronald King Murray | 6,775 | 30.32 | -5.66 | |
| Liberal | Richard McPake | 3,458 | 15.50 | n/a | |
| Majority | 5,334 | 23.87 | -4.17 | ||
| Turnout | 22,342 | 53.1 | -20.8 | ||
| Unionist hold | Swing | -2.05 | |||
| Party | Candidate | Votes | % | ±% | |
|---|---|---|---|---|---|
| Unionist | Walter Francis John Montagu Douglas Scott, Lord Dalkeith | 17,094 | 58.23 | -5.79 | |
| Labour | Alexander D Reid | 12,264 | 41.77 | +5.79 | |
| Majority | 4,830 | 16.46 | -11.58 | ||
| Turnout | 29,358 | 73.60 | -0.27 | ||
| Registered electors | 39,888 | ||||
| Unionist hold | Swing | -5.79 | |||
| Party | Candidate | Votes | % | ±% | |
|---|---|---|---|---|---|
| Conservative | Walter Francis John Montagu Douglas Scott, Lord Dalkeith | 13,765 | 50.30 | -7.93 | |
| Labour | Walter S Dalgleish | 10,730 | 39.21 | -2.56 | |
| Liberal | Lawrence W Oliver | 2,871 | 10.49 | New | |
| Majority | 3,035 | 11.09 | -5.36 | ||
| Turnout | 27,366 | 73.85 | +0.25 | ||
| Registered electors | 37,056 | ||||
| Conservative hold | Swing | -2.69 | |||
Elections in the 1970s
| Party | Candidate | Votes | % | ±% | |
|---|---|---|---|---|---|
| Conservative | John Scott, 9th Duke of Buccleuch | 13,005 | 52.85 | +2.55 | |
| Labour | Robert Finlayson Cook | 9,127 | 37.09 | -2.12 | |
| Liberal | C Alistair Dow | 2,475 | 10.06 | -0.43 | |
| Majority | 3,878 | 15.76 | +4.67 | ||
| Turnout | 24,607 | 70.05 | -3.80 | ||
| Registered electors | 35,128 | ||||
| Conservative hold | Swing | +2.34 | |||
| Party | Candidate | Votes | % | ±% | |
|---|---|---|---|---|---|
| Conservative | Alexander MacPherson Fletcher | 7,208 | 38.69 | -14.16 | |
| Labour | Robert Cairns | 4,467 | 23.98 | -13.11 | |
| SNP | William Cuthbertson Wolfe | 3,526 | 19.11 | New | |
| Liberal | Ronald Guild | 3,431 | 18.42 | +8.36 | |
| Majority | 2,741 | 14.71 | -1.05 | ||
| Turnout | 18,632 | ||||
| Conservative hold | Swing | ||||
| Party | Candidate | Votes | % | ±% | |
|---|---|---|---|---|---|
| Conservative | Alexander MacPhershon Fletcher | 16,417 | 45.78 | -7.07 | |
| Labour | Robert Cairns | 9,404 | 26.23 | -10.86 | |
| Liberal | Ronald Harrower Guild | 5,487 | 15.30 | +5.24 | |
| SNP | James Lynch | 4,550 | 12.69 | N/A | |
| Majority | 7,013 | 19.56 | +3.80 | ||
| Turnout | 35,858 | 76.40 | +6.35 | ||
| Registered electors | 46,936 | ||||
| Conservative hold | Swing | +1.90 | |||
| Party | Candidate | Votes | % | ±% | |
|---|---|---|---|---|---|
| Conservative | Alexander MacPhershon Fletcher | 12,856 | 39.34 | -6.44 | |
| Labour | Martin John O'Neill | 8,465 | 25.90 | -0.32 | |
| SNP | James Lynch | 7,681 | 23.50 | +10.82 | |
| Liberal | Murdoch MacDonald | 3,677 | 11.25 | -4.05 | |
| Majority | 4,391 | 13.44 | -6.12 | ||
| Turnout | 32,679 | 69.21 | -7.19 | ||
| Registered electors | 47,215 | ||||
| Conservative hold | Swing | -3.06 | |||
| Party | Candidate | Votes | % | ±% | |
|---|---|---|---|---|---|
| Conservative | Alexander MacPhershon Fletcher | 14,170 | 43.59 | +4.25 | |
| Labour | Neil Lindsay | 9,773 | 30.06 | +4.16 | |
| Liberal | Ronald Harrower Guild | 5,045 | 15.52 | +4.27 | |
| SNP | Donald Neil MacCormick | 3,521 | 10.83 | -12.67 | |
| Majority | 4,397 | 13.53 | +0.09 | ||
| Turnout | 32,509 | 71.76 | +2.55 | ||
| Registered electors | 45,303 | ||||
| Conservative hold | Swing | +0.04 | |||
References
- "'Edinburgh North', Feb 1974 - May 1983". ElectionWeb Project. Cognitive Computing Limited. Retrieved 22 March 2016.
- Leigh Rayment's Historical List of MPs – Constituencies beginning with "E" (part 1)
- Craig, F. W. S. (1983). British parliamentary election results 1918-1949 (3 ed.). Chichester: Parliamentary Research Services. ISBN 0-900178-06-X.
- Kimber, Richard. "UK General Election results 1931". Political Science Resources. Archived from the original on 10 March 2015. Retrieved 14 April 2016.
- Kimber, Richard. "UK General Election results 1935". Political Science Resources. Archived from the original on 9 March 2015. Retrieved 14 April 2016.
- Kimber, Richard. "UK General Election results 1945". Political Science Resources. Archived from the original on 11 August 2011. Retrieved 14 April 2016.
- Kimber, Richard. "UK General Election results 1950". Political Science Resources. Archived from the original on 11 August 2011. Retrieved 14 April 2016.
- Kimber, Richard. "UK General Election results 1951". Political Science Resources. Archived from the original on 24 September 2015. Retrieved 14 April 2016.
- British Parliament by-election: 1955
- Kimber, Richard. "UK General Election results 1955". Political Science Resources. Archived from the original on 24 September 2015. Retrieved 14 April 2016.
- Kimber, Richard. "UK General Election results 1959". Political Science Resources. Archived from the original on 24 September 2015. Retrieved 14 April 2016.
- The Times, 20 May 1960
- Kimber, Richard. "UK General Election results 1964". Political Science Resources. Archived from the original on 24 September 2015. Retrieved 14 April 2016.
- Kimber, Richard. "UK General Election results 1966". Political Science Resources. Archived from the original on 24 September 2015. Retrieved 14 April 2016.
- Kimber, Richard. "UK General Election results 1970". Political Science Resources. Archived from the original on 24 September 2015. Retrieved 14 April 2016.
- "1973 By Election Results". Archived from the original on 14 March 2012. Retrieved 17 September 2015.
- Kimber, Richard. "UK General Election results February 1974". Political Science Resources. Archived from the original on 1 July 2017. Retrieved 22 March 2016.
- Kimber, Richard. "UK General Election results October 1974". Political Science Resources. Archived from the original on 28 August 2016. Retrieved 22 March 2016.
- Kimber, Richard. "UK General Election results 1979". Political Science Resources. Archived from the original on 28 June 2017. Retrieved 22 March 2016.
This article is issued from Wikipedia. The text is licensed under Creative Commons - Attribution - Sharealike. Additional terms may apply for the media files.