Argyllshire (UK Parliament constituency)
Argyllshire was a county constituency of the House of Commons of the Parliament of Great Britain from 1708 to 1800 and of the House of Commons of the Parliament of the United Kingdom from 1801 until 1983. The constituency was named Argyll from 1950. The constituency was replaced in 1983 with Argyll and Bute.
| Argyllshire | |
|---|---|
| Former County constituency for the House of Commons | |
| Subdivisions of Scotland | Argyllshire |
| 1708–1983 | |
| Number of members | One |
| Replaced by | Argyll and Bute and Inverness, Nairn and Lochaber |
It elected one Member of Parliament (MP) using the first-past-the-post voting system.
Creation
The British parliamentary constituency was created in 1708 following the Acts of Union, 1707 and replaced the former Parliament of Scotland shire constituency of Argyllshire .[1] [2] [3] [4] [5]
Local government areas
Until Scottish counties were abolished, for most purposes, in 1975, the constituency represented the county of Argyll, except that constituency boundaries may not have coincided at all times with county boundaries, and any parliamentary burgh within the county would have been outside the constituency.
In 1975 most of the county plus the Isle of Bute became the Argyll district of the Strathclyde region. A northern area of the county became part of the Highland region. Until 1975 the Isle of Bute had been part of the county of Bute.
In 1996, 13 years after the abolition of the Argyll constituency and creation of the Argyll and Bute constituency, the Argyll district, plus a portion of the Dumbarton district of Strathclyde, became the Argyll and Bute unitary council area.
Members of Parliament
Argyllshire
Argyll
| Election | Member [6] | Party | |
|---|---|---|---|
| 1950 | Sir Duncan McCallum | Unionist | |
| 1958 (b) | Michael Noble | Unionist | |
| Feb 1974 | Iain MacCormick | Scottish National Party | |
| 1979 | John Mackay | Conservative | |
| 1983 | constituency abolished | ||
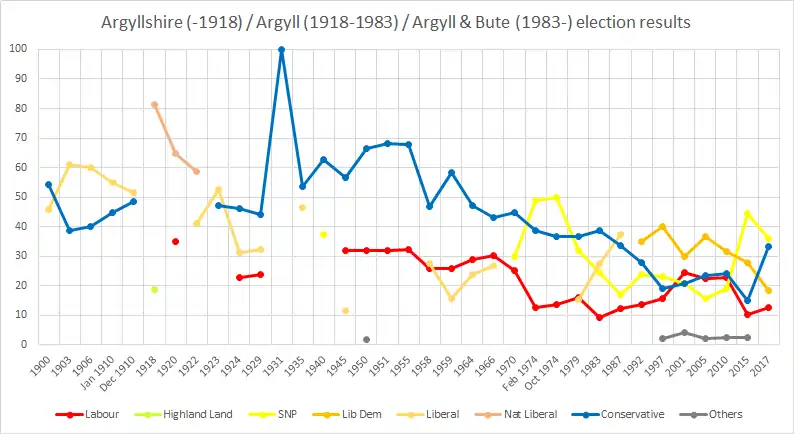
Election results

| Decades: |
Elections in the 1830s
| Party | Candidate | Votes | % | ||
|---|---|---|---|---|---|
| Whig | Walter Frederick Campbell | Unopposed | |||
| Registered electors | 114 | ||||
| Whig hold | |||||
| Party | Candidate | Votes | % | ||
|---|---|---|---|---|---|
| Whig | Walter Frederick Campbell | Unopposed | |||
| Whig hold | |||||
| Party | Candidate | Votes | % | ||
|---|---|---|---|---|---|
| Whig | James Henry Callander | Unopposed | |||
| Registered electors | 995 | ||||
| Whig hold | |||||
| Party | Candidate | Votes | % | ||
|---|---|---|---|---|---|
| Whig | Walter Frederick Campbell | Unopposed | |||
| Registered electors | 1,084 | ||||
| Whig hold | |||||
| Party | Candidate | Votes | % | ||
|---|---|---|---|---|---|
| Whig | Walter Frederick Campbell | 712 | 60.6 | ||
| Conservative | Alexander Campbell | 462 | 39.4 | ||
| Majority | 250 | 21.2 | |||
| Turnout | 1,174 | 70.5 | |||
| Registered electors | 1,666 | ||||
| Whig hold | |||||
Elections in the 1840s
| Party | Candidate | Votes | % | ±% | |
|---|---|---|---|---|---|
| Conservative | Alexander Campbell | Unopposed | |||
| Registered electors | 1,600 | ||||
| Conservative gain from Whig | |||||
Campbell resigned by accepting the office of Steward of the Chiltern Hundreds, causing a by-election.
| Party | Candidate | Votes | % | ±% | |
|---|---|---|---|---|---|
| Conservative | Duncan McNeill | Unopposed | |||
| Conservative hold | |||||
| Party | Candidate | Votes | % | ±% | |
|---|---|---|---|---|---|
| Conservative | Duncan McNeill | Unopposed | |||
| Registered electors | 1,889 | ||||
| Conservative hold | |||||
Elections in the 1850s
McNeill resigned after being appointed a Senator of the College of Justice, becoming Lord Colonsay and causing a by-election.
| Party | Candidate | Votes | % | ±% | |
|---|---|---|---|---|---|
| Conservative | Archibald Campbell | Unopposed | |||
| Conservative hold | |||||
| Party | Candidate | Votes | % | ±% | |
|---|---|---|---|---|---|
| Conservative | Archibald Campbell | Unopposed | |||
| Registered electors | 2,156 | ||||
| Conservative hold | |||||
| Party | Candidate | Votes | % | ±% | |
|---|---|---|---|---|---|
| Whig | Alexander Struthers Finlay | Unopposed | |||
| Registered electors | 2,256 | ||||
| Whig gain from Conservative | |||||
| Party | Candidate | Votes | % | ±% | |
|---|---|---|---|---|---|
| Liberal | Alexander Struthers Finlay | Unopposed | |||
| Registered electors | 2,294 | ||||
| Liberal hold | |||||
Elections in the 1860s
| Party | Candidate | Votes | % | ±% | |
|---|---|---|---|---|---|
| Liberal | Alexander Struthers Finlay | Unopposed | |||
| Registered electors | 1,914 | ||||
| Liberal hold | |||||
Finlay resigned, causing a by-election.
| Party | Candidate | Votes | % | ±% | |
|---|---|---|---|---|---|
| Liberal | John Campbell | Unopposed | |||
| Liberal hold | |||||
| Party | Candidate | Votes | % | ±% | |
|---|---|---|---|---|---|
| Liberal | John Campbell | Unopposed | |||
| Registered electors | 2,870 | ||||
| Liberal hold | |||||
Elections in the 1870s
| Party | Candidate | Votes | % | ±% | |
|---|---|---|---|---|---|
| Liberal | John Campbell | Unopposed | |||
| Registered electors | 3,018 | ||||
| Liberal hold | |||||
Campbell resigned after being appointed Governor General of Canada.

| Party | Candidate | Votes | % | ±% | |
|---|---|---|---|---|---|
| Liberal | Colin Campbell | 1,462 | 56.9 | N/A | |
| Conservative | John Malcolm | 1,107 | 43.1 | New | |
| Majority | 355 | 13.8 | N/A | ||
| Turnout | 2,569 | 82.0 | N/A | ||
| Registered electors | 3,133 | ||||
| Liberal hold | Swing | N/A | |||
Elections in the 1880s
| Party | Candidate | Votes | % | ±% | |
|---|---|---|---|---|---|
| Liberal | Colin Campbell | 1,457 | 55.0 | N/A | |
| Conservative | John Malcolm | 1,191 | 45.0 | N/A | |
| Majority | 266 | 10.0 | N/A | ||
| Turnout | 2,648 | 80.3 | N/A | ||
| Registered electors | 3,299 | ||||
| Liberal hold | Swing | N/A | |||
| Party | Candidate | Votes | % | ±% | |
|---|---|---|---|---|---|
| Independent Liberal (Crofters) | Donald Horne McFarlane | 3,340 | 48.6 | New | |
| Independent Liberal | William Mackinnon[15] | 2,856 | 41.6 | New | |
| Liberal | John Stuart McCaig | 670 | 9.8 | −45.2 | |
| Majority | 484 | 7.0 | N/A | ||
| Turnout | 6,866 | 68.6 | −11.7 | ||
| Registered electors | 10,011 | ||||
| Independent Liberal gain from Liberal | Swing | N/A | |||
| Party | Candidate | Votes | % | ±% | |
|---|---|---|---|---|---|
| Conservative | John Malcolm | 3,658 | 54.6 | New | |
| Liberal (Crofters) | Donald Horne McFarlane | 3,045 | 45.4 | −3.2 | |
| Majority | 613 | 9.2 | N/A | ||
| Turnout | 6,703 | 67.0 | −1.6 | ||
| Registered electors | 10,011 | ||||
| Conservative gain from Independent Liberal | Swing | N/A | |||
Elections in the 1890s
| Party | Candidate | Votes | % | ±% | |
|---|---|---|---|---|---|
| Liberal (Crofters) | Donald Horne Macfarlane | 3,666 | 50.6 | +5.2 | |
| Conservative | John Malcolm | 3,586 | 49.4 | −5.2 | |
| Majority | 80 | 1.2 | N/A | ||
| Turnout | 7,252 | 73.4 | +6.4 | ||
| Registered electors | 9,874 | ||||
| Liberal gain from Conservative | Swing | +5.2 | |||
| Party | Candidate | Votes | % | ±% | |
|---|---|---|---|---|---|
| Conservative | Donald Nicol | 3,970 | 50.9 | +1.5 | |
| Liberal | Donald Horne Macfarlane | 3,835 | 49.1 | −1.5 | |
| Majority | 135 | 1.8 | N/A | ||
| Turnout | 7,805 | 74.5 | +1.1 | ||
| Registered electors | 10,471 | ||||
| Conservative gain from Liberal | Swing | +1.5 | |||
Elections in the 1900s
| Party | Candidate | Votes | % | ±% | |
|---|---|---|---|---|---|
| Conservative | Donald Nicol | 3,834 | 54.2 | +3.3 | |
| Liberal | John Ainsworth | 3,234 | 45.8 | −3.3 | |
| Majority | 600 | 8.4 | +6.6 | ||
| Turnout | 7,068 | 67.9 | −6.6 | ||
| Registered electors | 10,405 | ||||
| Conservative hold | Swing | +3.3 | |||

| Party | Candidate | Votes | % | ±% | |
|---|---|---|---|---|---|
| Liberal | John Ainsworth | 4,326 | 61.2 | +15.4 | |
| Conservative | C. Stewart | 2,740 | 38.8 | −15.4 | |
| Majority | 1,586 | 22.4 | N/A | ||
| Turnout | 7,066 | 66.4 | −1.5 | ||
| Registered electors | 10,643 | ||||
| Liberal gain from Conservative | Swing | +15.4 | |||
| Party | Candidate | Votes | % | ±% | |
|---|---|---|---|---|---|
| Liberal | John Ainsworth | 4,507 | 59.9 | +14.1 | |
| Conservative | George Hutchison | 3,012 | 40.1 | −14.1 | |
| Majority | 1,495 | 19.8 | N/A | ||
| Turnout | 7,519 | 67.0 | −0.9 | ||
| Registered electors | 11,216 | ||||
| Liberal gain from Conservative | Swing | +14.1 | |||
Elections in the 1910s
| Party | Candidate | Votes | % | ±% | |
|---|---|---|---|---|---|
| Liberal | John Ainsworth | 4,443 | 55.1 | −4.8 | |
| Conservative | George Hutchison | 3,617 | 44.9 | +4.8 | |
| Majority | 826 | 10.2 | −9.6 | ||
| Turnout | 8,060 | 73.1 | +6.1 | ||
| Registered electors | 11,025 | ||||
| Liberal hold | Swing | −4.8 | |||
| Party | Candidate | Votes | % | ±% | |
|---|---|---|---|---|---|
| Liberal | John Ainsworth | 4,280 | 51.5 | −3.6 | |
| Conservative | George Hutchison | 4,023 | 48.5 | +3.6 | |
| Majority | 257 | 3.0 | −7.2 | ||
| Turnout | 8,303 | 71.8 | −1.3 | ||
| Registered electors | 11,572 | ||||
| Liberal hold | Swing | −3.6 | |||
General Election 1914/15:
Another General Election was required to take place before the end of 1915. The political parties had been making preparations for an election to take place and by the July 1914, the following candidates had been selected;
- Liberal:
- Unionist: George Hutchison[21]
| Party | Candidate | Votes | % | ±% | |
|---|---|---|---|---|---|
| C | Liberal | William Sutherland | 11,970 | 81.4 | +29.9 |
| Highland Land League | Lauchlin MacNeill Weir | 2,733 | 18.6 | New | |
| Majority | 9,237 | 62.8 | +59.8 | ||
| Turnout | 14,703 | 52.0 | −29.8 | ||
| Liberal hold | Swing | N/A | |||
| C indicates candidate endorsed by the coalition government. | |||||
Elections in the 1920s

| Party | Candidate | Votes | % | ±% | |
|---|---|---|---|---|---|
| C | Liberal | William Sutherland | 10,187 | 64.9 | -16.5 |
| Labour | Malcolm MacCallum | 5,498 | 35.1 | New | |
| Majority | 4,689 | 29.8 | -33.0 | ||
| Turnout | 15,685 | 50.2 | -1.8 | ||
| Liberal hold | Swing | ||||
| C indicates candidate endorsed by the coalition government. | |||||
| Party | Candidate | Votes | % | ±% | |
|---|---|---|---|---|---|
| National Liberal | William Sutherland | 9,848 | 58.8 | −6.1 | |
| Liberal | Henry Anderson Watt | 6,897 | 41.2 | +6.1 | |
| Majority | 2,591 | 15.6 | −12.2 | ||
| Turnout | 16,745 | 51.8 | +1.6 | ||
| National Liberal hold | Swing | −6.1 | |||
| Party | Candidate | Votes | % | ±% | |
|---|---|---|---|---|---|
| Liberal | William Sutherland | 9,020 | 52.7 | −6.1 | |
| Unionist | Frederick Alexander Macquisten | 8,100 | 47.3 | New | |
| Majority | 920 | 5.4 | N/A | ||
| Turnout | 17,120 | 53.3 | +1.5 | ||
| Liberal gain from National Liberal | Swing | N/A | |||
| Party | Candidate | Votes | % | ±% | |
|---|---|---|---|---|---|
| Unionist | Frederick Alexander Macquisten | 9,240 | 46.2 | −1.1 | |
| Liberal | William Sutherland | 6,211 | 31.1 | −21.6 | |
| Labour | I.H. MacIver | 4,532 | 22.7 | New | |
| Majority | 3,029 | 15.1 | +9.7 | ||
| Turnout | 19,983 | 62.7 | +9.4 | ||
| Unionist hold | Swing | ||||
| Party | Candidate | Votes | % | ±% | |
|---|---|---|---|---|---|
| Unionist | Frederick Alexander Macquisten | 11,108 | 44.1 | −2.1 | |
| Liberal | Basil Murray | 8,089 | 32.1 | +1.0 | |
| Labour | John L. Kinloch | 6,001 | 23.8 | +1.1 | |
| Majority | 3,019 | 12.0 | -3.1 | ||
| Turnout | 25,198 | 62.7 | 0.0 | ||
| Unionist hold | Swing | −1.6 | |||
Elections in the 1930s
| Party | Candidate | Votes | % | ±% | |
|---|---|---|---|---|---|
| Unionist | Frederick Alexander Macquisten | Unopposed | N/A | N/A | |
| Unionist hold | Swing | N/A | |||
| Party | Candidate | Votes | % | ±% | |
|---|---|---|---|---|---|
| Unionist | Frederick Alexander Macquisten | 13,260 | 53.6 | N/A | |
| Liberal | Basil Murray | 11,486 | 46.4 | New | |
| Majority | 1,774 | 7.2 | N/A | ||
| Turnout | 24,746 | 56.6 | N/A | ||
| Unionist hold | Swing | N/A | |||
Elections in the 1940s
| Party | Candidate | Votes | % | ±% | |
|---|---|---|---|---|---|
| Unionist | Duncan McCallum | 12,317 | 62.8 | +9.2 | |
| SNP | William Power | 7,308 | 37.2 | New | |
| Majority | 5,009 | 25.5 | +17.3 | ||
| Turnout | 19,625 | ||||
| Unionist hold | Swing | ||||
| Party | Candidate | Votes | % | ±% | |
|---|---|---|---|---|---|
| Unionist | Duncan McCallum | 15,791 | 56.6 | +3.0 | |
| Labour | A. MacNeill Weir | 8,889 | 31.9 | New | |
| Liberal | John Bannerman | 3,228 | 11.6 | −34.8 | |
| Majority | 6,902 | 24.7 | +17.5 | ||
| Turnout | 27,908 | 63.9 | +7.3 | ||
| Unionist hold | Swing | ||||
Elections in the 1950s
| Party | Candidate | Votes | % | ±% | |
|---|---|---|---|---|---|
| Unionist | Duncan McCallum | 19,259 | 66.5 | +9.9 | |
| Labour | I. Nicholson | 9,215 | 31.8 | −0.1 | |
| Scottish Home Rule | M S McP Holt | 490 | 1.7 | New | |
| Majority | 10,044 | 34.7 | +10.0 | ||
| Turnout | 28,964 | 75.1 | +11.2 | ||
| Unionist hold | Swing | ||||
| Party | Candidate | Votes | % | ±% | |
|---|---|---|---|---|---|
| Unionist | Duncan McCallum | 21,191 | 68.1 | +1.6 | |
| Labour | Robert M. Young | 9,925 | 31.9 | +0.1 | |
| Majority | 11,266 | 36.2 | +1.5 | ||
| Turnout | 28,210 | 67.1 | −8.0 | ||
| Unionist hold | Swing | ||||
| Party | Candidate | Votes | % | ±% | |
|---|---|---|---|---|---|
| Unionist | Duncan McCallum | 19,119 | 67.8 | −0.3 | |
| Labour | Robert M. Young | 9,091 | 32.2 | +0.3 | |
| Majority | 10,028 | 35.6 | -0.6 | ||
| Turnout | 28,210 | 66.9 | −0.2 | ||
| Unionist hold | Swing | −0.3 | |||
| Party | Candidate | Votes | % | ±% | |
|---|---|---|---|---|---|
| Unionist | Michael Noble | 12,541 | 46.8 | −21.0 | |
| Liberal | William D. McKean | 7,375 | 27.5 | New | |
| Labour | Robert M. Young | 6,884 | 25.7 | −6.5 | |
| Majority | 5,166 | 19.3 | -16.3 | ||
| Turnout | 26,800 | ||||
| Unionist hold | Swing | ||||
| Party | Candidate | Votes | % | ±% | |
|---|---|---|---|---|---|
| Unionist | Michael Noble | 16,599 | 58.4 | −9.4 | |
| Labour | D. Nisbet | 7,356 | 25.9 | −6.3 | |
| Liberal | Gerard Noel | 4,469 | 15.7 | New | |
| Majority | 9,243 | 32.5 | -3.1 | ||
| Turnout | 28,424 | 71.0 | +4.1 | ||
| Unionist hold | Swing | ||||
Elections in the 1960s
| Party | Candidate | Votes | % | ±% | |
|---|---|---|---|---|---|
| Unionist | Michael Noble | 13,277 | 47.2 | −11.2 | |
| Labour | Duncan L. MacMillan | 8,120 | 28.9 | +3.0 | |
| Liberal | John MacKay | 6,707 | 23.9 | +8.2 | |
| Majority | 5,157 | 18.4 | -14.1 | ||
| Turnout | 28,104 | 70.3 | −0.7 | ||
| Unionist hold | Swing | ||||
| Party | Candidate | Votes | % | ±% | |
|---|---|---|---|---|---|
| Conservative | Michael Noble | 12,178 | 43.2 | −4.0 | |
| Labour | John McFadden | 8,486 | 30.1 | +1.2 | |
| Liberal | John MacKay | 7,512 | 26.7 | +2.8 | |
| Majority | 3,692 | 13.1 | -5.3 | ||
| Turnout | 28,176 | 72.3 | +2.0 | ||
| Conservative hold | Swing | ||||
Elections in the 1970s
| Party | Candidate | Votes | % | ±% | |
|---|---|---|---|---|---|
| Conservative | Michael Noble | 13,521 | 44.8 | +1.6 | |
| SNP | Iain MacCormick | 9,039 | 29.9 | New | |
| Labour | John McFadden | 7,633 | 25.3 | −4.8 | |
| Majority | 4,482 | 14.8 | +1.7 | ||
| Turnout | 30,193 | 73.9 | +1.6 | ||
| Conservative hold | Swing | ||||
| Party | Candidate | Votes | % | ±% | |
|---|---|---|---|---|---|
| SNP | Iain MacCormick | 15,646 | 48.9 | +19.0 | |
| Conservative | Peter Craft Hutchison | 12,358 | 38.6 | −6.2 | |
| Labour | M.J.N. MacGregor | 4,027 | 12.6 | −12.7 | |
| Majority | 3,288 | 10.3 | N/A | ||
| Turnout | 32,031 | 77.3 | +3.4 | ||
| SNP gain from Conservative | Swing | +12.6 | |||
| Party | Candidate | Votes | % | ±% | |
|---|---|---|---|---|---|
| SNP | Iain MacCormick | 14,967 | 49.7 | +0.8 | |
| Conservative | John MacKay | 11,036 | 36.7 | −1.9 | |
| Labour | M.J.N. MacGregor | 4,103 | 13.6 | +1.0 | |
| Majority | 3,931 | 13.0 | +1.7 | ||
| Turnout | 30,106 | 72.0 | −5.3 | ||
| SNP hold | Swing | +1.4 | |||
| Party | Candidate | Votes | % | ±% | |
|---|---|---|---|---|---|
| Conservative | John MacKay | 12,191 | 36.8 | +0.1 | |
| SNP | Iain MacCormick | 10,545 | 31.8 | −17.9 | |
| Labour | M.J.N. MacGregor | 5,283 | 16.0 | +2.4 | |
| Liberal | Ray Michie | 5,113 | 15.4 | New | |
| Majority | 1,646 | 5.0 | N/A | ||
| Turnout | 33,132 | 76.1 | +4.1 | ||
| Conservative gain from SNP | Swing | +9.0 | |||
See also
References
- "Argyllshire". History of Parliament Online (1690–1715). Retrieved 27 March 2019.
- "Argyllshire". History of Parliament Online (1715–1754). Retrieved 27 March 2019.
- "Argyllshire". History of Parliament Online (1754–1790). Retrieved 27 March 2019.
- "Argyllshire". History of Parliament Online (1790–1820). Retrieved 27 March 2019.
- "Argyllshire". History of Parliament Online (1820–1832). Retrieved 27 March 2019.
- Leigh Rayment's Historical List of MPs – Constituencies beginning with "A" (part 2)
- Smith, Henry Stooks (1842). The Register of Parliamentary Contested Elections (Second ed.). Simpkin, Marshall & Company. p. 196.
- "Argyllshire". Caledonian Mercury. p. 4. Retrieved 5 September 2018 – via British Newspaper Archive.
- Fisher, David R. "Argyllshire". The History of Parliament. Retrieved 7 May 2020.
- Craig, F. W. S., ed. (1977). British Parliamentary Election Results 1832-1885 (e-book) (1st ed.). London: Macmillan Press. ISBN 978-1-349-02349-3.
- Debrett's House of Commons, 1870
- The Times,29 April 1880
- Debrett's House of Commons and the Judicial Bench, 1889
- Craig, FWS, ed. (1974). British Parliamentary Election Results: 1885–1918. London: Macmillan Press. ISBN 9781349022984.
- "The General Election". Glasgow Herald. 9 October 1885. pp. 9–10.
- Whitaker's Almanack, 1893
- Debrett's House of Commons and the Judicial Bench, 1901
- The Times, 29 August 1903
- Whitaker's Almanack, 1907
- Debrett's House of Commons and the Judicial Bench, 1916
- Edinburgh Evening News 19 Sep 1914
- Whitaker's Almanack, 1920
- British parliamentary election results 1918-1949, FWS Craig
- The Times, 11 December 1923
- Oliver & Boyd's Edinburgh Almanac, 1927
- The Times, 3 June 1929
- Whitaker's Almanack, 1934
- Whitaker's Almanack, 1939
- Whitaker's Almanack, 1944
- Whitaker's Almanack 1963
- Whitaker's Almanack 1977