Glasgow Bridgeton (UK Parliament constituency)
Glasgow Bridgeton was a parliamentary constituency in the city of Glasgow. From 1885 to 1974, it returned one Member of Parliament (MP) to the House of Commons of the Parliament of the United Kingdom, elected by the first-past-the-post voting system.
| Glasgow Bridgeton | |
|---|---|
| Former Burgh constituency for the House of Commons | |
| Major settlements | Glasgow |
| 1885–1974 | |
| Number of members | One |
| Replaced by | Glasgow Central, Glasgow Shettleston[1] |
| Created from | Glasgow |
For many years it was represented by James Maxton, the leader of the Independent Labour Party whose policies were to the left of the Labour Party.
Boundaries
The Redistribution of Seats Act 1885 provided that the constituency was to consist of the first and fourth Municipal Wards.[2]
The constituency was described in the Glasgow Parliamentary Divisions Act 1896 as being-
- "The area within a line beginning at a point in the centre of Albert Bridge, where the same intersects the centre line of the River Clyde, and thence proceeding eastwards along the centre of that river till it meets the parliamentary boundary of the city at Harvie's Dyke; thence northwards along the said parliamentary boundary to the centre of London Road; thence westwards along the centres of London Road and Canning Street to a point opposite the centre of Clyde Street; thence northwards along the centres of Clyde Street and Abercromby Street to the centre of Gallowgate; thence westwards along the centre of Gallowgate to a point opposite the centre of Saltmarket; thence southwards along the centre of Saltmarket to the centre of the River Clyde at the point first described."
In the Representation of the People Act 1918 it was described as-
- "That portion of the city which is bounded by a line commencing at a point on the centre line of London Road, where the road is crossed by the Caledonian Railway (Glasgow Lines), thence south-westward and southward along the centre line of the said railway to where it joins the Caledonian Railway Branch Line from Dalmarnock to Rutherglen, thence southward along the centre line of the said last-mentioned railway to a point on the municipal boundary at the centre line of the River Clyde, thence south-westward and north-westward along the municipal boundary of the city to a point on the centre line of the River Clyde about 77 yards south-eastward from the centre of Rutherglen Bridge, thence westward, northward and westward along the centre line of the River Clyde to the centre of Albert Bridge thence northward along the centre line of Saltmarket to the centre line of Gallowgate, thence eastward along the centre line of Gallowgate to the centre line of Abercromby Street, thence southwestward along the centre line of Abercromby Street to the centre line of Canning Street, thence eastward along the centre line of Canning Street and London Road to the point of commencement."
The Representation of the People Act 1948 provided that the constituency was to consist of the Calton and Dalmarnock wards of the City of Glasgow. The Parliamentary Constituencies (Scotland) (Glasgow Bridgeton, Glasgow Provan and Glasgow Shettleston) Order, 1955[3] added to this the portion of the Mile-End ward that had previously been part of the Glasgow Camlachie constituency.
The Parliamentary Constituencies (Scotland) Order 1970[4] provided that the constituency was to consist of "The following wards of the county of the city of Glasgow, namely, Calton and Dalmarnock and that part of Mile-End ward which lies to the west of a line commencing at a point on the northern boundary of the ward immediately opposite the centre line of Millerston Street; thence southward to and along the centre line of Millerston Street to the centre line of Gallowgate; thence eastward along the centre line of Gallowgate to a point opposite the centre line of Fielden Street; thence southward along the centre line of Fielden Street to the termination of the line on the southern boundary of the Mile-End ward opposite the centre of Fielden Street."
Members of Parliament
| Election | Member | Party | |
|---|---|---|---|
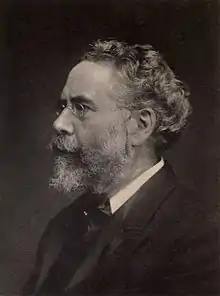
| 1885 | Sir Edward Richard Russell | Liberal | |
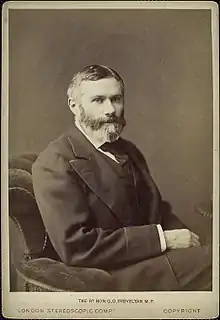
| 1887 by-election | Sir George Otto Trevelyan | Liberal | |
| 1897 by-election | Sir Charles Cameron | Liberal | |
| 1900 | Charles Scott Dickson | Unionist | |
| 1906 | James William Cleland | Liberal | |
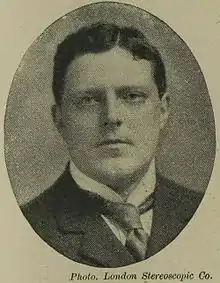
| 1910 (Dec) | Alexander MacCallum Scott | Liberal | |
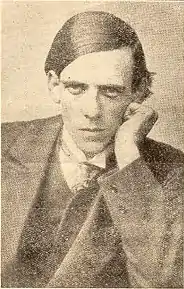
| 1922 | James Maxton | Labour | |
| 1931 | Independent Labour Party | ||
| 1946 by-election | James Carmichael | Independent Labour Party | |
| 1947[5] | Labour | ||
| 1961 by-election | James Bennett | Labour | |
| 1974 (Feb) | constituency abolished | ||
Election results
Elections in the 1880s

| Party | Candidate | Votes | % | ±% | |
|---|---|---|---|---|---|
| Liberal | Edward Russell | 3,601 | 44.7 | ||
| Conservative | Elphinstone Vans Agnew Maitland | 3,478 | 43.2 | ||
| Scottish Land Restoration | William Forsyth | 978 | 12.1 | ||
| Majority | 123 | 1.5 | |||
| Turnout | 8,057 | 80.1 | |||
| Registered electors | 10,058 | ||||
| Liberal win (new seat) | |||||
| Party | Candidate | Votes | % | ±% | |
|---|---|---|---|---|---|
| Liberal | Edward Russell | 4,364 | 55.0 | +10.3 | |
| Conservative | Colin Mackenzie | 3,567 | 45.0 | +1.8 | |
| Majority | 797 | 10.0 | +8.5 | ||
| Turnout | 7,931 | 78.9 | -1.2 | ||
| Registered electors | 10,058 | ||||
| Liberal hold | Swing | +4.2 | |||
Russell resigned, causing a by-election.

| Party | Candidate | Votes | % | ±% | |
|---|---|---|---|---|---|
| Liberal | George Trevelyan | 4,654 | 58.9 | +3.9 | |
| Liberal Unionist | Evelyn Ashley | 3,253 | 41.1 | -3.9 | |
| Majority | 1,401 | 17.8 | +7.8 | ||
| Turnout | 7,907 | 78.3 | -0.6 | ||
| Registered electors | 10,095 | ||||
| Liberal hold | Swing | +3.9 | |||
Elections in the 1890s
| Party | Candidate | Votes | % | ±% | |
|---|---|---|---|---|---|
| Liberal | George Trevelyan | 4,729 | 58.5 | +3.5 | |
| Conservative | William Charles Maughan | 3,351 | 41.5 | −3.5 | |
| Majority | 1,378 | 17.0 | +7.0 | ||
| Turnout | 8,080 | 76.9 | −2.0 | ||
| Registered electors | 10,512 | ||||
| Liberal hold | Swing | +3.5 | |||
Trevelyan was appointed Secretary of State for Scotland, requiring a by-election.
| Party | Candidate | Votes | % | ±% | |
|---|---|---|---|---|---|
| Liberal | George Trevelyan | Unopposed | |||
| Liberal hold | |||||
| Party | Candidate | Votes | % | ±% | |
|---|---|---|---|---|---|
| Liberal | George Trevelyan | 3,161 | 48.7 | −9.8 | |
| Conservative | Charles Dickson | 2,719 | 41.9 | +0.4 | |
| Ind. Labour Party | James Watson | 609 | 9.4 | New | |
| Majority | 442 | 6.8 | −10.2 | ||
| Turnout | 6,489 | 61.9 | −15.0 | ||
| Registered electors | 10,481 | ||||
| Liberal hold | Swing | −5.1 | |||
| Party | Candidate | Votes | % | ±% | |
|---|---|---|---|---|---|
| Liberal | Charles Cameron | 4,506 | 50.7 | +2.0 | |
| Conservative | Charles Dickson | 4,381 | 49.3 | +7.4 | |
| Majority | 125 | 1.4 | -5.4 | ||
| Turnout | 8,887 | 81.3 | +19.4 | ||
| Registered electors | 10,930 | ||||
| Liberal hold | Swing | -2.7 | |||
Elections in the 1900s
| Party | Candidate | Votes | % | ±% | |
|---|---|---|---|---|---|
| Conservative | Charles Dickson | 5,032 | 55.5 | +13.6 | |
| Liberal | Alexander Murison | 4,041 | 44.5 | −4.2 | |
| Majority | 991 | 11.0 | N/A | ||
| Turnout | 4,041 | 77.5 | +15.6 | ||
| Registered electors | 11,706 | ||||
| Conservative gain from Liberal | Swing | +8.9 | |||

| Party | Candidate | Votes | % | ±% | |
|---|---|---|---|---|---|
| Liberal | James William Cleland | 5,585 | 58.2 | +13.7 | |
| Conservative | Charles Dickson | 4,019 | 41.8 | −13.7 | |
| Majority | 1,566 | 16.4 | N/A | ||
| Turnout | 9,604 | 84.1 | +6.6 | ||
| Registered electors | 11,421 | ||||
| Liberal gain from Conservative | Swing | +13.7 | |||
Elections in the 1910s
| Party | Candidate | Votes | % | ±% | |
|---|---|---|---|---|---|
| Liberal | James William Cleland | 5,336 | 60.1 | +1.9 | |
| Conservative | Patrick Keith Lang | 3,539 | 39.9 | -1.9 | |
| Majority | 1,797 | 20.2 | +3.8 | ||
| Turnout | 8,875 | 87.5 | +3.4 | ||
| Liberal hold | Swing | +1.9 | |||
| Party | Candidate | Votes | % | ±% | |
|---|---|---|---|---|---|
| Liberal | MacCallum Scott | 4,759 | 55.5 | -4.6 | |
| Conservative | William Hutchison | 3,816 | 44.5 | +4.6 | |
| Majority | 943 | 11.0 | -9.2 | ||
| Turnout | 8,575 | 85.6 | -1.9 | ||
| Liberal hold | Swing | -4.6 | |||
General Election 1914/15:
Another General Election was required to take place before the end of 1915. The political parties had been making preparations for an election to take place and by July 1914, the following candidates had been selected;
- Liberal: MacCallum Scott
- Unionist: William Hutchison

| Party | Candidate | Votes | % | ±% | |
|---|---|---|---|---|---|
| C | Liberal | MacCallum Scott | 10,887 | 55.2 | −0.3 |
| Labour | James Maxton | 7,860 | 39.8 | New | |
| Independent | Eunice Murray | 991 | 5.0 | New | |
| Majority | 3,207 | 15.4 | +4.4 | ||
| Turnout | 19,738 | 52.0 | −33.6 | ||
| Registered electors | 37,980 | ||||
| Liberal hold | Swing | N/A | |||
| C indicates candidate endorsed by the coalition government. | |||||
- Unionist candidate William Hutchison withdrew when Coalition Government endorsed the Liberal candidate
Elections in the 1920s
| Party | Candidate | Votes | % | ±% | |
|---|---|---|---|---|---|
| Labour | James Maxton | 17,890 | 63.7 | +23.9 | |
| National Liberal | MacCallum Scott | 10,198 | 36.3 | −18.9 | |
| Majority | 7,692 | 27.4 | N/A | ||
| Turnout | 28,088 | 76.7 | +24.7 | ||
| Registered electors | 36,627 | ||||
| Labour gain from Liberal | Swing | +21.4 | |||
| Party | Candidate | Votes | % | ±% | |
|---|---|---|---|---|---|
| Labour | James Maxton | 15,735 | 64.8 | +1.1 | |
| Unionist | J. B. Black | 6,101 | 25.1 | New | |
| Liberal | Thomas Randall Anderson | 2,445 | 10.1 | −26.2 | |
| Majority | 9,634 | 39.7 | +12.3 | ||
| Turnout | 24,281 | 66.5 | −10.2 | ||
| Registered electors | 36,522 | ||||
| Labour hold | Swing | +13.7 | |||
| Party | Candidate | Votes | % | ±% | |
|---|---|---|---|---|---|
| Labour | James Maxton | 16,850 | 61.3 | −3.5 | |
| Unionist | Maurice James McCracken | 10,633 | 38.7 | +13.6 | |
| Majority | 6,217 | 22.6 | −17.1 | ||
| Turnout | 27,483 | 75.1 | +8.6 | ||
| Registered electors | 36,571 | ||||
| Labour hold | Swing | −8.6 | |||
| Party | Candidate | Votes | % | ±% | |
|---|---|---|---|---|---|
| Labour | James Maxton | 21,033 | 67.7 | +6.4 | |
| Unionist | Maurice James McCracken | 10,049 | 32.3 | −6.4 | |
| Majority | 10,984 | 35.4 | +12.8 | ||
| Turnout | 31,082 | 71.6 | −3.5 | ||
| Registered electors | 43,421 | ||||
| Labour hold | Swing | +6.4 | |||
Elections in the 1930s
| Party | Candidate | Votes | % | ±% | |
|---|---|---|---|---|---|
| Ind. Labour Party | James Maxton | 16,630 | 58.21 | ||
| Unionist | Catherine Gavin | 11,941 | 41.79 | ||
| Majority | 4,689 | 16.42 | |||
| Turnout | 28,571 | ||||
| Ind. Labour Party hold | Swing | ||||
| Party | Candidate | Votes | % | ±% | |
|---|---|---|---|---|---|
| Ind. Labour Party | James Maxton | 17,691 | 64.95 | ||
| Unionist | McInnes Shaw | 8,951 | 32.86 | ||
| Labour | Samuel McLaren | 594 | 2.18 | New | |
| Majority | 8,740 | 32.09 | |||
| Turnout | 27,236 | ||||
| Ind. Labour Party hold | Swing | ||||
Elections in the 1940s
| Party | Candidate | Votes | % | ±% | |
|---|---|---|---|---|---|
| Ind. Labour Party | James Maxton | 13,220 | 66.4 | +1.5 | |
| Unionist | Richard Brooman-White | 6,695 | 33.6 | +0.7 | |
| Majority | 6,525 | 32.8 | +0.7 | ||
| Turnout | 19,915 | 58.4 | |||
| Ind. Labour Party hold | Swing | ||||
| Party | Candidate | Votes | % | ±% | |
|---|---|---|---|---|---|
| Ind. Labour Party | James Carmichael | 6,351 | 34.3 | - 32.1 | |
| Labour | John Wheatley | 5,180 | 28.0 | New | |
| Unionist | Victor Dunn Warren | 3,987 | 21.6 | -15.0 | |
| Independent | Wendy Wood | 2,575 | 13.9 | New | |
| United Socialist Movement | Guy Aldred | 405 | 2.2 | New | |
| Majority | 1,171 | 6.3 | -26.5 | ||
| Turnout | 18,498 | ||||
| Ind. Labour Party hold | Swing | N/A | |||
Elections in the 1950s
| Party | Candidate | Votes | % | ±% | |
|---|---|---|---|---|---|
| Labour | James Carmichael | 20,268 | 59.4 | N/A | |
| Unionist | Francis Charles Irwin | 11,025 | 32.3 | -1.3 | |
| Ind. Labour Party | Robert Duncan | 1,974 | 5.8 | -60.6 | |
| Communist | D. Kelly | 858 | 2.5 | New | |
| Majority | 9,243 | 27.1 | N/A | ||
| Turnout | 34,125 | 76.9 | |||
| Labour gain from Ind. Labour Party | Swing | N/A | |||
| Party | Candidate | Votes | % | ±% | |
|---|---|---|---|---|---|
| Labour | James Carmichael | 21,307 | 63.6 | +4.2 | |
| Unionist | Richard A. Thomson | 10,382 | 31.0 | -1.3 | |
| Ind. Labour Party | Robert Duncan | 1,796 | 5.4 | -0.4 | |
| Majority | 10,925 | 32.6 | +5.5 | ||
| Turnout | 33,485 | 76.9 | 0.0 | ||
| Labour hold | Swing | ||||
| Party | Candidate | Votes | % | ±% | |
|---|---|---|---|---|---|
| Labour | James Carmichael | 20,476 | 57.7 | -5.9 | |
| Unionist | Paul Thomas Cowcher | 12,375 | 34.9 | +3.9 | |
| Ind. Labour Party | George Stone | 2,619 | 7.4 | +2.0 | |
| Majority | 8,101 | 22.8 | -9.8 | ||
| Turnout | 35,470 | 66.0 | -10.9 | ||
| Labour hold | Swing | ||||
| Party | Candidate | Votes | % | ±% | |
|---|---|---|---|---|---|
| Labour | James Carmichael | 21,048 | 63.4 | +5.7 | |
| Unionist | Iain Docherty | 12,139 | 36.6 | +1.7 | |
| Majority | 8,909 | 26.8 | +4.0 | ||
| Turnout | 33,187 | 68.5 | +2.5 | ||
| Labour hold | Swing | ||||
Elections in the 1960s
| Party | Candidate | Votes | % | ±% | |
|---|---|---|---|---|---|
| Labour | James Bennett | 10,930 | 57.5 | -5.9 | |
| Unionist | Malcolm McNeill | 3,935 | 20.7 | -15.9 | |
| SNP | Ian Macdonald | 3,549 | 18.7 | New | |
| Ind. Labour Party | George Stone | 586 | 3.1 | New | |
| Majority | 6,995 | 36.8 | +10.0 | ||
| Turnout | 19,000 | 41.9 | -26.6 | ||
| Labour hold | Swing | ||||
| Party | Candidate | Votes | % | ±% | |
|---|---|---|---|---|---|
| Labour | James Bennett | 18,879 | 71.59 | +8.19 | |
| Unionist | John Hogg | 12,139 | 28.41 | -8.19 | |
| Majority | 11,387 | 43.18 | +16.38 | ||
| Turnout | 26,371 | 63.57 | -4.93 | ||
| Registered electors | 41,482 | ||||
| Labour hold | Swing | +8.19 | |||
| Party | Candidate | Votes | % | ±% | |
|---|---|---|---|---|---|
| Labour | James Bennett | 16,219 | 74.27 | +2.68 | |
| Conservative | John Hogg | 5,619 | 25.73 | -2.68 | |
| Majority | 10,600 | 48.54 | +5.36 | ||
| Turnout | 21,838 | 58.77 | -4.80 | ||
| Registered electors | 37,159 | ||||
| Labour hold | Swing | +2.68 | |||
Elections in the 1970s
| Party | Candidate | Votes | % | ±% | |
|---|---|---|---|---|---|
| Labour | James Bennett | 11,056 | 62.86 | -11.41 | |
| Conservative | Robert Gavin | 3,801 | 21.61 | -4.12 | |
| SNP | Gordon E J Wallace | 1,550 | 8.81 | New | |
| Independent Protestant | Jack T A Glass | 1,180 | 6.71 | New | |
| Majority | 7,255 | 41.25 | -7.29 | ||
| Turnout | 15,787 | 56.26 | -1.49 | ||
| Registered electors | 31,262 | ||||
| Labour hold | Swing | -3.65 | |||
Notes
- Statutory Instrument 1970 No. 1680 (section Two) The Parliamentary Constituencies (Scotland) Order 1970 (Coming into force 25 November 1970)
- Redistribution of Seats Act 1885, Sixth Schedule
- Statutory Instrument 1995/23
- S.I. 1970/1680.
- James Carmichael was elected in 1946 as an Independent Labour Party candidate. However, he and the two other ILP MPs defected to the Labour Party in 1947.
- Debrett's House of Commons and Judicial Bench, 1889
- British Parliamentary Election Results 1885-1918, FWS Craig
- The Liberal Year Book, 1907
- Debrett's House of Commons & Judicial Bench, 1886
- Whitaker's Almanack, 1893
- Debrett's House of Commons & Judicial Bench, 1901
- Whitaker's Almanack, 1907
- Debrett's House of Commons & Judicial Bench, 1916
- Whitaker's Almanack, 1920
- The Constitutional Year Book, 1930
- The Constitutional Year Book, 1932
- Whitaker's Almanack, 1934
- Whitaker's Almanack, 1939
- The Times, 17 November 1961
- Kimber, Richard. "UK General Election results 1964". Political Science Resources. Retrieved 11 April 2016.
- Kimber, Richard. "UK General Election results 1966". Political Science Resources. Retrieved 11 April 2016.
- Kimber, Richard. "UK General Election results 1970". Political Science Resources. Retrieved 11 April 2016.