Electoral history of Bill Clinton
Electoral history of Bill Clinton, 42nd President of the United States (1993–2001); 40th and 42nd Governor of Arkansas (1979–1981 and 1983–1992).
President Bill Clinton
Congressional races (1974)
| Party | Candidate | Votes | % | |
|---|---|---|---|---|
| Democratic | Bill Clinton | 59,697 | 43.60% | |
| Democratic | Gene Rainwater | 36,145 | 26.40% | |
| Democratic | David Stewart | 34,959 | 25.53% | |
| Democratic | James A. Scanlon | 6,121 | 4.47% | |
| Total votes | 136,922 | 100.00% | ||
| Party | Candidate | Votes | % | |
|---|---|---|---|---|
| Democratic | Bill Clinton | 37,788 | 68.96% | |
| Democratic | Gene Rainwater | 17,011 | 31.04% | |
| Total votes | 54,799 | 100.00% | ||
| Party | Candidate | Votes | % | |
|---|---|---|---|---|
| Republican | John Paul Hammerschmidt (incumbent) | 89,324 | 51.83% | |
| Democratic | Bill Clinton | 83,030 | 48.17% | |
| Total votes | 172,354 | 100.00% | ||
Statewide races in Arkansas (1976–1990)
Arkansas Attorney General, 1976 (Democratic primary):[1]
- Bill Clinton - 56%
- George Jernigan - 25%
- Clarence Cash - 19%
Arkansas Attorney General, 1976
- Bill Clinton (D) - elected unopposed
| Party | Candidate | Votes | % | |
|---|---|---|---|---|
| Democratic | Bill Clinton | 341,118 | 59.55% | |
| Democratic | Joe Woodward | 123,674 | 21.59% | |
| Democratic | Frank Lady | 76,026 | 13.27% | |
| Democratic | Randall Mathis | 26,096 | 4.56% | |
| Democratic | Monroe Schwarzlose | 5,898 | 1.03% | |
| Total votes | 572,812 | 100.00% | ||
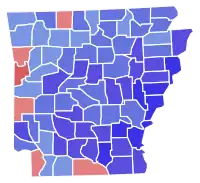
County results of the 1978 Arkansas gubernatorial election
| Party | Candidate | Votes | % | |
|---|---|---|---|---|
| Democratic | Bill Clinton | 335,101 | 63.36% | |
| Republican | Lynn Lowe | 193,746 | 36.64% | |
| Total votes | 528,847 | 100.00% | ||
| Party | Candidate | Votes | % | |
|---|---|---|---|---|
| Democratic | Bill Clinton (incumbent) | 306,735 | 68.87% | |
| Democratic | Monroe Schwarzlose | 138,660 | 31.13% | |
| Total votes | 445,395 | 100.00% | ||
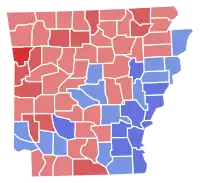
County results of the 1980 Arkansas gubernatorial election
| Party | Candidate | Votes | % | |
|---|---|---|---|---|
| Republican | Frank D. White | 435,684 | 51.93% | |
| Democratic | Bill Clinton (incumbent) | 403,241 | 48.07% | |
| Total votes | 838,925 | 100.00% | ||
| Party | Candidate | Votes | % | |
|---|---|---|---|---|
| Democratic | Bill Clinton | 236,961 | 41.78% | |
| Democratic | Joe Purcell | 166,066 | 29.28% | |
| Democratic | Jim Guy Tucker | 129,362 | 22.81% | |
| Democratic | Kim Hendren | 21,829 | 3.85% | |
| Democratic | Monroe Schwarzlose | 12,907 | 2.28% | |
| Total votes | 567,125 | 100.00% | ||
| Party | Candidate | Votes | % | |
|---|---|---|---|---|
| Democratic | Bill Clinton | 239,209 | 53.69% | |
| Democratic | Joe Purcell | 206,358 | 46.31% | |
| Total votes | 445,567 | 100.00% | ||

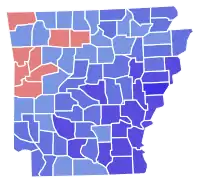
County results of the 1982 Arkansas gubernatorial election
| Party | Candidate | Votes | % | |
|---|---|---|---|---|
| Democratic | Bill Clinton | 431,855 | 54.71% | |
| Republican | Frank D. White (incumbent) | 357,496 | 45.29% | |
| Total votes | 789,351 | 100.00% | ||
| Party | Candidate | Votes | % | |
|---|---|---|---|---|
| Democratic | Bill Clinton (incumbent) | 317,577 | 64.46% | |
| Democratic | Lonnie Turner | 119,266 | 24.21% | |
| Democratic | Kermit Moss | 31,727 | 6.44% | |
| Democratic | Monroe Schwarzlose | 24,116 | 4.90% | |
| Total votes | 492,686 | 100.00% | ||
County results of the 1984 Arkansas gubernatorial election
| Party | Candidate | Votes | % | |
|---|---|---|---|---|
| Democratic | Bill Clinton (incumbent) | 554,561 | 62.55% | |
| Republican | Woody Freeman | 331,987 | 37.45% | |
| Total votes | 886,548 | 100.00% | ||
| Party | Candidate | Votes | % | |
|---|---|---|---|---|
| Democratic | Bill Clinton (incumbent) | 315,397 | 60.58% | |
| Democratic | Orval E. Faubus | 174,402 | 33.50% | |
| Democratic | W. Dean Goldsby | 30,829 | 5.92% | |
| Total votes | 520,628 | 100.00% | ||

County results of the 1986 Arkansas gubernatorial election
| Party | Candidate | Votes | % | |
|---|---|---|---|---|
| Democratic | Bill Clinton (incumbent) | 439,882 | 63.89% | |
| Republican | Frank D. White | 248,427 | 36.08% | |
| Total votes | 688,309 | 100.00% | ||
| Party | Candidate | Votes | % | |
|---|---|---|---|---|
| Democratic | Bill Clinton (incumbent) | 269,329 | 54.84% | |
| Democratic | Tom McRae | 190,887 | 38.87% | |
| Democratic | Joe Holmes | 9,659 | 1.97% | |
| Democratic | Jerry Tolliver | 8,629 | 1.76% | |
| Democratic | Cyrus Young | 4,301 | 0.88% | |
| Total votes | 482,805 | 100.00% | ||
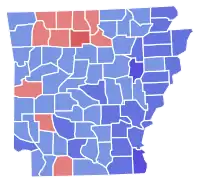
County results of the 1990 Arkansas gubernatorial election
| Party | Candidate | Votes | % | |
|---|---|---|---|---|
| Democratic | Bill Clinton (incumbent) | 400,386 | 57.49% | |
| Republican | Sheffield Nelson | 295,925 | 42.49% | |
| Total votes | 696,311 | 100.00% | ||
Presidential elections (1992–1996)

First instance vote by state and territory of the 1992 Democratic Party presidential primaries
|
Bill Clinton (37)
Paul Tsongas (9)
Jerry Brown (6)
Tom Harkin (3)
Bob Kerrey (1)
|
1992 Democratic Party presidential primaries
- Bill Clinton - 10,482,411 (52.01%)
- Jerry Brown - 4,071,232 (20.20%)
- Paul Tsongas - 3,656,010 (18.14%)
- Unpledged - 750,873 (3.73%)
- Bob Kerrey - 318,457 (1.58%)
- Tom Harkin - 280,304 (1.39%)
- Lyndon LaRouche - 154,599 (0.77%)
- Eugene McCarthy - 108,678 (0.54%)
- Charles Woods - 88,948 (0.44%)
- Larry Agran - 58,611 (0.29%)
- Ross Perot - 54,755 (0.27%)
- Ralph Nader - 35,935 (0.18%)
- Louis Stokes - 29,983 (0.15%)
- Angus Wheeler McDonald - 9,900 (0.05%)
- J. Louis McAlpine - 7,911 (0.04%)
- George W. Benns - 7,887 (0.04%)
- Rufus T. Higginbotham - 7,705 (0.04%)
- Tom Howard Hawks - 7,434 (0.04%)
- Stephen Bruke - 5,261 (0.03%)
- Tom Laughin - 5,202 (0.03%)
- Tom Shiekman - 4,965 (0.03%)
- Jeffrey F. Marsh - 2,445 (0.01%)
- George Ballard - 2,067 (0.01%)
- Ray Rollinson - 1,206 (0.01%)
- Leonora Fulani - 402 (0.00%)
- Douglas Wilder - 240 (0.00%)
1992 Democratic National Convention
- Bill Clinton - 3,372 (80.27%)
- Jerry Brown - 596 (14.19%)
- Paul Tsongas - 209 (4.98%)
- Robert P. Casey - 10 (0.24%)
- Patricia Schroeder - 8 (0.19%)
- Larry Agran - 3 (0.07%)
- Ron Daniels - 1 (0.02%)
- Al Gore - 1 (0.02%)
- Joe Simonetta 1 (0.02%)
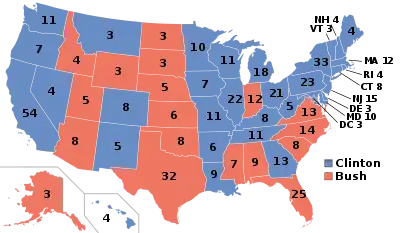
1992 United States presidential election
| Presidential candidate | Party | Home state | Popular vote | Electoral vote |
Running mate | |||
|---|---|---|---|---|---|---|---|---|
| Count | Percentage | Vice-presidential candidate | Home state | Electoral vote | ||||
| William Jefferson Clinton | Democratic | Arkansas | 44,909,889 | 43.01% | 370 | Albert Arnold Gore, Jr. | Tennessee | 370 |
| George Herbert Walker Bush (Incumbent) | Republican | Texas | 39,104,550 | 37.45% | 168 | James Danforth Quayle | Indiana | 168 |
| Henry Ross Perot | Independent | Texas | 19,743,821 | 18.91% | 0 | James Bond Stockdale | California | 0 |
| Andre Verne Marrou | Libertarian | Alaska | 290,087 | 0.28% | 0 | Nancy Lord | Nevada | 0 |
| Bo Gritz | Populist | Nevada | 106,152 | 0.10% | 0 | Cyril Minett | New Mexico | 0 |
| Lenora Fulani | New Alliance Party | New York | 73,622 | 0.07% | 0 | Maria Elizabeth Muñoz | California | 0 |
| Howard Phillips | U.S. Taxpayers Party | Virginia | 43,369 | 0.04% | 0 | Albion Knight, Jr. | Florida | 0 |
| Other | 152,516 | 0.13% | — | Other | — | |||
| Total | 104,423,923 | 100% | 538 | 538 | ||||
| Needed to win | 270 | 270 | ||||||
1996 Democratic Party presidential primaries
- Bill Clinton (inc.) - 9,706,802 (88.98%)
- Lyndon LaRouche - 596,422 (5.47%)
- Unpledged - 411,270 (3.77%)
1996 Democratic National Convention
- Bill Clinton (inc.) - 4,277 (99.72%)
- Abstaining - 12 (0.28%)
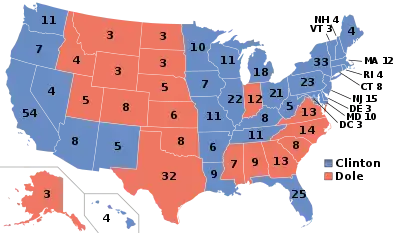
1996 United States presidential election
| Presidential candidate | Party | Home state | Popular vote | Electoral vote |
Running mate | |||
|---|---|---|---|---|---|---|---|---|
| Count | Percentage | Vice-presidential candidate | Home state | Electoral vote | ||||
| William Jefferson Clinton (Incumbent) | Democratic[lower-alpha 1] | Arkansas | 47,401,185 | 49.24% | 379 | Albert Arnold Gore, Jr. | Tennessee | 379 |
| Robert Joseph Dole | Republican[lower-alpha 2] | Kansas | 39,197,469 | 40.71% | 159 | Jack French Kemp | New York[3] | 159 |
| Henry Ross Perot | Reform[lower-alpha 3] | Texas | 8,085,294 | 8.40% | 0 | Patrick Choate[lower-alpha 4] | Washington, D.C. | 0 |
| Ralph Nader | Green | Connecticut | 685,297 | 0.71% | 0 | Winona LaDuke[lower-alpha 5] | California | 0 |
| Harry Browne | Libertarian | Tennessee | 485,759 | 0.50% | 0 | Jo Jorgensen | South Carolina | 0 |
| Howard Phillips | Taxpayers | Virginia | 184,656 | 0.19% | 0 | Herbert Titus | Oregon | 0 |
| John Hagelin | Natural Law | Iowa | 113,670 | 0.12% | 0 | Mike Tompkins | Massachusetts | 0 |
| Other[lower-alpha 6] | 113,667 | 0.12% | — | Other[lower-alpha 7] | — | |||
| Total | 96,277,634 | 100% | 538 | 538 | ||||
| Needed to win | 270 | 270 | ||||||
See also
Notes
- In New York, the Clinton vote was a fusion of the Democratic and Liberal slates. There, Clinton obtained 3,649,630 votes on the Democratic ticket and 106,547 votes on the Liberal ticket.[2]
- In New York, the Dole vote was a fusion of the Republican, Conservative, and Freedom slates. There, Dole obtained 1,738,707 votes on the Republican ticket, 183,392 votes on the Conservative ticket, and 11,393 votes on the Freedom ticket.[2]
- In South Carolina, the Perot vote was a fusion of the Reform and Patriot slates. There, Perot obtained 27,464 votes on the Reform ticket and 36,913 votes on the Patriot ticket.[2]
- On the California, Indiana, Iowa, Kansas, Louisiana, Maine, Maryland, Missouri, Montana, Oregon, South Dakota, Tennessee, and Texas election ballots, James Campbell of California, Perot's former boss at IBM, was listed as a stand-in Vice-Presidential candidate until Perot decided on Pat Choate as his choice for Vice President.
- The Green Party vice presidential candidate varied from state to state. Winona LaDuke was his vice presidential candidate in eighteen of the twenty-two states where he appeared on the ballot. Anne Goeke was Nader's running mate in Iowa[4] and Vermont. Madelyn Hoffman was his running mate in New Jersey.[5] Muriel Tillinghast was his running mate in New York.[6]
- Candidates receiving less than 0.05% of the total popular vote.
- Candidates receiving less than 0.05% of the total popular vote.
References
- AllPolitics - Candidates - Democrats Archived 2011-07-19 at the Wayback Machine
- "'96 Presidential and Congressional Election Statistics". Official website of the Office of the Clerk of the House of Representatives. Archived from the original on January 26, 2006. Retrieved February 17, 2006.
- Matthews, Dylan (August 9, 2012). "The effect of veep picks, in two charts". The Washington Post. Retrieved November 27, 2014.
Jack Kemp, whose home state of New York saw an even stronger anti-Republican swing in 1996
- "November 12, 1996" (PDF). Minutes of the Meetings of the Board of Supervisors. Cerro Gordo County. 1996. Archived from the original (PDF) on May 26, 2006. Retrieved March 30, 2006.
- Fernandez, Sonia (February 22, 2000). "Nader '55 to run for president". The Daily Princetonian. Daily Princetonian Publishing Company, Inc. Archived from the original on March 24, 2007. Retrieved March 30, 2006.
- "Electors of President and Vice President". Cattaraugus County: Board of Elections: 1996 Election Results. Cattaraugus County, New York State. Archived from the original on September 28, 2007. Retrieved March 30, 2006.
Electoral histories of Presidents of the United States | ||
|---|---|---|
 | ||
This article is issued from Wikipedia. The text is licensed under Creative Commons - Attribution - Sharealike. Additional terms may apply for the media files.