Electoral history of Joe Biden
Joe Biden is the 46th and current president of the United States,[1] formerly the 47th vice president of the United States (2009–2017) and a U.S. Senator from Delaware (1973–2009). He formally ran as a Democratic candidate for president in 1988 and 2008, and won the Democratic nomination in 2020. He won his first presidential primary in the 2020 South Carolina contest. A few days later, on Super Tuesday, he won primaries in nine more states. Biden went on to win the subsequent presidential election, and was inaugurated in January 2021.
| ||
|---|---|---|
|
Incumbent
Vice President of the United States
Presidential campaigns
Vice presidential campaigns Published works
 |
||

Early election
| Party | Candidate | Votes | % | |
|---|---|---|---|---|
| Democratic | Joseph R. Biden, Jr. | 10,573 | 55.4 | |
| Republican | Lawrence T. Messick | 8,192 | 42.9 | |
| American | Kenneth A. Horner | 317 | 1.7 | |
| Total votes | 19,082 | 100.0 | ||
United States Senate elections
| Party | Candidate | Votes | % | |
|---|---|---|---|---|
| Democratic | Joe Biden | 116,006 | 50.5% | |
| Republican | J. Caleb Boggs (incumbent) | 112,844 | 49.1% | |
| American | Henry Majka | 803 | 0.4% | |
| Prohibition | Herbert B. Wood | 175 | 0.1% | |
| Party | Candidate | Votes | % | |
|---|---|---|---|---|
| Democratic | Joe Biden (incumbent) | 93,930 | 58.0% | |
| Republican | James H. Baxter, Jr. | 66,479 | 41.0% | |
| American | Donald G. Gies | 1,663 | 1.0% | |
| Party | Candidate | Votes | % | |
|---|---|---|---|---|
| Democratic | Joe Biden (incumbent) | 147,831 | 60.1% | |
| Republican | John M. Burris | 98,101 | 39.9% | |
| Party | Candidate | Votes | % | |
|---|---|---|---|---|
| Democratic | Joe Biden (incumbent) | 112,918 | 62.7% | |
| Republican | M. Jane Brady | 64,554 | 35.8% | |
| Libertarian | Lee Rosenbaum | 2,680 | 1.5% | |
| None | Others | 5 | 0.0% | |
| Party | Candidate | Votes | % | |
|---|---|---|---|---|
| Democratic | Joe Biden (incumbent) | 165,465 | 60% | |
| Republican | Ray Clatworthy | 105,088 | 38% | |
| Libertarian | Lee Rosenbaum | 3,340 | 1.2% | |
| Natural Law | Jacqueline Kossoff | 1,698 | 0.6% | |
| Party | Candidate | Votes | % | |
|---|---|---|---|---|
| Democratic | Joe Biden (incumbent) | 135,253 | 58.2% | |
| Republican | Ray Clatworthy | 94,793 | 40.8% | |
| Delaware Independent | Bud Barros | 996 | 0.4% | |
| Libertarian | Raymond Buranello | 922 | 0.4% | |
| Natural Law | Robert E. Mattson | 350 | 0.2% | |
| Party | Candidate | Votes | % | |
|---|---|---|---|---|
| Democratic | Joe Biden (incumbent) | 257,484 | 64.7% | |
| Republican | Christine O'Donnell | 140,584 | 35.3% | |
Presidential elections
1984
1984 Democratic National Convention (presidential tally):
- Walter Mondale – 2,191 (56.4%)
- Gary Hart – 1,201 (30.9%)
- Jesse Jackson – 466 (12.0%)
- Thomas Eagleton – 18 (0.45%)
- George McGovern – 4 (0.1%)
- John Glenn – 2 (0.1%)
- Joe Biden – 1 (0.0%)
- Martha Kirkland – 1 (0.0%)
1988
1988 Democratic National Convention (presidential tally):
- Michael Dukakis – 2,877 (70.1%)
- Jesse Jackson – 1,219 (29.7%)
- Richard H. Stallings – 3 (0.1%)
- Joe Biden – 2 (0.1%)
- Dick Gephardt – 2 (0.1%)
- Lloyd Bentsen – 1 (0.0%)
- Gary Hart – 1 (0.02)
2008
2008 New Hampshire Democratic vice presidential primary:
- Raymond Stebbins – 50,485 (46.9%)
- William Bryk – 22,965 (21.4%)
- John Edwards* – 10,553 (9.8%)
- Barack Obama* 6,402 (6.0%)
- Bill Richardson* (write-in) – 5,525 (5.1%)
- Hillary Clinton* (write-in) – 3,419 (3.2%)
- Joe Biden* – 1,512 (1.4%)
- Al Gore* – 966 (0.9%)
- Dennis Kucinich* – 762 (0.7%)
- Bill Clinton* – 388 (0.4%)
- John McCain* – 293 (0.3%)
- Chris Dodd* – 224 (0.2%)
- Ron Paul* – 176 (0.2%)
- Jack Barnes, Jr.* – 95 (0.1%)
- Mike Gravel* – 91 (0.1%)
- Joe Lieberman* – 67 (0.1%)
- Mitt Romney* – 66 (0.1%)
- Mike Huckabee* – 63 (0.1%)
- Rudy Giuliani* – 46 (0.0%)
- Darrel Hunter* – 20 (0.0%)
2008 Democratic presidential primaries:
Excluding penalized contests, only primary and caucuses votes:
- Barack Obama – 16,706,853
- Hillary Clinton – 16,239,821
- John Edwards – 742,010
- Bill Richardson – 89,054
- Uncommitted – 82,660
- Dennis Kucinich – 68,482
- Joe Biden – 64,041
- Mike Gravel – 27,662
- Chris Dodd – 25,300
- Others – 22,556
Including penalized contests:
- Hillary Clinton – 18,225,175 (48.0%)
- Barack Obama – 17,988,182 (47.4%)
- John Edwards – 1,006,275 (2.7%)
- Uncommitted – 299,610 (0.8%)
- Bill Richardson – 106,073 (0.3%)
- Dennis Kucinich – 103,994 (0.3%)
- Joe Biden – 81,641 (0.2%)
- Scattering – 44,348 (0.1%)
- Mike Gravel – 40,251 (0.1%)
- Chris Dodd – 35,281 (0.1%)
2008 Democratic National Convention (vice presidential tally):[3]
- Joe Biden – chosen by acclamation
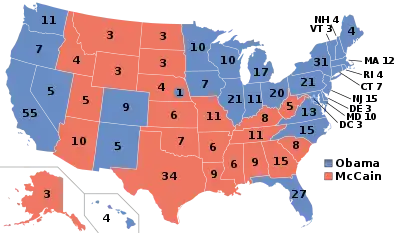
Obama/Biden: 365 votes (28 states + DC + NE-02)
McCain/Palin: 173 votes (22 states)
| Party | Candidate | Votes | % | ||
|---|---|---|---|---|---|
| Democratic | Barack Obama / Joe Biden | 69,498,516 | 52.93% | ||
| Republican | John McCain / Sarah Palin | 59,948,323 | 45.65% | ||
| Independent | Ralph Nader / Matt Gonzalez | 739,034 | 0.56% | ||
| Libertarian | Bob Barr / Wayne Allyn Root | 523,715 | 0.40% | ||
| Constitution | Chuck Baldwin / Darrell Castle | 199,750 | 0.15% | ||
| Green | Cynthia McKinney / Rosa Clemente | 161,797 | 0.12% | ||
| American Independent | Alan Keyes / Wiley Drake | 47,941 | 0.04% | ||
| N/A | Other | 242,685 | 0.18% | ||
| Total votes | 131,313,820 | 100.00% | |||
| Democratic gain from Republican | |||||
2012
2012 Democratic National Convention (vice presidential tally):[4]
- Joe Biden – chosen by acclamation
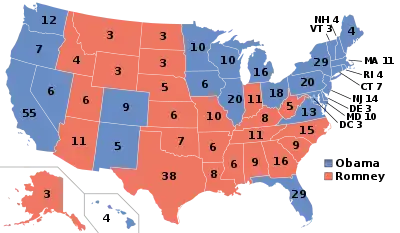
Obama/Biden: 332 votes (26 states + DC)
Romney/Ryan: 206 votes (24 states)
| Party | Candidate | Votes | % | ||
|---|---|---|---|---|---|
| Democratic | Barack Obama / Joe Biden (incumbents) | 65,915,795 | 51.06% | ||
| Republican | Mitt Romney / Paul Ryan | 60,933,504 | 47.20% | ||
| Libertarian | Gary Johnson / Jim Gray | 1,275,971 | 0.99% | ||
| Green | Jill Stein / Cheri Honkala | 469,627 | 0.36% | ||
| Constitution | Virgil Goode / James Clymer | 122,389 | 0.09% | ||
| Peace and Freedom | Roseanne Barr / Cindy Sheehan | 67,326 | 0.05% | ||
| Justice | Rocky Anderson / Luis J. Rodriguez | 43,018 | 0.03% | ||
| American Independent | Tom Hoefling / J.D. Ellis | 40,628 | 0.03% | ||
| Reform | Andre Barnett / Kenneth Cross | 956 | 0.00% | ||
| N/A | Other | 216,196 | 0.19% | ||
| Total votes | 129,085,410 | 100.00% | |||
| Democratic hold | |||||
2020
| Candidate | Votes | % | |
|---|---|---|---|
| Joe Biden | 19,058,036 | 51.9% | |
| Bernie Sanders | 9,674,912 | 26.3% | |
| Elizabeth Warren | 2,830,184 | 7.7% | |
| Michael Bloomberg | 2,493,382 | 6.8% | |
| Pete Buttigieg | 923,867 | 2.5% | |
| Amy Klobuchar | 529,566 | 1.4% | |
| Tulsi Gabbard | 273,840 | 0.8% | |
| Other | 963,356 | 2.6% | |
| 2020 Democratic National Convention | |||
|---|---|---|---|
| Candidate | |||
| Delegates | |||
| Joe Biden | 3,358 | ||
| Bernie Sanders | 1,151 | ||
| Others | 5 | ||
| Abstain | 35 | ||
| Needed to win | 1,991 | ||
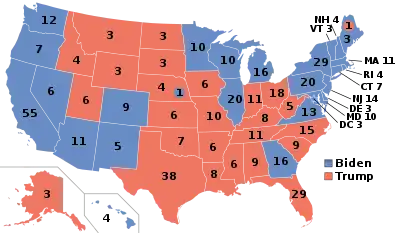
Biden/Harris: 306 votes (25 states + DC + NE-02)
Trump/Pence: 232 votes (25 states + ME-02)
| Party | Candidate | Votes | % | ||
|---|---|---|---|---|---|
| Democratic | Joe Biden / Kamala Harris | 81,268,757 | 51.31% | ||
| Republican | Donald Trump / Mike Pence (incumbents) | 74,216,722 | 46.86% | ||
| Libertarian | Jo Jorgensen / Spike Cohen | 1,865,720 | 1.18% | ||
| Green | Howie Hawkins / Angela Walker | 405,034 | 0.26% | ||
| N/A | Other | 626,210 | 0.40% | ||
| Total votes | 158,383,800 | 100.00% | |||
| Democratic gain from Republican | |||||
See also
- Electoral history of Sarah Palin
- Electoral history of John McCain
- Electoral history of Barack Obama
- Electoral history of Hillary Rodham Clinton
- Electoral history of John Edwards
- Electoral history of Bill Richardson
- Electoral history of Mike Gravel
- Electoral history of Christopher Dodd
- Electoral history of Paul Ryan
- Electoral history of Mitt Romney
References
- "Biden and Harris inauguration live: Joe Biden becomes the 46th US president". BBC News. Retrieved 2021-01-20.
- "State of Delaware Official Results of General Election (Excluding Write-in Votes) 1970" (PDF). Office of the Delaware State Election Commissioner. Retrieved 2020-04-28.
- "CNN.com Video". CNN. Retrieved May 1, 2010.
- "Beau Biden Speech Kicks Of Motion To Nominate Father Joe Biden For Vice President". The Huffington Post. September 6, 2012.
Electoral histories of Presidents of the United States | ||
|---|---|---|
| ||
Electoral histories of Vice Presidents of the United States | ||
|---|---|---|
 | ||
| |||||||
| Early career |  | ||||||
| Presidency | |||||||
| Elections |
| ||||||
| Family |
| ||||||
| Writings | |||||||
| Speeches |
| ||||||
| Media depictions | |||||||
| Honors | |||||||
| Related | |||||||
| |||||||