Energy in the Czech Republic
Energy in the Czech Republic describes energy and electricity production, consumption and import in the Czech Republic.
Overview
| Energy in Czech Republic[1] | ||||||
|---|---|---|---|---|---|---|
| Capita | Prim. energy | Production | Export | Electricity | CO2-emission | |
| Million | TWh | TWh | TWh | TWh | Mt | |
| 2004 | 10.2 | 530 | 398 | 136 | 63.5 | 118.8 |
| 2007 | 10.3 | 532 | 392 | 134 | 67.1 | 122.1 |
| 2008 | 10.4 | 519 | 382 | 144 | 67.4 | 116.8 |
| 2009 | 10.5 | 488 | 363 | 132 | 64.1 | 109.8 |
| 2012 | 10.5 | 505 | 373 | 140 | 66.0 | 112.7 |
| 2012R | 10.5 | 496 | 380 | 126 | 66.3 | 107.8 |
| 2013 | 10.5 | 488 | 351 | 137 | 66.1 | 101.1 |
| Change 2004-09 | 2.9 % | -7.8 % | -8.9 % | -2.8 % | 0.9 % | -7.5 % |
| Mtoe = 11.63 TWh, Prim. energy includes energy losses that are 2/3 for nuclear power[2]
2012R = CO2 calculation criteria changed, numbers updated | ||||||
Primary energy consumption per million people in 2008 was 50 TWh compared to other countries (TWh): Canada 93 (3103 TWh 33.3), USA 87 (26,560 TWh 304.5), UK 40 (2,424 TWh 61.4), Greece 31 TWh (354 TWh 11.24) and Poland 30 (1138 TWh 38.12).
Fossil fuels

Coal
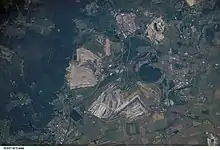
OKD is a major mining company in the Czech Republic.
Most coal is used in the country of origin. In 2009 world coal export was 14% of coal production (836/5990 Mt). The Czech Republic was 10th top coal exporter in 2009 with 4 Mt. The top hard coal net exporters in 2009 were (Mt): Australia 262, Indonesia 230, Russia 93, Colombia 69, South Africa 67, United States 33, Vietnam 25, Kazakhstan 22, Canada 20 and Czech Republic 4.[3]
Oil and gas
Oil and gas deposits in the Czech Republic are in Moravia. Gas pipelines include Gazela Pipeline and Druzhba pipeline from Russia to points in Ukraine, Belarus, Poland, Hungary, Slovakia, Czech Republic, and Germany.
Electrical energy
According to IEA the electricity use (gross production + imports – exports – transmission/distribution losses) in the Czech Republic in 2008 was 67 TWh. Population was 10.4 million people. In comparison, in Portugal population was 10.6 million people and electricity use 51 TWh.
Nuclear power

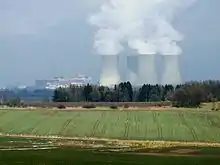
There are two nuclear power plants in the Czech Republic
Renewable energy
In 2010 there was photovoltaics (PV) solar power 1,953 MW - fourth top in the EU. Kadaň Photovoltaics Plant is among large plants.
In 2010 there was 471 MW solar heating - 10th top in the EU.
In 2010 there was 215 MW wind power - 18th top in the EU.
| EU and the Czech Republic Wind Energy Capacity (MW)[4][5][6][7] | ||||||||||||||||
|---|---|---|---|---|---|---|---|---|---|---|---|---|---|---|---|---|
| No | Country | 2012 | 2011 | 2010 | 2009 | 2008 | 2007 | 2006 | 2005 | 2004 | 2003 | 2002 | 2001 | 2000 | 1999 | 1998 |
| - | EU-27 | 105,696 | 93,957 | 84,074 | 74,767 | 64,712 | 56,517 | 48,069 | 40,511 | 34,383 | 28,599 | 23,159 | 17,315 | 12,887 | 9,678 | 6,453 |
| 20 | Czech Republic | 260 | 217 | 215 | 192 | 150 | 116 | 54 | 28 | 17 | 9 | 3 | 0 | 0 | 0 | 0 |
Environment
In 2014, the emissions of carbon dioxide were 10.4 tons per capita. The EU average was 7.9 tons per capita. Czech Republic's emissions were comparable to those of Japan or the Netherlands.[8]
Business
According to Forbes list of billionaires (2011) Czech billionaire Zdenek Bakala ($2 B 2011) has made his wealth in coal business.[9] Forbes ranked Zdenek Bakala (Net Worth$1.5 B) as richest Czech in energy business (coal) in 2013.[10]
Bakala is the biggest player on the coal market in Central Europe. He has consolidated Polish mining markets into his company New World Resources.[11]
References
- IEA Key World Energy Statistics Statistics 2015, 2014 (2012R as in November 2015 + 2012 as in March 2014 is comparable to previous years statistical calculation criteria, 2013, 2012, 2011, 2010, 2009 Archived 2013-10-07 at the Wayback Machine, 2006 Archived 2009-10-12 at the Wayback Machine IEA October, crude oil p.11, coal p. 13 gas p. 15
- Energy in Sweden 2010 Archived October 16, 2013, at the Wayback Machine. Facts and figures. The Swedish Energy Agency. Table 8 Losses in nuclear power stations Table 9 Nuclear power brutto
- Key world energy statistics 2010 IEA page 15
- EWEA Staff (2010). "Cumulative installed capacity per EU Member State 1998 - 2009 (MW)". European Wind Energy Association. Retrieved 2010-05-22.
- EWEA Staff (February 2011). "EWEA Annual Statistics 2010" (PDF). European Wind Energy Association. Retrieved 2011-01-31.
- EWEA Staff (February 2012). "EWEA Annual Statistics 2011" (PDF). European Wind Energy Association. Retrieved 2011-02-18.
- Wind in power: 2012 European statistics February 2013
- "CO2 time series 1990-2014 per capita for world countries". Netherlands Environmental Assessment Agency. Retrieved 2015-11-30.
- Forbes list of billionaires (2011) Forbes list of billionaires (2011) Energy Forbes March 10, 2011
- Billionaires Czech Energy 2013
- Profile Bakala Forbes March 2011
External links
| Wikimedia Commons has media related to Energy in the Czech Republic. |
