Energy in Finland
Energy in Finland describes energy and electricity production, consumption and import in Finland. Energy policy of Finland describes the politics of Finland related to energy. Electricity sector in Finland is the main article of electricity in Finland.
Finland lacks domestic sources of fossil energy and must import substantial amounts of petroleum, natural gas, and other energy resources, including uranium for nuclear power.
Energy consumption in Finland per capita is the highest in European Union. Reasons for this include industries with high energy consumption (half of energy is consumed by industry), high standards of living, cold climate (25% of consumption is used in heating) and long distances (16% of consumption is used in transport).[1][2]
Overview
| Population (million) |
Prim. energy (TWh) |
Production (TWh) |
Import (TWh) |
Electricity (TWh) |
CO2-emission (Mt) | |
|---|---|---|---|---|---|---|
| 2004 | 5.23 | 443 | 185 | 247 | 87.7 | 68.9 |
| 2007 | 5.29 | 424 | 185 | 232 | 90.8 | 64.4 |
| 2008 | 5.31 | 410 | 193 | 230 | 86.9 | 56.6 |
| 2009 | 5.34 | 386 | 192 | 213 | 81.4 | 55.0 |
| 2010 | 5.36 | 423 | 201 | 210 | 88.4 | 62.9 |
| 2012 | 5.39 | 404 | 199 | 223 | 84.8 | 55.6 |
| 2012R | 5.41 | 387 | 201 | 181 | 84.9 | 49.4 |
| 2013 | 5.44 | 384 | 211 | 192 | 84.4 | 49.2 |
| Change 2004-13 | +4.0% | -13.3% | +14.1% | -22.3% | -3.8% | -28.6% |
| Mtoe = 11.63 TWh, Prim. energy includes energy losses that are 2/3 for nuclear power[4] 2012R = CO2 calculation criteria changed, numbers updated | ||||||
There was no sustainable decline in CO2 emission in Finland during 1990–2007. The energy use decline 2008–2009 is based on recession and at least some paper industry factories relocation abroad. The annual changes of CO2 emissions of Finland were in some years 7–20% during 1990–2007. Increase of emissions was 18% in 1996 and 20% in 2006. The peat energy use and CO2 emissions per capita had correlation in 1990–2007.[5][6]
| t/capita | Annual change % | Peat TWh | |
|---|---|---|---|
| 1990 | 10.2 | 16 | |
| 1991 | 11.0 | 108% | 16 |
| 1995 | 10.2 | 21 | |
| 1996 | 12.0 | 118% | 24 |
| 2000 | 10.1 | 17 | |
| 2001 | 10.9 | 108% | 24 |
| 2003 | 13.2 | 28 | |
| 2004 | 12.8 | 25 | |
| 2005 | 10.4 | 19 | |
| 2006 | 12.6 | 121% | 26 |
| 2007 | 12.1 | 29 |
The share of electricity generated from renewable energy in Finland has been stable from 1998 to 2005: 11 to 12 percent plus yearly changing hydropower, together around 24 to 27 percent. The RE of total energy has been 24 percent (1998 to 2005). The forest industry black liquor and forest industry wood burning were 57 percent (1990) and 67 percent (2005) of the RE of total energy.[7] The rest is mainly water power. The most of available hydropower for energy is already in use.
Consumption
Final consumption of energy - i.e. after losses through transformation and transmission - was 1 102 petajoules, which equals 202 gigajoules per capita in 2013. Of this, 46% is consumed by industry, 16% in transportation and 25% in heating.[2]
Energy consumption per capita in Finland is the highest in EU. Reasons for this include energy-intensive industry, a high standard of living, a cold climate and long distances. Rise of energy consumption stopped in the 21st century, mainly due to changes of industry. There is now less heavy industry and the energy efficiency has improved. New energy consuming business is the data centres of international enterprises.[1]
Energy consumption increased 44 percent in electricity and 30 percent in the total energy use from 1990 to 2006. The increase in electricity consumption 15,000 GWh from 1995 to 2005 was more than the total hydropower capacity. The electricity consumption increased almost equally in all sectors (industry, homes, and services).
Industry
Among all industries, the heaviest users are paper and pulp industry, metal industry, oil refining and chemical industry.
The forest industry uses 30 percent of all electricity in Finland (1990–2005). Its process wastes, wood residues and black liquor, gave 7000–8000 GWh RE electricity in 2005. In the year 2005 this and electricity consumption fell 10% compared to 2004 based on the long forest industry strike.[8]
Heating
Energy consumption for heating has increased, when population and average size of homes has grown. As of 2019, 2.8 million Finns and half a million Helsinki residents rely on district heating for their homes.[9] In 2017, 66% of the new homes were connected to district heating and usage kept expanding among old buildings as well.[10]
80% of the energy use of households was spent on heating in 2008–2011.[11][12]
In 2017, traditional fossil fuels (coal, peat and oil) provided most heat, with 39%; gas, 10%; wood and wood residues, 30%; bio and non-bio waste burning and other sources, 12%; energy recovery, 9%: in total, the emissions were 149 g CO2/kWh.[10]
Heat pumps are used to facilitate electrification and energy recovery. In Mäntsälä 80% of the energy is provided by excess heat recovered from the local Yandex data centre.[13] In Helsinki, Helen Oy increases energy efficiency with several heat pumps which recover heat from return water of the district cooling and from warm waste waters before they end up in the Baltic: rock caverns and cisterns under parks are used in the Katri Vala heating and cooling plant under Sörnainen (123 MW in 2021),[14] Vuosaari (13+9.5 MW with 20% sea water)[15] and Esplanadi.[16]
The coal-powered Hanasaari Power Plant will be replaced by 2024 to reduce Helen carbon emissions by 40%. In addition to heat pumps, 25% of its former output is expected to come from a biomass plant in Vuosaari next to the existing heat pumps, while heat storage to stabilise demand will be provided by water cisterns in place of the former oil cisterns under the Mustikkamaa island.[16] In detail, Helen Oy estimates a 11.6 GWh capacity and 120 MW thermal output for its 260,000 m³ water cistern under Mustikkamaa (fully charged or discharged in 4 days at capacity), operating from 2021 to offset days of peak production/demand;[17] while the 300,000 m³ rock caverns 50 m under sea level in Kruunuvuorenranta (near Laajasalo) were designated in 2018 to store heat in summer from warm sea water and release it in winter for district heating.[18]
In Espoo, St1 and Fortum are testing a geothermal plant. In 2018, water was pumped in the bedrock under Otaniemi through a bore over 6 km deep made with a down-the-hole drill[19] to reach the warmer earth crust, in a process which was allowed to produce micro-hearthquakes up to magnitude 1.9.[20] Once an appropriate position is found to drill an exit bore towards which the water would flow underground, the plant could produce 40 MW of thermal power.[19]
Transport
Transport uses 30% of all energy, but 40% of the energy is produced with oil. Consumption per kilometre has decreased, but the number of kilometres has grown.
The Kyoto agreement had obligation to restrict the traffic emissions in Finland between 2008–12 in the year 1990 level. According to Ministry report in 2004 the share of public transport in Finland is lower that in the most European countries.[21]
Export and import
In 2014, the energy products import was worth 10 billion euros.
In January to September 2016 the import of energy products was worth of 5 billion euros, 15% less than the year before. The biggest source was Russia, 64% of all imports. Export was worth of 2.8 billion euros, one percent more than the previous year. 78% of export went to OECD countries. Decrease of price of petroleum products has affected the decrease of value of imported energy.[22]
Electricity
In Finland electricity consumption was 87.4 TWh in 2018 and 60 TWh in 1990. This is 45% rise in 1990-2018. Net imports of electricity was 23% of supply in 2018. Solar and wind power was produced in total 5.9 TWh in 2018.[23]
One of the major electrical grid distribution network operators Caruna in the south of Finland is major owned (80%) by Australian and Dutch holding and property companies.[24]
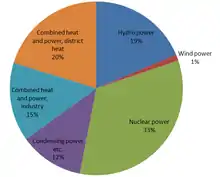
In 2009 the consumption of energy sources in electricity generation by mode of production was: 28% nuclear power, 16% hydro power, 13% coal, 11% natural gas, 5% peat and 10% wood fuels and other renewables. Net imports of electricity in 2009 were 15%.[25] In 2011, 16% of electricity consumption was derived from imported electricity.[26]
European Commission (EC) demanded for Finland a €32,000-day penalty from the Court of Justice of the European Union in March 2013 for not implementing the electricity directive in time.[27]
The share of electricity generation from renewables in Finland was 40% 2012 and target 33% by 2020. In comparison, unlike Finland most countries have target to increase the share of electricity generation from renewables from 2012 to 2020 in Europe as:[28]
- Finland 40% 33%
- Denmark 48% 50%
- Belgium 14% 20.9%
- Netherlands 12% 37%
- France 16% 27%
- Ireland 20% 42.5%
- Germany 25% 40–45% by 2025
- UK 12% 50% by 2015
- Scotland 100% by 2020
- Sweden 58% 62.9%
Energy sources
During first half of 2015 the most important sources were wood (26% of total consumption), oil (23%), nuclear (18%), coal (9%), gas (7%), hydropower (5%) and peat (5%). Wind power covered one per cent of consumption, other sources in total four per cent.
Finland has no native sources of fossil fuels.
Wood
About one quarter of energy production in Finland comes from burning wood. There are no forests grown for fuel. Instead, most firewood is byproduct of other uses of wood. The black liquor (by-product of pulp production) and peel and branches (by-product of sawmill industry) are used by the forest industry itself in creating its own energy by wood burning.[29]
The Finnish Association for Nature Conservation (FANC) demands Finland not to burn stumps and sturdy wood that are 15% of wood chips burned according to government energy policy.
Petroleum
Finland does not have any of its own petroleum resources, so it relies 100% on petroleum imports. In 2007 oil imports were almost 11 million tonnes in Finland. In 2006, Finnish oil imports came from Russia (64 percent), Norway (11 percent), Denmark (11 percent), and the rest from United Kingdom, Kazakhstan, and Algeria. Petroleum comprises 24 percent of Finnish energy consumption. Most of petroleum is used in vehicles, but about 260,000 homes are heated by heating oil.
Neste Oil is the sole oil refiner in Finland, exporting petroleum products such as gasoline and fuel oil to Baltic countries and North America. Oil imports were valued at 6.5 billion euros and exports 3 billion euros in 2006.[30]
Nuclear power
As of 2008, Finland's nuclear power program has four nuclear reactors in two power plants. The first of these came into operation in 1977.[31] In 2000–2014 the four units have produced annually 21.4–22.7 TWh electricity, which has been 27–35% of energy production and 24–28% of energy consumption in Finland.[32] They are among the world's most efficient, with average capacity factors[33] of 94% in the 1990s.[34] A fifth nuclear reactor is under construction in Olkiluoto Nuclear Power Plant. The unit is expected to start up by 2019.[35]
If all planned projects are completed, the share of electricity produced by nuclear could double by 2025, reaching around 60%.[36]
Russian Rosatom is the major owner of future nuclear plant Fennovoima with a share of 34%. Finnish municipals and cities are also major owners.
Coal
Coal is imported from Russia and Poland. 5.6 million tonnes were used in 2007.
According to Finnwatch (27 September 2010) there are 13 coal power plants in Finland. The companies Pohjolan Voima, Fortum, Helsingin Energia and Rautaruukki consume coal most. According to the statistics of the Customs 18.3 million tonnes of coal was imported in Finland between 2007–2009 from: 72.5% Russia; 7.3% USA; 6.6% Canada; 5.9% Australia; 3.0% Poland, 1.4% South Africa; 1.3% Colombia and 1.1% Indonesia. The majority of Finnish coal is mined in the Kuznetsk Basin of the Kemerovo Oblast, Russia.[37]
The Finnish companies know the country of origin of coal. The specific mine of origin is not always known, especially for the coal blends. According to the Finnwatch inquiry in 2010 none of the Finnish companies have yet made a commitment to give up coal consumption. Based on new investments, companies reported the following reductions in their future coal use: Helsingin Energia −40% by 2020, Lahti Energia several tens of % by 2012 and Vantaan Energia −30% by 2014.[37]
The ILO Agreement 176 (1995) addresses health and safety risks in mines.[38] Finland ratified the agreement in 1997. However, as of 2017 the agreement was not ratified in the following countries that export coal to Finland: Canada, Australia, Colombia, Kazakhstan, Indonesia and China.[39] At least two companies in Finland reported (2010) using the UN Global Compact initiative criteria in their supplier relationships. No Finnish company reported signing the UN Global Compact Initiative. According to the DanWatch report "The Curse of Coal" Danish DONG Energy and Swedish Vattenfall have underlined UN Global Compact Initiative.[37][40]
Natural gas
In 2010 the share of gas in Total Primary Energy Supply (TPES) was about 10%. Finland was 100% dependent on a single supplier in gas, namely Russia, and there is no gas storage capacity. However, in Finland, gas is essentially never used in direct heating of homes, which are heated by direct electric heating, oil or district heating. 75% of gas is used for production of electricity or combined heat and power and in industry, with domestic use being rare. In total, 93% of the gas is sold to large installations directly rather than by retail.[41] In Helsinki, however, there are 30,000 network-connected domestic gas users and 300 restaurants. There is an alternative fuel obligation, so that in the event of a gas supply disturbance, other fuels can be immediately substituted. The gas distribution network reaches only the southeastern coast, with the northernmost point at Ikaalinen.
The neighbouring country Sweden was 100% dependent on Danish gas in 2010. The share of gas in Sweden was lower than in Finland, 3.5% in 2009 (13 Twh gas /376 Twh total final use).[42] The gas dependency in Finland and Sweden was less than in average in OECD countries in 2010. 16 out of 28 IEA member countries are dependent on gas over 20% in TPES.[43]
Natural gas has been used since 1974 after the first oil crisis.[44] Gasum is the Finnish importer and seller of natural gas, which owns and operates Finnish natural gas transmission system. Natural gas vehicles aren't popular in Finland, but natural gas powered busses exist.
Peat
Peat and hard coal are the most harmful energy sources for global warming in Finland. According to VTT studies, peat is often the most harmful one.[45]
Peat was the most popular energy source in Finland for new energy investments 2005–2015. The new energy plants in Finland starting 2005–2015 have as energy source: peat 36% and hard coal 11%: combined: 47%. The major carbon dioxide emitting peat plants during 2005–15 were expected to be (CO2 kt): PVO 2700 kt, Jyväskylän Energia 561 kt, Etelä-Pohjanmaan Voima Oy (EPV Energia) 374 kt, Kuopion Energia 186 kt, UPM Kymmene 135 kt and Vapo 69 kt. EPV Energy is partner in TVO nuclear plants and Jyväskylän and Kuopion Energia partners in Fennovoima nuclear plants in Finland.[46]
According to IEA country report the Finnish subsidies for peat undermine the goal to reduce CO2 emissions and counteracts other environmental policies and The European Union emissions trading scheme. IEA recommends to adhere to the timetable to phase out the peat subsidies in 2010. "To encourage sustained production of peat in the face of negative incentives from the European Union's emissions trading scheme for greenhouse gases, Finland has put in place a premium tariff scheme to subsidise peat. The premium tariff is designed to directly counter the effect of the European Union's emissions trading scheme".[47]
Hydropower
Finland has more than 330 hydro power plants, with total production of 3100 megawatts.
Renewable energy
Energy companies have no renewable energy obligations in Finland.
The share of renewable energy in per cent in Finland was 28% in 2012 and 25% in 2000. The share of renewable energy 5 years average 2006–2010 was 24.7 % and 10 years average 2001–2010 was 26.0 %. The EU set target for Finland (38%) by 2020 was reached in 2014, and in 2015 39.3% of consumed energy was renewable (or 35% based on national calculation: i.e. 454,6 PJ (renewable energy)/ 1306,3 PJ (total energy consumption)). The new target value for renewable energy set by Finland is 50% by 2030 (based on end consumption values). The share of renewable energy in Finland:[48][49]
- 1990 18.2%
- 1995 21.3%
- 2000 24.6%
- 2005 24.8%
- 2010 27.1%
- 2015 39.3% (35%)
The total renewable energy generating capacity has increased in Finland during the 2010s (in 2010: 5,170 MW; 2016: 7,067 MW). In 2016 the estimated renewable energy production was over 130 terawatt-hours in Finland.[50]
Renewable energy sources (Statistics Finland, 2015)[50]
- Hydropower, 13,5%
- Small-scale wood combustion, 14%
- Lumber industry black liquor, 31%
- Wood fuel, 28,5%
- Heat pumps, 4%
- Biofuel, 5%
- Other bioenergy, 4%
The renewable energy objectives set by the European Union are 22 percent renewable source electricity and 12 percent renewable of primary energy by 2010 under the European Union directive 2003/30/EC (Directive on the Promotion of the use of biofuels and other renewable fuels for transport) and white paper. This includes the objectives of 40 GW wind power, 3 GW photovoltaics and 5.75 percent biofuels by 2010.
| EU and Finland Wind Energy Capacity (MW)[51][52][53][54] | ||||||||||||||||||||
|---|---|---|---|---|---|---|---|---|---|---|---|---|---|---|---|---|---|---|---|---|
| No | Country | 2016 | 2015 | 2014 | 2013 | 2012 | 2011 | 2010 | 2009 | 2008 | 2007 | 2006 | 2005 | 2004 | 2003 | 2002 | 2001 | 2000 | 1999 | 1998 |
| – | EU-28 (27) | 153,730[55] | 141,726[55] | 128,751[56] | 117,289 | 105,696 | 93,957 | 84,074 | 74,767 | 64,712 | 56,517 | 48,069 | 40,511 | 34,383 | 28,599 | 23,159 | 17,315 | 12,887 | 9,678 | 6,453 |
| 18 | Finland | 1,539[55] (1,533)[57] | 1,011[55] (1,005)[58] | 627[56] | 448 | 288 | 197 | 197 | 146 | 143 | 110 | 86 | 82 | 82 | 52 | 43 | 39 | 39 | 39 | 17 |
Environmental effects
Global warming
In 2008, Finland's greenhouse gas emissions totalled 70.1 million tons of carbon dioxide (CO2e). A little over three-quarters of them were based on energy or released from the energy sector.[59]
The carbon dioxide emissions by fossil fuels in 2008 originated from 45% oil, 39% coal and 15% natural gas. In the year 2000 the shares were nearly equal: 48% oil and 37% coal. The fossil traffic fuels: motor petrol, diesel and aviation petrol are oil products. The biomass included 47% of black liquer and 52% of wood in 2008. These shares were practically same during 1990–2006. All biomass and agricultural warming gas emissions are free of charge in the EU emissions trading in 2008–2012. According to the official statistics the annual fossil fuel and coal emissions in Finland have large annual variation. E.g. the fossil fuel CO2 emissions dropped 18% in the year 2005 and 13% in 2008, but the annual coal emissions increased 22% in 1996, 22% in 2001 and 58% in 2006.
According to the energy statistics the major changing factors for the annual emission changes were the consumption of coal and peat. In 2006 the hard coal increase was 92% subject to industry (including energy producing industry) separate electricity generation from hard coal. At the same time the controversial peat consumption was increased. The district heating used 42% of hard coal in average 1990–2006, but its annual variation was small compared to the industry separate electricity generation.[60]
| Carbon Dioxide Emissions by Fuels[61] | ||||||
|---|---|---|---|---|---|---|
| mil. t CO2 | % of fossil fuels total | |||||
| Year | Biomass | Fossil | Coal | Oil | N. gas | Traffic |
| 1990 | 19.3 | 53.0 | 38 | 31 | 9 | 22 |
| 2000 | 29.4 | 53.1 | 37 | 26 | 15 | 22 |
| 2004 | 32.9 | 64.3 | 45 | 21 | 14 | 20 |
| 2005 | 30.7 | 52.8 | 35 | 25 | 16 | 24 |
| 2006 | 34.5 | 64.1 | 45 | 20 | 14 | 20 |
| 2007 | 33.0 | 61.8 | 45 | 21 | 13 | 21 |
| 2008 | 33.1 | 53.7 | 39 | 22 | 15 | 24 |
| Coal: Hard coal, other coal and peat Other coal: coke, blast furnace gas, coke oven gas, coal tar, and other non-specified coal | ||||||
| Carbon Dioxide Emissions by Fuels: Coal[61] | |||||||
|---|---|---|---|---|---|---|---|
| mil. t CO2 | % of fossil total | ||||||
| Fossil | Hard coal | Other coal | Peat | Coal total | Peat | Coal total | |
| 1990 | 53.0 | 12 | 3 | 6 | 20.1 | 10.6 | 37.9 |
| 2000 | 53.1 | 9 | 4 | 7 | 19.4 | 12.2 | 36.5 |
| 2004 | 64.3 | 16 | 4 | 9 | 28.7 | 14.5 | 44.6 |
| 2005 | 52.8 | 8 | 4 | 7 | 18.3 | 13.6 | 34.7 |
| 2006 | 64.1 | 15 | 4 | 10 | 28.9 | 15.3 | 45.1 |
| 2007 | 61.8 | 13 | 4 | 11 | 27.4 | 17.3 | 44.3 |
| 2008 | 53.7 | 9 | 3 | 9 | 20.7 | 15.8 | 38.5 |
| Other coal: coke, blast furnace gas, coke oven gas, coal tar and other non-specified coal | |||||||
Particulates
Particulate, the size of which is from a few nanometers to visible dust particles, are considered the most important environmental factor affecting human life. About half of particulates are of anthropogenic origin: traffic, industry and energy production. In Finland, the most important source is burning wood as fuel.[62] Also the NO2 and SO2 gases become particulates in the atmosphere.[63][64]
Energy policy
The objective of RE (2005) of electricity was 35% (1997–2010). However, (2006) the Finnish objective was dropped to 31.5% (1997–2010). According to 'Renewables Global Status Report' Finland aims to increase RE only 2% in 13 years. This objective to add the RE use with 2% in 13 years is among the modest of all the EU countries.[65]
The public energy subsidies in Finland in 2013 were €700 million for fossil energy and €60 million for renewable energy (mainly wood and wind).[66] An increased feed-in tariff was used for new wind power industry in 2011 to 2015.[67]
References
- "Energy consumption no longer increasing". Environment.fi. Retrieved 15 January 2017.
- "Final consumption". Motiva. Archived from the original on 13 September 2016. Retrieved 16 January 2017.
- IEA Key World Energy Statistics Statistics 2015, 2014 (2012R as in November 2015 + 2012 as in March 2014 is comparable to previous years statistical calculation criteria, 2013, 2012, 2011, 2010, 2009 Archived 7 October 2013 at the Wayback Machine, 2006 Archived 12 October 2009 at the Wayback Machine IEA October, crude oil p.11, coal p. 13 gas p. 15
- Energy in Sweden 2010 Archived 16 October 2013 at the Wayback Machine, Facts and figures, The Swedish Energy Agency, Table 8 Losses in nuclear power stations Table 9 Nuclear power brutto
- Energy in Finland statistics, Statistics of Finland (Peat TWh)
- US Department of Energy's Carbon Dioxide Information Analysis Center (CDIAC) based on the United Nations Statistics Division, List of countries by carbon dioxide emissions per capita
- Energy statistics 2006, Finnish statistical center, Tilastokeskus, energiatilasto, Vuosikirja 2006.
- Greenhouse gas emissions in Finland 1990–2005 Archived 16 November 2010 at the Wayback Machine National Inventory Report to the UNFCCC 15 April 2007, Finnish statistics
- "Helen's new service enables improved energy efficiency in properties throughout Finland". 19 March 2019.
- "Finnish Energy: Carbon emissions from district heat production at a historic low – 2017 record year also in recovered heat". 23 February 2019.
- Hakala, Jonna. "Statistics Finland -". Stat.fi. Retrieved 24 December 2017.
- Energy consumption in households 2008–2011, GWh 16 November 2012 Statistics Finland
- "Clean DHC discussion paper" (PDF). September 2018.
- "New heat pump to be built again in Helsinki". 18 June 2018.
- "New, unique heat pump utilising sea water heat to be built in Vuosaari". 4 April 2019.
- "Helen invests in renewable energy and closes Hanasaari power plant: Helen's Hanasaari power plant will be closed by the end of 2024. Heat production will be replaced with heat recycling with heat pumps, energy storage, and a bioenergy heating plant planned for Vuosaari". 4 March 2019.
- "Gigantic cavern heat storage facility to be implemented in Mustikkamaa in Helsinki". 22 March 2018.
- "The world's first seasonal energy storage facility of its kind is planned for the Kruunuvuorenranta rock caverns". 30 January 2018.
- https://www.st1.eu/geothermal-heat
- https://www.st1.eu/Stimulation-stage-of-St1s-geothermal-project-successfully-completed
- "Joukkoliikenne nousuun!" –mietintö, Liikenne- ja viestintäministeriö 2004
- Tammi-syyskuussa Suomeen tuotiin erilaisia energiatuotteita 5,0 miljardin euron arvosta, joka oli 15 prosenttia vähemmän kuin vuotta aiemmin. Niitä tuotiin eniten Venäjältä, jonka osuus tuonnin arvosta oli 64 prosenttia. Energiatuotteita vietiin 2,8 miljardin euron arvosta, joka oli prosentin enemmän vuotta aiempaan verrattuna. Vientiä oli eniten OECD-maihin, joiden osuus viennin arvosta oli 78 prosenttia. Öljyn maailmanmarkkinahinnan lasku on vaikuttanut energiatuotteiden tuonnin arvon supistumiseen.
- Electricity Supply and Demand Motiva 19.11.2019
- Hallitus antaa Carunan verovälttelyn jatkua Finnwatch 26 October 2018
- Preliminary Energy Statistics 2009 Finnish statistical center 24 March 2010, Table 3.3.1. Consumption of energy sources in electricity generation by mode of production 2009 (preliminary information)
- Wanhatalo, Pentti. "Statistics Finland - Energy supply and consumption". Stat.fi. Retrieved 24 December 2017.
- Komissio vaatii Suomelle yli 30 000 euron päivittäistä uhkasakkoa yle 12 March 2013
- "Renewables 2014 Global Status Report, page 119" (PDF). Ren21.net. Retrieved 24 December 2017.
- "Metsähaketta käytettiin 8,7 miljoonaa kuutiometriä vuonna 2013 – uusi ennätys" (PDF). Metla.fi. Retrieved 24 December 2017.
- "Öljy- ja biopolttoaineala ry - Öljy- ja biopolttoaineala ry". Oil-gas.fi. Retrieved 24 December 2017.
- "Country profiles: Finland". Nea.fr. Retrieved 24 December 2017.
- "Sähkön hankinta energialähteittäin 1990–2014". Statistics Finland.
- The capacity factor is the energy produced in a year by a power plant as a percentage of the energy it would have produced had it been operating at full capacity for the entire year.
- "Nuclear Energy in Finland - Finnish Nuclear Power - World Nuclear Association". World-nuclear.org. Retrieved 24 December 2017.
- Olkiluoto 3 begins instrumentation and control tests World Nuclear News 14 January 2016
- "Energy Policies of IEA Countries, Statistics : Energy Policies of IEA Countries : Energy Policies of IEA Countries: Finland 2013". Oecd-ilibrary.org. Retrieved 24 December 2017.
- Kivihiilta_idasta_ja_etelasta.pdf Kivihiiltä idästä ja etelästä Vastuullisuus energiayhtiöiden ostoissa FinnWatch 3/2010 (27 September 2010) pages 4–12, page 5 Table of coal imports in 2007–2009 (include www references)(in Finnish)
- "C176 - Safety and Health in Mines Convention, 1995 (No. 176)". International Labour Organization. Retrieved 17 November 2017.
- "Ratifications of C176 - Safety and Health in Mines Convention, 1995 (No. 176)". International Labour Organization. Retrieved 17 November 2017.
- "Kunstudstilling: Ingen protest er forgæves - Danwatch". Danwatch.dk. Retrieved 24 December 2017.
- "Archived copy". Archived from the original on 18 April 2014. Retrieved 17 April 2014.CS1 maint: archived copy as title (link)
- Energy in Sweden 2010, Facts and figures Archived 16 October 2013 at the Wayback Machine Table 7
- Gas emergency policy: Where do IEA countries stand? IEA May 2011, figures
- "Öljy- ja biopolttoaineala ry - Öljy- ja biopolttoaineala ry". Oil-gas.fi. Retrieved 24 December 2017.
- Jyri Seppälä, Kaisu Aapala, Kimmo Silvo and Raimo Heikkilä 2008: Muistio Suomen IPCC-ryhmän avoimesta Turpeen ilmastovaikutusten arviointi -seminaarista. Suomen ympäristökeskus.
- Saastuttaminen kannattaa, selvitys energiainvestoinneista 2005–2010 Greenpeace 2009 pp. 14–15 if two owners, the emission is divided between them undepended of the actual share of the plant
- "IEA - 404 Not Found". Iea.org. Archived from the original on 25 December 2017. Retrieved 24 December 2017.
- "Energy in Sweden 2012. Facts and figures" (PDF). Energimyndigheten.se. Archived from the original (PDF) on 24 September 2015. Retrieved 24 December 2017.
- Timo Määttä (20 October 2017). "Uusiutuva energia Suomessa". Motiva, motiva.fi.
- "New record for renewable energy production in Finland". investinfinland.fi. 14 February 2017. Retrieved 1 November 2017.
- EWEA Staff (2010). "Cumulative installed capacity per EU Member State 1998 – 2009 (MW)". European Wind Energy Association. Retrieved 22 May 2010.
- EWEA Staff (February 2011). "EWEA Annual Statistics 2010" (PDF). European Wind Energy Association. Retrieved 31 January 2011.
- EWEA Staff (February 2012). "EWEA Annual Statistics 2011" (PDF). European Wind Energy Association. Retrieved 18 February 2011.
- Wind in power: 2012 European statistics February 2013
- "Wind in power. 2016 European statistics" (PDF). Wind Europe, windeurope.org. February 2017. Retrieved 1 November 2017.
- EWEA Staff (February 2015). "Wind in power. 2014 European statistics" (PDF). European Wind Energy Association. Retrieved 1 November 2017.
- "Tuulivoimavuosi 2016 toi Suomeen lähes miljardin investoinnit". Suomen Tuulivoimayhdistys ry, tuulivoimayhdistys.fi. 23 January 2017. Retrieved 1 November 2017.
- "Ennätyksellinen tuulivoimavuosi 2015 - tuplattu tuotanto ja jätti-investoinnit". Suomen Tuulivoimayhdistys ry, tuulivoimayhdistys.fi. 20 January 2016. Retrieved 1 November 2017.
- "Emissions in 2008". Climate Guide. Retrieved 15 January 2017.
- Energy Statistics 2007: Table 2.4.1 Consumption of Hard Coal
- Energy Statistics Yearbook 2009, Carbon Dioxide Emissions by Fuels Table 11.3.1, Statistics Finland 2010
- Pienhiukkaset tunkeutuvat hengitysteihin - vuosittain jopa 1300 ennenaikaista kuolemaa Suomessa Savon Sanomat
- "ilmanlaatu.fi - Pienhiukkaset PM2.5". Ilmanlaatu.fi. Retrieved 24 December 2017.
- "Ilman epäpuhtauksien päästöt Suomessa - ymparisto.fi". Ymparisto.fi. Retrieved 24 December 2017.
- 2005: Record year for investments in renewable energy REN21 Archived 18 March 2009 at the Wayback Machine"Renewables Global Status Report 2006 Update", REN21. 2006. (Paris: REN21 Secretariat and Washington, DC:Worldwatch Institute).
- Simo sai jättimäiset tuulivoimalat HS 3.4.2014 A10
- Takuuhintajärjestelmä Suomessa Archived 10 December 2016 at the Wayback Machine Tuulivoimayhdistys
External links
- Finland’s National Energy Efficiency Action Plan (NEEAP 2008–2010) 26 June 2007
- Findicator - Energy consumption 1970-2012
- Findicator - Final energy consumption by sector 1970-2012
| Wikimedia Commons has media related to Energy in Finland. |
| History |  | ||||
|---|---|---|---|---|---|
| Geography | |||||
| Politics | |||||
| Economy | |||||
| Society |
| ||||
| |||||