Energy in Denmark
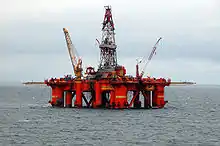
Denmark has considerable sources of oil and natural gas in the North Sea and ranked as number 32 in the world among net exporters of crude oil in 2008.[1] Denmark expects to be self-sufficient with oil until 2050.[2] However, gas resources are expected to decline, and production may decline below consumption in 2020, making imports necessary.[3] Denmark imports around 12% of its energy (this statistic includes all forms of energy, not just electricity).[4]
Denmark has drastically decreased[5][6] production of electricity from coal, and in 2019 it constituted less than 11% of the electricity production. Coal and all other fossil fuels, plus waste burned for electricity, amounted to 20% of the electricity production. The other 80% of the electricity produced came from renewables: wind power (57%; see wind power in Denmark), biomass and other combustible renewables (20%) and solar power (3%).[7]
Denmark is a net importer of electricity: domestic production of electricity was equal to 83% of the total consumption, while net imports were 17% of the total consumption.[7] The electricity Denmark imported came in large part from hydroelectricity and nuclear power (both being low-carbon sources). As a result, Denmark used hydroelectricity despite domestic production of it being close to zero;[7] and part of the electricity consumed (3-4% according to older data) came from nuclear power,[8][9] despite the country having no nuclear power stations.
In February 2011 the Danish government announced the "Energy Strategy 2050" with the aim to be fully independent of fossil fuels by 2050,[10] and a new government repeated the goal in 2015 despite public scepticism.[11] The European Renewables Directive set a mandatory target at 20% share of energy from renewable sources by 2020 (EU combined).[12][13] In 2012 the Danish government adopted a plan to increase the share of electricity production from wind to 50% by 2020,[14][15] and to 84% in 2035;[16] this was later changed to a broader 100% renewable electricity by 2030 target.[17][18]
Denmark's electrical grid is connected by transmission lines to other European countries,[19] and had (according to the World Economic Forum) the best energy security in the EU in 2013[20] although this had fallen to third in the EU by 2014.[21]
History
In 1972, 92% of Denmark's energy consumption came from imported oil.[22] The 1973 oil crisis forced Denmark to rethink its energy policy; in 1978 coal contributed 18%, and the Tvind wind turbine was built, along with the creation of a wind turbine industry.[23] The 1979 energy crisis pushed further change, and in 1984 the North Sea natural gas projects began.[24] The North Sea production of oil and gas made Denmark self-sufficient in 1997,[25] peaking in 2005,[26] and decreased below self-sufficiency by 2013.[27] In 2015 Denmark produced 89% of its energy consumption of 720-756 PJ.[6]
The year 2014 was the warmest on record in Denmark, with the lowest number of degree days in history. A normal year has 2,906 while 2014 saw only 2,100 degree days.[28] Since 2000, Denmark has increased Gross National Product and decreased energy consumption.[29]
Overview
| External images | |
|---|---|
Energy statistics
| Population (million) |
Prim. energy (TWh) |
Production (TWh) |
Export (TWh) |
Electricity (TWh) |
CO2-emission (Mt) | |
|---|---|---|---|---|---|---|
| 2004 | 5.40 | 233 | 361 | 117 | 35.8 | 50.9 |
| 2007 | 5.46 | 229 | 314 | 64 | 36.4 | 50.5 |
| 2008 | 5.49 | 221 | 309 | 54 | 35.5 | 48.4 |
| 2009 | 5.52 | 216 | 278 | 43 | 34.5 | 46.8 |
| 2010 | 5.55 | 224 | 271 | 42 | 35.1 | 47.0 |
| 2012 | 5.57 | 209 | 244 | 19 | 34.1 | 41.7 |
| 2012R | 5.59 | 202 | 221 | 8 | 33.8 | 37.1 |
| 2013 | 5.61 | 203 | 196 | -26 | 33.9 | 38.8 |
| Change 2004-10 | 2.8% | -4.1% | -24.8% | -63.6% | 0.0% | -7.7% |
| Mtoe = 11.63 TWh. Primary energy includes energy losses.
2012R = CO2 calculation criteria changed, numbers updated | ||||||
| Unit: petajoules (PJ) | 1980 | 1990 | 2000 | 2005 | 2010 | 2012 | 2013 | 2014 | 2015[32] | 2016[33] | 2017[32] | 2018[34] |
|---|---|---|---|---|---|---|---|---|---|---|---|---|
| Total | 814 | 819 | 839 | 850 | 814 | 782 | 763 | 755 | 760 | 770 | 772 | 781 |
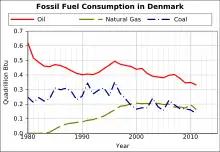
| Oil | 546 | 355 | 376 | 352 | 312 | 289 | 278 | 276 | 284 | 280 | 286 | 288 |
| Natural gas | 0 | 82 | 192 | 192 | 176 | 149 | 138 | 127 | 133 | 131 | 125 | 121 |
| Coal[lower-alpha 1] | 241 | 327 | 175 | 166 | 147 | 146 | 143 | 137 | 108 | 116 | 92 | 98 |
| Waste, non-renewable | 5 | 8 | 14 | 17 | 16 | 17 | 17 | 18 | 18 | 18 | 18 | 18 |
| Renewable energy | 22 | 48 | 81 | 123 | 163 | 180 | 186 | 196 | 219 | 225 | 252 | 257 |
Energy taxes
| Diesel | Gasoline | Natural gas | Coal | Electricity | |||
|---|---|---|---|---|---|---|---|
| per unit | liter | liter | m3 | MWh | tonne | GJ | MWh |
| Excise | 2.660 | 4.137 | 2.158 | 176.6 | 1,6051 | 54.5 | 8781 |
| Environment | 0.420 | 0.388 | 0.384 | 31.4 | 413.51 | 0 | |
1Not applicable for industry
Fuel is not taxed for ships and planes to other countries. Coal and gas for electricity is not taxed.[38]
Minor taxes are called "Compulsory storage fee" and "NO
x tax". Carbon dioxide tax is 0.09 DKK/kWh for electricity. Fossil fuels are taxed at about 90 DKK/ton CO2.[39]
| Oil | Gasoline | Natural gas | Coal | Electricity | |
|---|---|---|---|---|---|
| Excise | 9.3 | 7.3 | 3.3 | 2.5 | 11.7 |
Energy taxes contributed 34 billion DKK in 2015, about 12% of overall taxing revenue.[40] The money is a considerable income for the state, and changing the composition of the taxes towards a "greener" mix is difficult. According to a government official, the majority of taxes are not based on environment concerns,[41] in contrast to the DKK 5 billion per year in PSO-money for cleaner energy, paid by electricity consumers to producers of clean electricity. These tolls are not available for government consumption.[42]
Energy sources
Coal
Denmark has drastically reduced the role of coal in both electricity generation and district heating. Less than 11% of the electricity produced in the country came from coal (2019)[7] and only about 12% of the energy used for district heating came from coal and oil combined (2017).[43]
This is a radical change, considering that coal provided 48.0% of the electricity and 22.0% of the heat in district heating in Denmark in 2008; and in total provided 21.6% of total energy consumption (187 PJ out of 864 PJ).[44] The coal is mainly imported from outside Europe.[45] Consumption of coal was more than halved over the 10 years between 2004-2014.[5][6] Coal constituted 41% of the mass fuels (not wind and sun) in 2015, and is expected to decrease to 14% in 2025, mostly replaced by biofuels.[46][47]
Oil
- Production
The production of crude oil fell from 523 PJ in 2010 to 470 PJ in 2011. As of May 2014, Denmark produced an average of 172 kbpd.[48] Danish oil companies donate DKK 1 billion over 10 years to Technical University of Denmark to increase production. Danish oil reserves are expected to run out around 2047.[49]
- Consumption
Consumption fell from 315 to 306 PJ during 2011.[50] Official statistics estimate 231,000 residences heated by oil in 2014 (down from 328,000 in 2013), but only 87,000 actually purchased oil during 2014.[51]
Natural gas
The production of natural gas fell from 307 PJ in 2010 to 265 PJ in 2011. Consumption fell from 187 to 157 PJ.[50]
CO2 emissions from energy production fell from 49.4 to 44.3 million tons, from 2010 to 2011,[50] a decline of 10%.[52]
Natural gas was responsible for 6% of the country's electricity production (2019);[7] in district heating, it had a 20% share of the energy mix (2017).[43]
Biomass
The role of biomass grew as Denmark was phasing out fossil fuels, particularly coal. 20% of electricity produced in Denmark came from biomass (2019), more than from coal and natural gas combined.[7]
In district heating, use of biomass and biodegradable waste was one of multiple factors which helped bring down the share of fossil fuels and (non-biodegradable) waste to under 40% of the energy mix.[43]
Denmark consumed 2.1 million tonnes of wood pellets in 2014, expected to increase by 1.2 million tonnes as more coal is replaced. They are mainly imported from the Baltic states and Russia. Denmark also burns wood chips and straw, mostly for heating.[53]
Solar
Denmark had 790 MW of photovoltaic capacity in late 2015,[54] and already reached its year 2020 governmental goal of installing 200 MW in 2012.[55] As of 2013, the total PV capacity from 90,000 private installations amounts to 500 MW.[56] Danish energy sector players estimate that this development will result in 1000 MW by 2020 and 3400 MW by 2030.[55]
Solar heating is installed in some homes,[57] and also used in district heating.[58]
Geothermal
Denmark has three geothermal district heating plants; a 7 MW in Thisted started in 1988, a 14 MW in Copenhagen started in 2005, and a 12 MW in Sønderborg in 2013.[59][60] They may combine with biomass burning, but produce no electricity, as temperatures are too low to run a typical steam turbine; they are used for heating instead.[61]
Electricity
| External images | |
|---|---|
The electricity sector relies mainly on renewable energy. 80% of the electricity produced in the country came from renewables: 57% from wind power, 20% from biomass and other combustible renewables, and 3% from solar power.
Other sources of electricity produced domestically were: coal (10.5%), natural gas (6%), oil (under 1%) and other combustibles (2.5%).[7]
Denmark is a net importer of electricity; domestic electricity production was equal to 83% of the consumption, and net imports were 17% of the consumption.[7] Imported electricity is also mostly low-carbon, although from different sources than domestic production: for example, the country imports hydroelectricity from Norway, and hydroelectricity and nuclear power (with other sources possibly in the mix) from Sweden.
Almost no hydro and no nuclear power is produced domestically, and other countries' hydro, thermal and wind/solar power is used for buffering Denmark's renewable generation. The average consumption of electricity per person was 0.8 GWh less than EU 15 average in 2008. Denmark invested in the wind power development in the 1970s and has been the top wind power country of the world ever since. Danish consumption of wind electricity has been highest in the world per person: 1,218 kWh in 2009. Denmark produced more wind power per person in 2009 than Spain or the UK produced nuclear power.
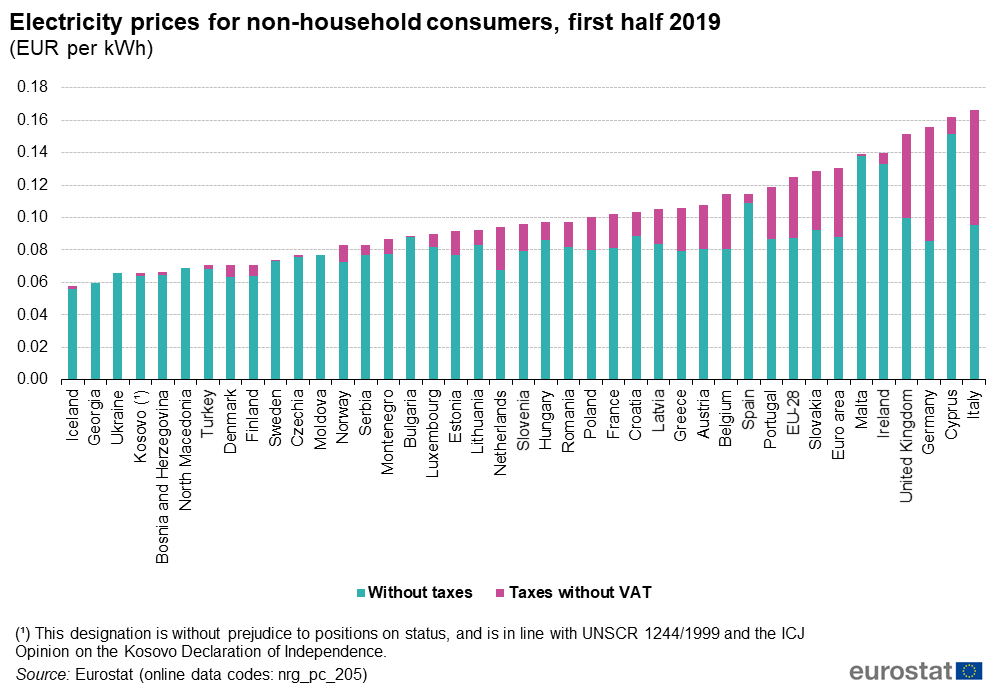
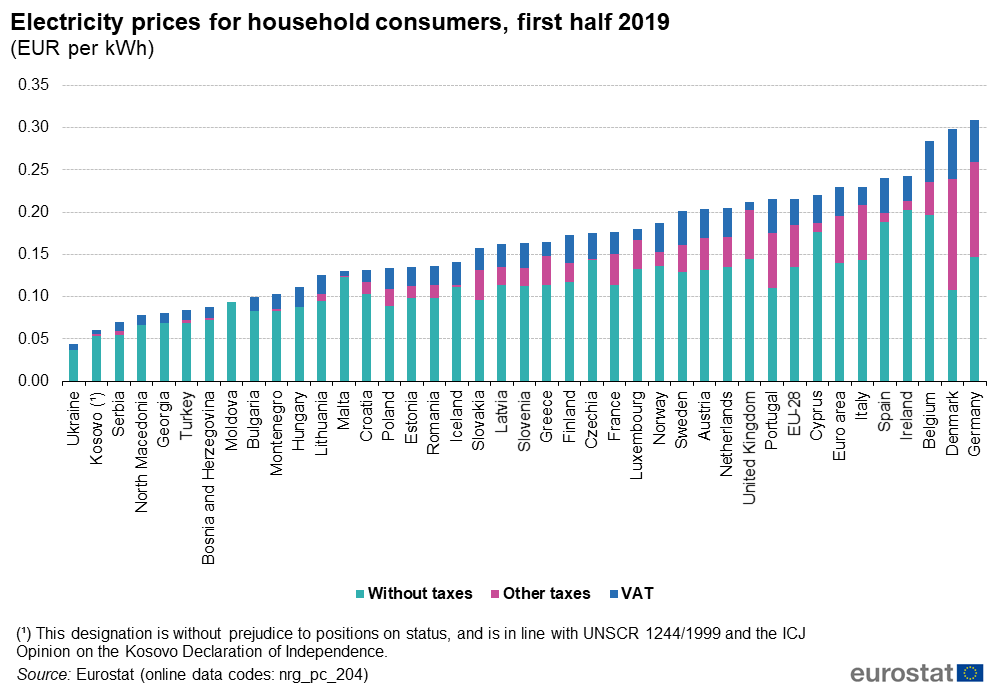
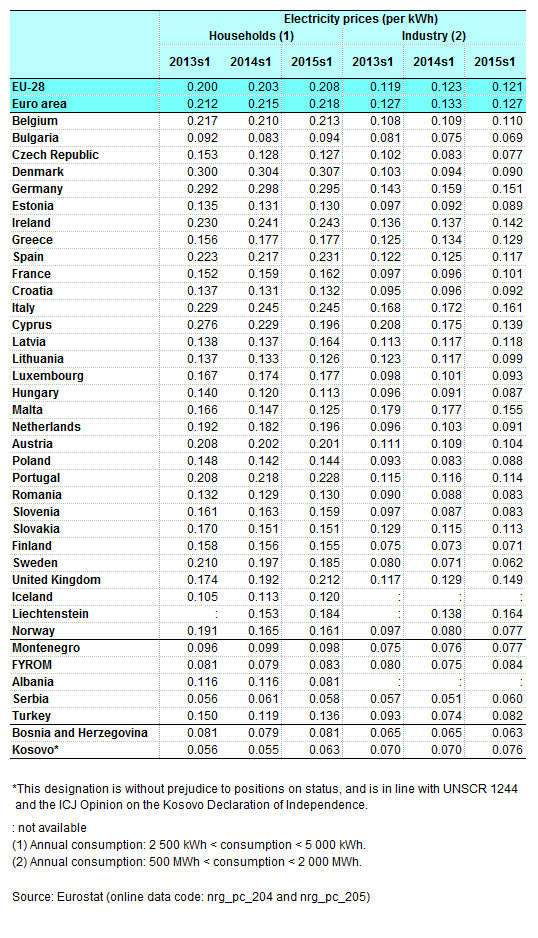
Denmark has average electricity costs (including about DKK 5 billion in costs for cleaner energy)[42] in EU for industries at 9 eurocent/kWh,[62][63][64][65] but general taxes increase the household price to the highest in Europe at 31 eurocent/kWh.[62][66]
Transmission costs are around 1c/kWh, and support regimes cost 2½ c/kWh in 2014.[67]
Wind power
Wind provided 57% of the electricity generated in Denmark in 2019,[7] and at least 47% of Denmark's total electricity consumption in 2019.[7] Denmark is a long-time leader in wind energy, and as of May 2011 Denmark derives 3.1 percent of its Gross Domestic Product from renewable energy technology and energy efficiency, or around €6.5 billion ($9.4 billion).[68][69]
To encourage investment in wind power, families were offered a tax exemption for generating their own electricity within their own or an adjoining commune. While this could involve purchasing a turbine outright, more often families purchased shares in wind turbine cooperatives which in turn invested in community wind turbines. By 2004 over 150,000 Danes were either members of cooperatives or owned turbines, and about 5,500 turbines had been installed, although with greater private sector involvement the proportion owned by cooperatives had fallen to 75%.
Nuclear power
The production of nuclear energy has been banned in Denmark since 1985. In 2014 and 2015, (imported) nuclear power was 3–4% of electricity consumption in Denmark.[8] An average of 10% of domestic energy consumption comes from imports from neighboring countries Sweden and Germany, which both generate nuclear power.[70] In Sweden, about 40% of the energy is generated by nuclear power[71] and in Germany less than 20% by nuclear power.[72] In 2011, with imports of 2.9 TWh from Germany and 5.2 TWh from Sweden, about 3.5TWh used was from countries that generate nuclear power – nearly 11% of total final consumption. This fluctuates year to year, mainly due to hydro reservoir levels via NordPool prices, and analysis showed 1% from countries that generate nuclear power in 2010, 7% in 2011 and 14% in 2012.[70]
District heating
| External image | |
|---|---|
Danish district heating plants use 100 Petajoule/year,[73] mostly waste heat from thermal power plants burning coal, natural gas and biomass, but a small part of this consumption is from electrode boilers[74] or heat pumps.[75][76] Expansion of wind powered district heating is calculated to be economically efficient without taxes.[77][78] The peak thermal load of district heating in Copenhagen is 2.5 GWth, and simulations suggest a potential heat pump would run 3,500 load-hours per year using sewage water as the heat reservoir.[79]
In 2013, Denmark imported 158,000 ton garbage for incineration in 10 district heating plants,[80] increasing to 323,963 ton in 20 plants in 2015, about 10% of burnt waste.[81]
The pipe heat loss is 17%, at a value of DKK 150 million. New pipes have a heat loss of 6.5%. There are 60,000 km of pipes, serving 1.6 million households.[82] Several towns use central solar heating, some with storage.[58][83]
Transport
Denmark aims to focus on intelligent battery systems (V2G) and plug-in vehicles in the transport sector.[84]
Tax revenue from vehicles was 28 billion DKK in 2014.[40]
Cities
Copenhagen has a target to be carbon-neutral by 2025,[85] and has burned more biomass and less coal during 2004-2014.[86]
See also
References
- Including coke for 1980 and 2015–2018.
- "EIA – International Energy Data and Analysis for Denmark". Tonto.eia.doe.gov. 15 May 2009. Archived from the original on 4 March 2010. Retrieved 29 May 2009.
- Unforeseen billions from North Sea Archived 2012-05-02 at the Wayback Machine Maritime, 4 December 2011. Accessed: 8 December 2011.
- Andersen, Christian Meiniche. Gas supply 2011-2013 Archived 2011-01-24 at the Wayback Machine page 17 Energinet.dk. Accessed: 8 December 2011.
- "INFOGRAPHIC: Can Germany's Energiewende ensure supply security?". EurActiv.com. Retrieved 1 February 2017.
- Energy statistics, 2014 Archived 2016-01-21 at the Wayback Machine page 12
- ENERGISTATISTIK 2015, page 3. Quote: "2015 var præget af stor nettoelimport, hvilket hovedsageligt betød et kraftigt fald i forbruget af kul på 35,8%"
- Monthly OECD Electricity Statistics
- "Rekord lav CO2-udledning fra elforbrug i 2015 Archived 2016-03-20 at the Wayback Machine" Energinet.dk, 1 March 2015.
- "More nuclear power flowing through Danish outlets". cphpost.dk. 3 September 2013.
- "Release of Danish Energy Strategy 2050". Danish Ministry of Climate and Energy. 24 February 2011. Retrieved 19 May 2011.
- Danmark er længere med den grønne omstilling end danskerne ved Archived 2016-01-30 at the Wayback Machine Danish Energy Agency, 1 October 2015. Accessed: 24 January 2016.
- "Deal secured on ambitious EU renewables law". EurActiv.com. 9 December 2008. Archived from the original on 2011-06-09.
- EU law - as measured in gross final consumption of energy
- Danish Wind Industry Association, Wind energy Denmark, n.d.
- The Guardian: "Denmark aims to get 50% of all electricity from wind power", 26 March 2012
- Lindboe, page 3
- Jacob Gronholt-Pedersen (2020-01-02). "Denmark sources record 47% of power from wind in 2019". Reuters. Retrieved 2020-08-26.
- James Murray (2020-01-08). "Denmark's wind power vision to make its electricity sector fossil-free by 2030". NS Energy. Retrieved 2020-08-26.
- Gellert, Bjarne Christian. Electricity interconnections Archived 2013-02-09 at the Wayback Machine Energinet.dk, 22 August 2011. Accessed: 6 December 2011.
- "Danish security of supply is number one in the EU Archived 2013-12-27 at the Wayback Machine" Energinet.dk, 11 December 2013. Accessed: 26 December 2013.
- "Global Rankings", Accessed: 30 April 2015.
- "Energiomstilling 2050 : 1972". Danish Energy Agency.
- "Energiomstilling 2050 : 1978". Danish Energy Agency.
- "Energiomstilling 2050 : 1984". Danish Energy Agency.
- "Energiomstilling 2050 : 1997". Danish Energy Agency.
- "Energiomstilling 2050 : 2005". Danish Energy Agency.
- David Roberts (12 March 2016). "Got Denmark envy? Wait until you hear about its energy policies". Vox. Retrieved 26 April 2016.
- Bernth, Martin. "Mildt vejr skærer 20 procent af varmeregningen" Ingeniøren, 5 January 2015. Accessed: 5 January 2015.
- Rasmus Tengvad. Det danske energiforbrug på rekordlavt niveau Archived 2016-01-19 at the Wayback Machine Dansk Energi, 30 January 2015
- IEA Key World Energy Statistics Statistics 2015, 2014 (2012R as in November 2015 + 2012 as in March 2014 is comparable to previous years statistical calculation criteria, 2013, 2012, 2011, 2010, 2009 Archived 2013-10-07 at the Wayback Machine, 2006 Archived 2009-10-12 at the Wayback Machine IEA October, crude oil p.11, coal p. 13 gas p. 15
- Source except where noted: Key Figures from DEA's Preliminary Energy Statistics 2015 (PDF) (Report). Danish Energy Agency. Archived (PDF) from the original on 18 April 2020. Retrieved 18 April 2020.
- Energy in Denmark 2017 (PDF) (Report). Danish Energy Agency. p. 20. Archived (PDF) from the original on 18 April 2020. Retrieved 18 April 2020.
- Energy in Denmark 2016 (PDF) (Report). Danish Energy Agency. p. 16. Archived (PDF) from the original on 31 January 2020. Retrieved 18 April 2020.
- Energy in Denmark 2018 (PDF) (Report). Danish Energy Agency. p. 16. Archived (PDF) from the original on 18 April 2020. Retrieved 18 April 2020.
- ENERGY PRICES AND TAXES, COUNTRY NOTES, 3rd Quarter 2015 Archived January 19, 2016, at the Wayback Machine, page 26. International Energy Agency, 2015
- "CO2-afgiftsloven - Bekendtgørelse af lov om kuldioxidafgift af visse energiprodukter". retsinformation.dk. Retrieved 13 September 2016.
- "Kulafgiftsloven". Danish Ministry of Taxation. 9 March 2016. Archived from the original on 4 April 2016. Retrieved 12 September 2016.
- "SKAT: E.A.4.5.8 Afgiftsfritagelse og afgiftsgodtgørelse". Retrieved 13 September 2016.
uden CO2-afgift til brug om bord i skibe i udenrigsfart, fiskerfartøjer .. Jetfuel kan leveres uden CO2-afgift til brug i luftfartøjer .. fuelolie/naturgas / stenkul, der anvendes til fremstilling af elektricitet i kraftværker og kraftvarmeværker
- "Environmental Taxes in Denmark". Confédération Fiscale Européenne. Archived from the original on 27 April 2016. Retrieved 26 April 2016.
- Afgifter - provenuet af afgifter og moms 2009-2016, Danish Ministry of Taxation, 2015
- "Derfor er omlægning af energiafgifter en svær øvelse". Ingeniøren. Retrieved 17 April 2016.
The main part of tolls are not based on environment concerns
- "Fremskrivning af PSO-udgifter" page 6+17. Danish Energy Agency, 19 May 2014. Retrieved: 17 January 2015.
- https://www.danskfjernvarme.dk/sitetools/english/about-us
- "Energy Statistics 2008" (PDF). Retrieved 2010-07-22.
- Hansen, Jens Morten. "Dänemark - Produktion und Kommunikation - Energie" (in German). The Royal Danish Ministry of Foreign Affairs. Archived from the original on September 27, 2007. Retrieved 17 May 2010.
- "Fuels". Energinet.dk. Archived from the original on 18 October 2016. Retrieved 14 October 2016.
- "Fuel composition diagram, 1990-2025". Archived from the original on 2016-10-18. Retrieved 2016-10-14.
- Danish Production of Oil, Gas and Water for May 2014 Archived 2014-12-05 at the Wayback Machine Danish Energy Agency, May 2014. Accessed: 26 June 2014.
- "Teknologisk spredehagl skal klemme den sidste olie ud af Nordsøen". Ingeniøren. 8 September 2016. Retrieved 8 September 2016.
- Main energy statistics 2011 Danish Ministry of Climate and Energy, 20 March 2012. Accessed: 20 March 2012.
- Wittrup, Sanne. "Halvdelen af landets oliefyr er forsvundet " Ingeniøren, 9 April 2015. Accessed: 9 April 2015.
- Dal, Peter. Large drop in energy and CO2 Archived 2012-03-26 at the Wayback Machine Danish Ministry of Climate and Energy, 20 March 2012. Accessed: 20 March 2012. Quote: ""
- "Archived copy" (PDF). Archived from the original (PDF) on 2016-04-25. Retrieved 2016-04-17.CS1 maint: archived copy as title (link)
- http://ing.dk/artikel/kaempe-solcelleparker-slar-bunden-ud-af-energiforlig-181991
- Denmark reaches 2020-goal for solar energy before time 12.09.2012
- "Follow the solar cells Archived 2013-12-27 at the Wayback Machine" Energinet.dk, 18 December 2013. Accessed: 26 December 2013.
- EurObserv'ER: Solar thermal and concentrated solar power barometer - May 2014 Archived 2014-11-06 at the Wayback Machine
- Wittrup, Sanne (14 June 2015). "Verdens største damvarmelager indviet i Vojens". Ingeniøren. Archived from the original on 2015-10-19. Retrieved 2016-01-26.
- "Geotermisk energi".
- Allan Mahler & Jesper Magtengaard, Proceeding World Geothermal Congress 2005, Geothermal Development in Denmark, Country Update WGC 2005
- "Geothermal Energy Use 2015 Country Update for Denmark" (PDF). Archived from the original (PDF) on 2016-02-25.
- Electricity prices for industrial consumers Eurostat, October 2015
- Electricity prices (table) Eurostat, October 2015
- "Energistyrelsen". Danish Energy Agency.
- Forbedring af den nationale elprisstatistik for erhverv page 7. Danish Energy Agency, 30 June 2015. Note: correction to statistics
- Electricity Prices for Households Energy information administration
- "Energinet.dk holds tariffs down - PSO tariff rises Archived 2013-12-27 at the Wayback Machine" Energinet.dk, 11 December 2013. Accessed: 26 December 2013.
- "Denmark Invests the Most in Clean Energy per GDP". yourolivebranch.org. Archived from the original on 16 May 2012. Retrieved 15 June 2012.
- Rank-1 in Clean Energy
- "Nuclear Energy in Denmark". World Nuclear Association. Retrieved 2016-02-03.
- "A nuclear update for a Swedish energy summit". Energycentral. 2 October 2015. Retrieved 15 November 2016.
- "Die Verantwortung wächst". Bundesverband der Energie- und Wasserwirtschaft. 16 December 2011. Retrieved 15 November 2016.
- Lindboe, page 29
- Wittrup, Sanne. "Dong: Vores kraftværker bruger allerede billig vindmøllestrøm i elpatroner" Ingeniøren, 15 January 2015. Retrieved: January 2015.
- Blarke, Morten Boje. "Liste over el-drevne varmepumper i fjernvarmen Archived 2016-01-19 at the Wayback Machine" SmartVarme.dk, 12 February 2014. Retrieved: January 2015.
- Capion, Karsten. "Analyse nr. 9 - Mulighederne for den fremtidige fjernvarmeproduktion i decentrale områder Archived 2015-12-08 at the Wayback Machine" Danish Energy, 15 January 2014. Retrieved: 15 January 2015.
- Lindboe, page 7
- Blarke, Morten Boje. "Store eldrevne varmepumper" Aalborg University, 17 April 2013. Retrieved: January 2015.
- Bach, Bjarne. "Integration of Heat Pumps in Greater Copenhagen" Technical University of Denmark, March 2014. Retrieved: January 2015.
- Klimaråd: Affaldsimport vil belaste dansk CO2-regnskab Archived 2015-11-28 at the Wayback Machine 27 November 2015.
- Mads Lorenzen (19 April 2016). "20 ud af 26 forbrændingsanlæg fylder ovnene med importeret affald". Ingeniøren. Archived from the original on 25 April 2016. Retrieved 26 April 2016.
- "Fjernvarmeværkerne har barberet ledningstabet kraftigt ned".
- Current data on Danish solar heat plants
- "Plug-in and Electrical Vehicles". EnergyMap.dk. Archived from the original on October 9, 2011. Retrieved 15 June 2012.
- Copenhagen's ambitious push to be carbon-neutral by 2025 Guardian 12 April 2013
- Udviklingen i miljødeklaration for fjernvarme 1990-2014 CTR
- "Climate Target 2030". Go Green with Aarhus, City of Aarhus. Archived from the original on 6 October 2014. Retrieved 28 July 2014.
- Lindboe, Hans Henrik&, János Hethey. "Vindintegration i Danmark" Ea Energianalyse, November 2014. Retrieved: January 2015. Source
External links
| Wikimedia Commons has media related to Energy in Denmark. |
