Leaflet (software)
Leaflet is an open source JavaScript library used to build web mapping applications. First released in 2011,[2] it supports most mobile and desktop platforms, supporting HTML5 and CSS3. Among its users are FourSquare, Pinterest and Flickr.
| Original author(s) | Vladimir Agafonkin |
|---|---|
| Initial release | May 13, 2011 |
| Stable release | 1.7.1
/ September 4, 2020 |
| Repository | |
| Written in | JavaScript |
| Platform | See Browser support |
| Type | JavaScript library |
| License | BSD-2-Clause[1] |
| Website | leafletjs |
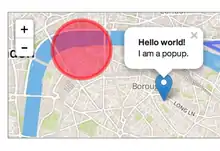
Leaflet allows developers without a GIS background to very easily display tiled web maps hosted on a public server, with optional tiled overlays. It can load feature data from GeoJSON files, style it and create interactive layers, such as markers with popups when clicked.
It is developed by Vladimir Agafonkin, who joined Mapbox in 2013.[3]
Use
A typical use of Leaflet involves binding a Leaflet "map" element to an HTML element such as a div. Layers and markers are then added to the map element.
// create a map in the "map" div, set the view to a given place and zoom
var map = L.map('map').setView([51.505, -0.09], 13);
// add an OpenStreetMap tile layer
// Tile Usage Policy applies: https://operations.osmfoundation.org/policies/tiles/
L.tileLayer('http://{s}.tile.openstreetmap.org/{z}/{x}/{y}.png', {
attribution: '&copy; <a href="http://openstreetmap.org/copyright">OpenStreetMap</a> contributors'
}).addTo(map);
A unique feature of leaflet is displaying maps in non-spherical Mercator projections.[4]
The Leaflet library itself is accessible through the variable L.
Features
Leaflet supports Web Map Service (WMS) layers, GeoJSON layers, Vector layers and Tile layers natively. Many other types of layers are supported via plugins.
Like other web map libraries, the basic display model implemented by Leaflet is one basemap, plus zero or more translucent overlays, with zero or more vector objects displayed on top.
Elements
The major Leaflet object types are:[5]
- Raster types (TileLayer and ImageOverlay)
- Vector types (Path, Polygon, and specific types such as Circle)
- Grouped types (LayerGroup, FeatureGroup and GeoJSON)
- Controls (Zoom, Layers, etc.)
There is also a variety of utility classes such as interfaces for managing projections, transformations and interacting with the DOM.
Support for GIS formats
Leaflet has core support for few GIS standard formats, with others supported in plugins.
| Standard | Support |
|---|---|
| GeoJSON | Good, core support through the geoJson function[6] |
| KML, CSV, WKT, TopoJSON, GPX | Supported in Leaflet-Omnivore plugin[7] |
| WMS | Core support through the TileLayer.WMS[8] subtype |
| WFS | Not supported, although 3rd party plugins exist.[9] |
| GML | Not supported.[10] |
Browser support
Leaflet 0.7 supports Chrome, Firefox, Safari 5+, Opera 12+ and IE 7-11.[11]
Comparison with other libraries
Leaflet is directly comparable with OpenLayers, as both are open source, client-side only JavaScript libraries. The library as a whole is much smaller, around 7,000 lines of code compared to OpenLayers' 230,000 (as of 2015).[12] It has a smaller code footprint than OpenLayers (around 123 KB[13] vs 423 KB[14]) due partly to its modular structure. The code base is newer, and takes advantage of recent features of JavaScript, plus HTML5 and CSS3. However, Leaflet lacks features OpenLayers supports, such as Web Feature Service (WFS)[15] and native support for projections other than Google Web Mercator (EPSG 3857).[16]
It is also comparable to the proprietary, closed source Google Maps API (debuting in 2005) and Bing Maps API, both of which incorporate a significant server-side component to provide services such as geocoding, routing, search and integration with features such as Google Earth. Google Maps API provides speed and simplicity, but is not flexible, and can only be used to access Google Maps services. The new DataLayer part of Google's API does allow external data sources to be displayed, however.[17]
History
Leaflet began life in 2010 as "Web Maps API", a JavaScript library for the CloudMade mapping provider, where Agafonkin worked at the time. In May 2011, CloudMade announced the first release of Leaflet, built from scratch but using parts of the old API code.[18]
- 0.1: May 17, 2011
- 0.2: June 18, 2011
- 0.3: Feb 14, 2012
- 0.4: Jul 30, 2012
- 0.5: Jan 17, 2013
- 0.6: Jun 26, 2013
- This release expanded the API's range of methods and events, improved usability, and added GeoJSON saving. It was completed in a 2-day code sprint supported by Mapbox.[20]
- 0.7: Nov 22, 2013
- This release focused on bug fixing, announcing that refactoring and potential backward incompatibilities would come soon.[21]
- 1.0: Sep 27, 2016
- This release contained over 400 changes compared to v0.7.7:[22]
- Performance improvements in all aspects of the library and vector layers in particular.
- Flyover animations (zooming and panning in a curve).
- Fractional zoom level support.
- Better tile loading algorithm with less flickering.
- Custom pane management (including multiple vector layer panes and interleaving vectors and tile layers).
- Better support for non-standard projections.
- More accessibility features.
- Improved documentation.
- Stability improvements.
- This release contained over 400 changes compared to v0.7.7:[22]
- 1.1: Jun 27, 2017
- This release adds video overlays and makes a transition to ECMAScript 6 modules.
- 1.2: Oct 25, 2017
- 1.3: Jan 15, 2018
- 1.3.2: Jul 17, 2018
- 1.3.3: Jul 18, 2018
- 1.3.4: Aug 21, 2018
- 1.4.0: Dec 30, 2018
- 1.5.0 and 1.5.1 : May 8, 2019
- 1.6.0: Nov 17, 2019
- 1.7.1 : September 4, 2020
External links
References
- "License - Leaflet". Leaflet. Retrieved 2018-11-03.
- Lovelace, Robin. "Testing web map APIs - Google vs OpenLayers vs Leaflet". Archived from the original on 2017-11-03. Retrieved 2018-11-03.
- MacWright, Tom (2014-08-06). "Leaflet Creator Vladimir Agafonkin Joins MapBox". Retrieved 2018-11-03.
- "Top Data Visualization tools by Nataly Otair". 2020-10-08. Retrieved 2020-09-06.
- "Leaflet API reference". Retrieved 2018-11-03.
- "Using GeoJSON with Leaflet". Retrieved 2018-11-03.
- https://github.com/mapbox/leaflet-omnivore
- "TileLayer.WMS". Retrieved 2018-11-03.
- https://github.com/Georepublic/leaflet-wfs
- "Support for GML". 2012-06-23. Retrieved 2018-11-03.
- "Features". Retrieved 2018-11-03.
- "OpenHub.net comparison between OpenLayers and Leaflet". OpenHub.net. Archived from the original on 2014-08-08. Retrieved 2018-11-03.
- "Leaflet frontpage". Leaflet - An Open-Source JavaScript Library for Mobile-Friendly Interactive Maps. Retrieved 2018-11-03.
- "OpenLayers 3.4.0 compressed source code". OpenLayers.org. Archived from the original on 2016-11-29. Retrieved 2018-11-03.
- Various plugins providing WFS-support are listed on https://leafletjs.com/plugins.html
- "Projection". Retrieved 2018-11-03.
- "Data Layer". Google Maps Platform. Google. Retrieved 2018-11-03.
- "Announcing Leaflet: a Modern Open Source JavaScript Library for Interactive Maps". CloudMade. 2011-05-13. Archived from the original on 2014-08-11. Retrieved 2018-11-03.
- Agafonkin, Vladimir (2013-01-17). "Leaflet 0.5 Released". Retrieved 2018-11-03.
- Agafonkin, Vladimir (2013-06-26). "Leaflet 0.6 Released, Code Sprint in DC with MapBox". Retrieved 2018-11-03.
- Agafonkin, Vladimir (2013-11-18). "Leaflet 0.7 Release, MapBox and Plans for Future". Retrieved 2018-11-03.
- Agafonkin, Vladimir (2016-09-27). "Meet Leaflet 1.0". Retrieved 2018-11-03.
OpenStreetMap (OSM) | ||
|---|---|---|
| Related persons, organizations and events | ||
| OSM-based movements | ||
| Service providers (commercial) | ||
| OSM editors | ||
| OSM map renders | ||
| Software using OSM database |
| |
| Similar free projects | ||
| Proprietary equivalents | ||