List of administrative divisions of Greater China by Human Development Index
This is a list of the first-level administrative divisions of the People's Republic of China (PRC), including all provinces, autonomous regions and municipalities, in order of their Human Development Index (HDI), alongside the Republic of China (ROC, Taiwan). The 2018 figures for PRC/ROC divisions come from the Subnational Human Development Index (4.1), published by United Nations Development Programme. This report did not cover Macau, which is a special administrative region of the PRC.
 | ||
| First or provincial level Administrative divisions of China by: | ||
|---|---|---|
|
||
The HDI values of Macau, as given in the UN Human Development Report, are included for comparison purposes.
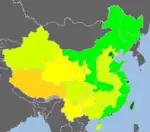
List of administrative divisions by HDI
.svg.png.webp)
The Subnational Human Development Database (2019 data)
Notes:
- Compared according to the dataset, but not given in the original source.
- Hong Kong and Macau are special administrative regions of the People's Republic of China.
- Macao HDI is not included in the database or any UN reports. According to the Statistics and Census Service of the Government of Macao Special Administrative Region, the HDI of Macau was 0.909 in 2016.[4]
- Taiwan is under separate rule by the Republic of China as a de facto independent state since 1950, but is claimed by the People's Republic of China as a province. The ROC also claims the mainland as a part of its territory.[5]
- In the 2019 Subnational Human Development Database (SHDD), where the HDIs of other administrative regions except Macao are acquired, Taiwan's HDI is 0.880.[1] Yet, according to the 2019 report by the Statistical Bureau of the Republic of China, the HDI of was 0.911, close to those of Spain and Israel.[6]
List of large and medium-sized cities of China by HDI
China Sustainable Cities Report 2016 (2015 data)
| City | HDI[7] | Comparable country | HDI rank | Scores for sub-indicator of HDI[7] | ||
|---|---|---|---|---|---|---|
| Life expectancy | Education years | GDP per capita | ||||
| Guangzhou | 0.869 | 1 | 0.944 | 0.779 | 0.892 | |
| Beijing | 0.860 | 2 | 0.951 | 0.783 | 0.854 | |
| Nanjing | 0.859 | 3 | 0.956 | 0.765 | 0.865 | |
| Shenyang | 0.854 | 4 | 0.923 | 0.813 | 0.831 | |
| Shenzhen | 0.851 | 5 | 0.918 | 0.734 | 0.915 | |
| Shanghai | 0.848 | 6 | 0.958 | 0.749 | 0.850 | |
| Tianjin | 0.841 | 7 | 0.940 | 0.736 | 0.862 | |
| Xiamen | 0.841 | 8 | 0.924 | 0.774 | 0.833 | |
| Wuhan | 0.839 | 9 | 0.927 | 0.749 | 0.851 | |
| Dalian | 0.839 | 10 | 0.945 | 0.720 | 0.868 | |
| Hangzhou | 0.839 | 11 | 0.947 | 0.724 | 0.860 | |
| Ningbo | 0.823 | 12 | 0.942 | 0.696 | 0.851 | |
| Qingdao | 0.822 | 13 | 0.938 | 0.698 | 0.849 | |
| Changsha | 0.817 | 14 | 0.865 | 0.729 | 0.865 | |
| Jinan | 0.811 | 15 | 0.899 | 0.719 | 0.824 | |
| Taiyuan | 0.800 | 16 | 0.900 | 0.734 | 0.774 | |
| Changchun | 0.799 | 17 | 0.908 | 0.701 | 0.802 | |
| Zhengzhou | 0.797 | 18 | 0.898 | 0.699 | 0.806 | |
| Hohhot | 0.792 | 19 | 0.838 | 0.699 | 0.848 | |
| Hefei | 0.791 | 20 | 0.871 | 0.716 | 0.795 | |
| Harbin | 0.791 | 20 | 0.903 | 0.680 | 0.761 | |
| Chengdu | 0.791 | 21 | 0.895 | 0.690 | 0.800 | |
| Haikou | 0.788 | 22 | 0.920 | 0.709 | 0.749 | |
| Nanchang | 0.787 | 23 | 0.886 | 0.687 | 0.801 | |
| Fuzhou | 0.785 | 24 | 0.860 | 0.703 | 0.800 | |
| Yinchuan | 0.784 | 25 | 0.886 | 0.686 | 0.791 | |
| Kunming | 0.782 | 26 | 0.885 | 0.705 | 0.767 | |
| Xi'an | 0.770 | 28 | 0.857 | 0.678 | 0.786 | |
| Urumqi | 0.769 | 29 | 0.800 | 0.710 | 0.801 | |
| Lanzhou | 0.767 | 30 | 0.823 | 0.719 | 0.763 | |
| Guiyang | 0.761 | 31 | 0.842 | 0.686 | 0.764 | |
| Nanning | 0.757 | 32 | 0.865 | 0.689 | 0.728 | |
| Shijiazhuang | 0.757 | 33 | 0.867 | 0.670 | 0.746 | |
| Chongqing | 0.747 | 34 | 0.889 | 0.631 | 0.743 | |
| Xining | 0.743 | 35 | 0.838 | 0.661 | 0.739 | |
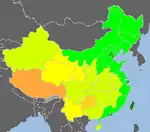
Trend
| Legend | ||||
|---|---|---|---|---|
|
Very High human development 0.900 and above
0.850–0.899
0.800–0.849 |
High human development 0.750–0.799
0.700–0.749 |
Medium human development 0.650–0.699
0.600–0.649
0.550–0.599 |
Data unavailable | |
- 2010-2014 HDI
 2014 data
 2010 data
| Legend | ||||
|---|---|---|---|---|
|
Very High human development 0.900–0.949 |
High human development 0.850–0.899
0.800–0.849 |
Medium human development 0.750–0.799
0.700–0.749
0.650–0.699
0.600–0.649
0.550–0.599
0.500–0.549 |
Low human development 0.450–0.499
0.400–0.449
0.350–0.399 |
Data unavailable |
- 1982-2008 HDI
 2008 data
 2005 data
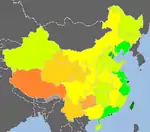 2003 data
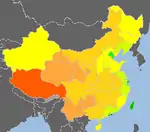 1999 data
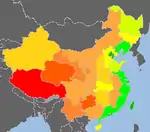 1997 data
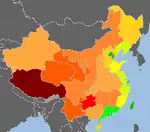 1995 data
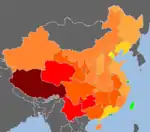 1990 data
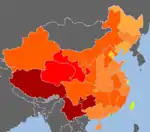 1982 data
References
- Permanyer, Iñaki; Smits, Jeroen (2019-03-07). "The Subnational Human Development Database". Scientific Data. 6: 190038. doi:10.6084/m9.figshare.c.4353632.v1. PMC 6413757. PMID 30860498.
- Iñaki Permanyer; Smits, Jeroen (2019-03-12). "The Subnational Human Development Database". Scientific Data. 6: 190038. Bibcode:2019NatSD...690038S. doi:10.1038/sdata.2019.38. ISSN 2052-4463. PMC 6413757. PMID 30860498.
- "Sub-national HDI - Subnational HDI - Global Data Lab". globaldatalab.org. Retrieved 2020-03-04.
- "Macau in Figures, 2016". 澳門統計暨普查局(DSEC). Retrieved 2017-12-05.
- "Taiwan Country Profile". World Affairs Journal. Retrieved 2020-08-29.
- 行政院主計總處綜合統計處. "國情統計通報(第 206 號)" (PDF) (in Chinese). Retrieved 2019-05-05.
- "China Sustainable Cities Report 2016: Measuring Ecological Input and Human Development" (PDF). United Nations Development Programme China. 2016.