List of countries by Human Development Index
The United Nations Development Programme (UNDP) compiles the Human Development Index (HDI) of 189 countries in the annual Human Development Report. The index considers the health, education and income in the country to provide a measure of human development which is comparable between countries and over time.[1][2]
|
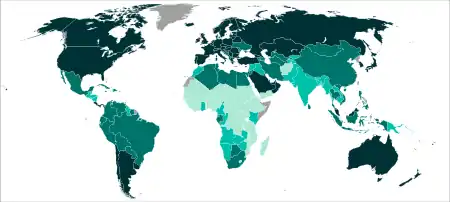
Very high (≥ 0.800)
High (0.700–0.799)
Medium (0.550–0.699) |
Low (≤ 0.549)
Data unavailable |
.png.webp)
The first human development index was published in 1990 with the goal to be a more comprehensive measure of human development than purely economic measures. The report chooses three key components of human development, longevity (later changed to "Long and healthy life"), knowledge, and decent living standards. For each dimension an indicator is chosen which in the 2020 report is life expectancy at birth; expected years of schooling for children and mean years of schooling for adults; and Gross National Income per capita respectively. The indicators are used to create a health index, an education index and an income index each with a value between 0 and 1. The geometric mean of the three indexes, the cube root of the product of the indexes, is the human development index. A value above 0.800 is classified as very high, between 0.700 and 0.799 high, 0.550 to 0.699 as medium and anything below 0.550 as low.[3][1][4]
The data used to calculate HDI comes mostly from UN agencies and internation institutions such as UNESCO, UNDESA, the World Bank, IMF and OECD. Rarely when one of the indicators is missing cross-country regression models are used. Due to improved data and methodology updates HDI values are not comparable across human development reports.[5][4]
The Human Development index has several limitations in measuring the human development of countries including that it does not account for dimensions of human development such as inequality and participation in governance. It is also an average of large groups of people and can not show more granular development for different regions, ethnic groups or gender. [6][7] To resolve one of the limitations the Inequality-adjusted Human Development Index (IHDI) was introduced in the 2010 report which stated that "the IHDI is the actual level of human development (accounting for inequality)" and "the HDI can be viewed as an index of 'potential' human development (or the maximum IHDI that could be achieved if there were no inequality)".[8] To reflect developmental differences within countries a Subnational HDI (SHDI) was introduced in 2018 where the human development index is calculated in an internationally comparable way for over 1600 regions.[9]
List of countries by HDI
.svg.png.webp)
 = increase
 = steady
 = decrease
| Rank | Country or Territory | HDI | |||
|---|---|---|---|---|---|
| 2019 data (2020 report)[10] | Change over 5 years (2014)[2] | 2019 data (2020 report)[10] | Average annual HDI growth (2010-2019)[2] | ||
| Very high human development | |||||
| 1 | 0.957 | ||||
| 2 | 0.955 | ||||
| 2 | 0.955 | ||||
| 4 | 0.949 | ||||
| 4 | 0.949 | ||||
| 6 | 0.947 | ||||
| 7 | 0.945 | ||||
| 8 | 0.944 | ||||
| 8 | 0.944 | ||||
| 10 | 0.940 | ||||
| 11 | 0.938 | ||||
| 11 | 0.938 | ||||
| 13 | 0.932 | ||||
| 14 | 0.931 | ||||
| 14 | 0.931 | ||||
| 16 | 0.929 | ||||
| 17 | 0.926 | ||||
| 18 | 0.922 | ||||
| 19 | 0.919 | ||||
| 19 | 0.919 | ||||
| 19 | 0.919 | ||||
| 22 | 0.917 | ||||
| 23 | 0.916 | ||||
| 23 | 0.916 | ||||
| 25 | 0.904 | ||||
| 26 | 0.901 | ||||
| 27 | 0.900 | ||||
| 28 | 0.895 | ||||
| 29 | 0.892 | ||||
| 29 | 0.892 | ||||
| 31 | 0.890 | ||||
| 32 | 0.888 | ||||
| 33 | 0.887 | ||||
| 34 | 0.882 | ||||
| 35 | 0.880 | ||||
| 36 | 0.868 | ||||
| 37 | 0.866 | ||||
| 38 | 0.864 | ||||
| 39 | 0.860 | ||||
| 40 | 0.854 | ||||
| 40 | 0.854 | ||||
| 42 | 0.852 | ||||
| 43 | 0.851 | ||||
| 43 | 0.851 | ||||
| 45 | 0.848 | ||||
| 46 | 0.845 | ||||
| 47 | 0.838 | ||||
| 48 | 0.829 | ||||
| 49 | 0.828 | ||||
| 50 | 0.826 | ||||
| 51 | 0.825 | ||||
| 52 | 0.824 | ||||
| 53 | 0.823 | ||||
| 54 | 0.820 | ||||
| 55 | 0.817 | ||||
| 56 | 0.816 | ||||
| 57 | 0.815 | ||||
| 58 | 0.814 | ||||
| 58 | 0.814 | ||||
| 60 | 0.813 | ||||
| 61 | 0.812 | ||||
| 62 | 0.810 | ||||
| 62 | 0.810 | ||||
| 64 | 0.806 | ||||
| 64 | 0.806 | ||||
| 66 | 0.804 | ||||
| High human development | |||||
| 67 | 0.796 | ||||
| 67 | 0.796 | ||||
| 69 | 0.795 | ||||
| 70 | 0.783 | ||||
| 70 | 0.783 | ||||
| 72 | 0.782 | ||||
| 73 | 0.780 | ||||
| 74 | 0.779 | ||||
| 74 | 0.779 | ||||
| 74 | 0.779 | ||||
| 74 | 0.779 | ||||
| 78 | 0.778 | ||||
| 79 | 0.777 | ||||
| 79 | 0.777 | ||||
| 81 | 0.776 | ||||
| 82 | 0.774 | ||||
| 83 | 0.767 | ||||
| 84 | 0.765 | ||||
| 85 | 0.761 | ||||
| 86 | 0.759 | ||||
| 86 | 0.759 | ||||
| 88 | 0.756 | ||||
| 88 | 0.756 | ||||
| 90 | 0.750 | ||||
| 91 | 0.748 | ||||
| 92 | 0.744 | ||||
| 93 | 0.743 | ||||
| 94 | 0.742 | ||||
| 95 | 0.740 | ||||
| 95 | 0.740 | ||||
| 97 | 0.738 | ||||
| 97 | 0.738 | ||||
| 99 | 0.737 | ||||
| 100 | 0.735 | ||||
| 101 | 0.734 | ||||
| 102 | 0.729 | ||||
| 103 | 0.728 | ||||
| 104 | 0.725 | ||||
| 105 | 0.724 | ||||
| 106 | 0.720 | ||||
| 107 | 0.718 | ||||
| 107 | 0.718 | ||||
| 107 | 0.718 | ||||
| 110 | 0.716 | ||||
| 111 | 0.715 | ||||
| 111 | 0.715 | ||||
| 113 | 0.711 | ||||
| 114 | 0.709 | ||||
| 115 | 0.708 | ||||
| 116 | 0.707 | ||||
| 117 | NA[lower-alpha 1] | 0.704 | NA[lower-alpha 1] | ||
| 117 | 0.704 | ||||
| 119 | 0.703 | ||||
| Medium human development | |||||
| 120 | 0.697 | ||||
| 121 | 0.686 | ||||
| 122 | 0.682 | ||||
| 123 | 0.674 | ||||
| 124 | 0.673 | ||||
| 125 | 0.668 | ||||
| 126 | 0.665 | ||||
| 127 | 0.663 | ||||
| 128 | 0.660 | ||||
| 129 | 0.654 | ||||
| 130 | 0.646 | ||||
| 131 | 0.645 | ||||
| 132 | 0.634 | ||||
| 133 | 0.632 | ||||
| 134 | 0.630 | ||||
| 135 | 0.625 | ||||
| 136 | 0.620 | ||||
| 137 | 0.613 | ||||
| 138 | 0.611 | ||||
| 138 | 0.611 | ||||
| 140 | 0.609 | ||||
| 141 | 0.606 | ||||
| 142 | 0.602 | ||||
| 143 | 0.601 | ||||
| 144 | 0.594 | ||||
| 145 | 0.592 | ||||
| 146 | 0.584 | ||||
| 147 | 0.583 | ||||
| 148 | 0.581 | ||||
| 149 | 0.574 | ||||
| 150 | 0.571 | ||||
| 151 | 0.567 | ||||
| 151 | 0.567 | ||||
| 153 | 0.563 | ||||
| 154 | 0.557 | ||||
| 155 | 0.555 | ||||
| 156 | 0.554 | ||||
| Low human development | |||||
| 157 | 0.546 | ||||
| 158 | 0.545 | ||||
| 159 | 0.544 | ||||
| 160 | 0.543 | ||||
| 161 | 0.539 | ||||
| 162 | 0.538 | ||||
| 163 | 0.529 | ||||
| 164 | 0.528 | ||||
| 165 | 0.527 | ||||
| 166 | 0.524 | ||||
| 167 | 0.515 | ||||
| 168 | 0.512 | ||||
| 169 | 0.511 | ||||
| 170 | 0.510 | ||||
| 170 | 0.510 | ||||
| 172 | 0.496 | ||||
| 173 | 0.485 | ||||
| 174 | 0.483 | ||||
| 175 | 0.480 | ||||
| 175 | 0.480 | ||||
| 175 | 0.480 | ||||
| 178 | 0.477 | ||||
| 179 | 0.470 | ||||
| 180 | 0.459 | ||||
| 181 | 0.456 | ||||
| 182 | 0.452 | ||||
| 182 | 0.452 | ||||
| 184 | 0.434 | ||||
| 185 | 0.433 | ||||
| 185 | 0.433 | ||||
| 187 | 0.398 | ||||
| 188 | 0.397 | ||||
| 189 | 0.394 | ||||
Regions and groups
| Region or group | 1990 data[11] | 2000 data[11] | 2010 data[11] | 2014 data[11] | 2015 data[11] | 2017 data[11] | 2018 data[11] | 2019 data[11] |
|---|---|---|---|---|---|---|---|---|
| Very high human development | ||||||||
| OECD | 0.786 | 0.835 | 0.874 | 0.888 | 0.891 | 0.896 | 0.898 | 0.900 |
| Very high human development | 0.782 | 0.826 | 0.870 | 0.885 | 0.889 | 0.894 | 0.896 | 0.898 |
| High human development | ||||||||
| Europe and Central Asia | 0.662 | 0.675 | 0.739 | 0.772 | 0.775 | 0.785 | 0.787 | 0.791 |
| Latin America and the Caribbean | 0.632 | 0.690 | 0.736 | 0.756 | 0.759 | 0.762 | 0.764 | 0.766 |
| High human development | 0.567 | 0.629 | 0.705 | 0.730 | 0.735 | 0.744 | 0.748 | 0.753 |
| East Asia and the Pacific | 0.517 | 0.595 | 0.688 | 0.718 | 0.724 | 0.735 | 0.740 | 0.747 |
| World | 0.601 | 0.644 | 0.699 | 0.720 | 0.724 | 0.732 | 0.734 | 0.737 |
| Small Island Developing States | 0.599 | 0.646 | 0.706 | 0.715 | 0.720 | 0.724 | 0.726 | 0.728 |
| Arab states | 0.556 | 0.614 | 0.676 | 0.687 | 0.691 | 0.699 | 0.702 | 0.705 |
| Medium human development | ||||||||
| Developing countries | 0.517 | 0.571 | 0.642 | 0.668 | 0.673 | 0.683 | 0.685 | 0.689 |
| South Asia | 0.437 | 0.501 | 0.580 | 0.612 | 0.620 | 0.635 | 0.637 | 0.641 |
| Medium human development | 0.433 | 0.492 | 0.571 | 0.601 | 0.609 | 0.624 | 0.627 | 0.631 |
| Low human development | ||||||||
| Sub-Saharan Africa | 0.404 | 0.426 | 0.501 | 0.530 | 0.535 | 0.542 | 0.544 | 0.547 |
| Least developed countries | 0.353 | 0.403 | 0.489 | 0.513 | 0.520 | 0.531 | 0.534 | 0.538 |
| Low human development | 0.345 | 0.381 | 0.468 | 0.497 | 0.500 | 0.507 | 0.509 | 0.513 |
See also
Notes
- Data not available before 2017
References
- "Human Development Index (HDI) | Human Development Reports". hdr.undp.org. United Nations Development Programme. Retrieved 15 December 2020.
- Human Development Report 2020 The Next Frontier: Human Development and the Anthropocene (PDF). United Nations Development Programme. 15 December 2020. pp. 343–346. ISBN 978-92-1-126442-5. Retrieved 15 December 2020.
- Human Development Report 1990 (PDF). United Nations Development Programme. 1 May 1990. pp. iii, iv, 5, 9, 12. ISBN 0-19-506481-X. Retrieved 15 December 2020.
- "Human Development Report 2019 – Technical notes" (PDF). hdr.undp.org. United Nations Development Programme. pp. 2–4. Retrieved 15 December 2020.
- "Human Development Report 2020: Reader's Guide". hdr.undp.org. United Nations Development Programme. Retrieved 15 December 2020.
- Jahan, Selim. "The Human Development Index – what it is and what it is not | Human Development Reports". hdr.undp.org. United Nations Development Programme. Retrieved 15 December 2020.
- "Frequently Asked Questions | Why does the HDI not include dimensions of participation, gender and equality?". hdr.undp.org. United Nations Development Programme. Retrieved 15 December 2020.
- Human Development Report 2010 (PDF). New York: United Nations Development Programme. 2010. p. 87. ISBN 9780230284456. Retrieved 23 February 2020.
- Iñaki, Permanyer; Jeroen, Smits. "The Subnational Human Development Index: Moving beyond country-level averages | Human Development Reports". hdr.undp.org. United Nations Development Programme. Retrieved 15 December 2020.
- Human Development Report 2020 The Next Frontier: Human Development and the Anthropocene (PDF). United Nations Development Programme. 15 December 2020. pp. 343–346. ISBN 978-92-1-126442-5. Retrieved 15 December 2020.
- Human Development Report 2020 The Next Frontier: Human Development and the Anthropocene (PDF). United Nations Development Programme. 15 December 2020. p. 350. ISBN 978-92-1-126442-5. Retrieved 15 December 2020.