List of countries by oil imports
This is a list of countries by oil imports based on The World Factbook ^ and other sources.[1] Many countries also export oil, and some export more oil than they import.
| Rank | Country/Region | Crude Oil - Imports (bbl/day - est.) | Year of Information |
|---|---|---|---|
| - | 14,060,000 | 2017 | |
| 1 | 8,400,000 | 2018[3] | |
| 2 | 7,900,000 | 2018 | |
| 3 | 5,123,000 | 2018[4] | |
| 4 | 3,147,000 | 2016 | |
| 5 | 2,949,000 | 2014 | |
| 6 | 1,830,000 | 2013 | |
| 7 | 1,503,000 | 2014 | |
| 8 | 1,346,000 | 2013 | |
| 9 | 1,224,000 | 2013 | |
| 10 | 1,221,000 | 2013 | |
| 11 | 1,204,000 | 2013 | |
| 12 | 1,129,000 | 2013 | |
| 13 | 976,100 | 2012 | |
| 14 | 898,000 | 2012 | |
| 15 | 841,300 | 2015 | |
| 16 | 700,000 | 2014 | |
| 17 | 618,400 | 2013 | |
| 18 | 468,000 | 2013 | |
| 19 | 467,400 | 2013 | |
| 20 | 461,900 | 2013 | |
| 21 | 433,400 | 2012 | |
| 22 | 414,000 | 2013 | |
| 23 | 391,800 | 2012 | |
| 24 | 379,600 | 2013 | |
| 25 | 372,800 | 2013 | |
| 26 | 352,300 | 2013 | |
| 27 | 344,900 | 2012 | |
| 28 | 282,400 | 2013 | |
| 29 | 275,600 | 2013 | |
| 30 | 243,300 | 2012 | |
| 31 | 236,000 | 2013 | |
| 32 | 229,000 | 2012 | |
| 33 | 200,200 | 2012 | |
| 34 | 186,900 | 2013 | |
| 35 | 181,900 | 2012 | |
| 36 | 173,900 | 2014 | |
| 37 | 160,000 | 2013 | |
| 38 | 148,500 | 2012 | |
| 39 | 131,300 | 2013 | |
| 40 | 128,100 | 2012 | |
| 41 | 118,400 | 2012 | |
| 42 | 117,600 | 2013 | |
| 43 | 115,300 | 2013 | |
| 44 | 110,600 | 2012 | |
| 45 | 104,900 | 2012 | |
| 46 | 101,400 | 2013 | |
| 47 | 101,200 | 2013 | |
| 48 | 99,690 | 2013 | |
| 49 | 80,000 | 2013 | |
| 50 | 72,860 | 2012 | |
| 51 | 70,000 | 2013 | |
| 52 | 66,490 | 2013 | |
| 53 | 59,440 | 2013 | |
| 54 | 59,180 | 2012 | |
| 55 | 40,880 | 2012 | |
| 56 | 37,300 | 2014 | |
| 57 | 37,080 | 2013 | |
| 58 | 33,020 | 2012 | |
| 59 | 32,520 | 2012 | |
| 60 | 31,960 | 2012 | |
| 61 | 31,730 | 2014 | |
| 62 | 29,650 | 2014 | |
| 63 | 28,140 | 2012 | |
| 64 | 26,500 | 2012 | |
| 65 | 25,320 | 2012 | |
| 66 | 24,200 | 2012 | |
| 67 | 24,160 | 2012 | |
| 68 | 22,120 | 2012 | |
| 69 | 20,040 | 2012 | |
| 70 | 19,830 | 2012 | |
| 71 | 15,560 | 2012 | |
| 72 | 14,880 | 2012 | |
| 73 | 14,340 | 2012 | |
| 74 | 13,580 | 2014 | |
| 75 | 9,940 | 2012 | |
| 76 | 9,884 | 2013 | |
| 77 | 5,900 | 2012 | |
| 78 | 4,493 | 2012 | |
| 79 | 3,440 | 2012 | |
| 80 | 340 | 2012 | |
| 81 | 146 | 2014 | |
| 82 | 140 | 2012 | |
| 83 | 100 | 2012 | |
| 84 | 40 | 2012 |

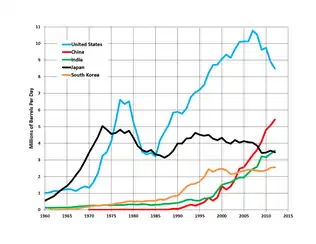
Trends in the top five crude oil-importing countries, 1960–2012
References
- http://www.eia.gov/countries/index.cfm?topL=imp
- "The World Factbook". report. Central Intelligence Agency. Retrieved 12 September 2016.
- "China becomes world's largest oil importer". www.ecns.cn. Retrieved 2018-02-07.
- "India's oil imports hit record high in January". The Economic Times. 2018-02-15. Retrieved 2018-02-16.
This article is issued from Wikipedia. The text is licensed under Creative Commons - Attribution - Sharealike. Additional terms may apply for the media files.