List of countries by natural gas proven reserves
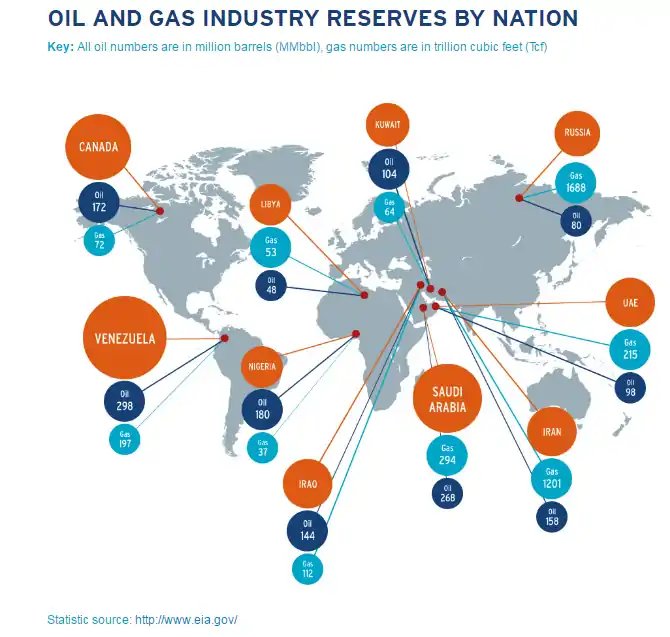
This is a list of countries by natural gas proven reserves based on The World Factbook (when no citation is given).[1] or other authoritative third-party sources (as cited). Based on data from BP, at the end of 2009, proved gas reserves were dominated by three countries: Iran, Russia, and Qatar, which together held nearly half the world's proven reserves.[2]
.svg.png.webp)
There is some disagreement on which country has the largest proven gas reserves. Sources that consider that Russia has by far the largest proven reserves include the US CIA (47600 cubic kilometers),[3] the US Energy Information Administration (49000 km³),[4] and OPEC (48810 km³).[5] However, BP credits Russia with only 32900 km³,[6] which would place it in second place, slightly behind Iran (33100 to 33800 km³, depending on the source).
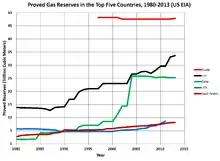
Due to constant announcements of shale gas recoverable reserves, as well as drilling in Central Asia, South America and Africa, deepwater drilling, estimates are undergoing frequent updates, mostly increasing. Since 2000, some countries, notably the US and Canada, have seen large increases in proved gas reserves due to development of shale gas, but shale gas deposits in most countries are yet to be added to reserve calculations.
| Proven Reserves (km³) | U.S. EIA (start of 2018)[7] | OPEC (start of 2018)[8] | BP (start of 2018)[9] | Other | Reserves-to-production ratio | |||||
|---|---|---|---|---|---|---|---|---|---|---|
| Country | Rank | Reserves | Rank | Reserves | Rank | Reserves | Source/Date | Reserves | Production(km³/year) | Years |
| 1 | 47,805 | 1 | 50,617 | 1 | 35,000 | |||||
| 2 | 33,721 | 2 | 33,810 | 2 | 33,200 | |||||
| 3 | 24,072 | 3 | 23,861 | 3 | 24,900 | |||||
| 4 | 15,484 | 5 | 9,067 | 5 | 8,700 | 866 [10] | ~17~ (if by U.S. EIA and International Energy Agency[11]) | |||
| 5 | 9,200 | 6 | 8,715 | 6 | 8,000 | |||||
| 6 | 7,504 | 4 | 9,838 | 4 | 19,500 | |||||
| 7 | 6,091 | 7 | 6,091 | 8 | 5,900 | |||||
| 8 | 5,740 | 8 | 5,707 | 7 | 6,400 | |||||
| 9 | 5,475 | 9 | 5,627 | 10 | 5,200 | |||||
| 10 | 5,440 | 13 | 2,934 | 9 | 5,500 | |||||
| 11 | 4,504 | 10 | 4,504 | 11 | 4,300 | |||||
| 12 | 3,820 | 11 | 3,744 | 13 | 3,500 | |||||
| 13 | 2,866 | 15 | 2,866 | 14 | 2,900 | |||||
| 14 | 2,832 | |||||||||
| 15 | 2,407 | 19 | 1,898 | 1,100 | ||||||
| 16 | 2,186 | 17 | 2,221 | 17 | 1,800 | |||||
| 17 | 2,056 | 18 | 2,059 | 16 | 1,900 | |||||
| 18 | 1,989 | 12 | 3,173 | 12 | 3,600 | |||||
| 19 | 1,841 | 21 | 1,564 | 1,200 | ||||||
| 20 | 1,784 | 20 | 1,784 | 18/19 | 1,700 | |||||
| 21 | 1,782 | 16 | 2,314 | 18/19 | 1,700 | |||||
| 22 | 1,505 | 22 | 1,505 | 20 | 1,400 | |||||
| 23 | 1,290 | 23 | 1,289 | 1,200 | ||||||
| 24 | 1,183 | 14 | 2,909 | 15 | 2,700 | |||||
| 25 | 1,104 | 35 | 304 | 1,100 | ||||||
| 26 | 991 | 24 | 1,227 | 14 | 2,800 | |||||
| 27 | 801 | 26 | 804 | 700 | ||||||
| 28 | 699 | 39 | 203 | 600 | ||||||
| 29 | 651 | 25 | 884 | 700 | ||||||
| 30 | 637 | 36 | 273 | 1,200 | ||||||
| 31 | 589 | 27 | 757 | 400 | ||||||
| 32 | 479 | 300 | ||||||||
| 33 | 474 | 474 | ||||||||
| 34 | 456 | 28 | 513 | 400 | ||||||
| 35 | 447 | 29 | 433 | 300 | ||||||
| 36 | 377 | 33 | 325 | 400 | ||||||
| 37 | 337 | 31 | 381 | 300 | ||||||
| 38 | 308 | 30 | 422 | |||||||
| 39 | 296 | 34 | 310 | 300 | ||||||
| 40 | 280 | 42 | 146 | 200 | ||||||
| 41 | 261 | 38 | 252 | |||||||
| 42 | 241 | 300 | 300 | |||||||
| 43 | 211 | 200 | ||||||||
| 44 | 193 | 40 | 180 | 200 | ||||||
| 45 | 186 | 32 | 346 | 200 | Petrobangla, 16 Jan. 2018[12] | 385 | ||||
| 46 | 176 | 500 | ||||||||
| 47 | 176 | 37 | 269 | 200 | ||||||
| 48 | 135 | 41 | 152 | |||||||
| 49 | 114 | 46 | 104 | 100 | ||||||
| 50 | 105 | 45 | 105 | 100 | ||||||
| 51 | 98.5 | |||||||||
| 52 | 98.0 | 5.30 | ||||||||
| 53 | 92.0 | 200 | ||||||||
| 54 | 90.6 | 44 | 111 | |||||||
| 55 | 85.0 | |||||||||
| 56 | 79.8 | 48 | 56.3 | 100 | ||||||
| 57 | 70.8 | |||||||||
| 58 | 65.1 | |||||||||
| 59 | 62.3 | |||||||||
| 60 | 56.6 | |||||||||
| 61 | 49.6 | |||||||||
| 62 | 48.1 | |||||||||
| 63 | 39.5 | 49 | 39.6 | 100 | ||||||
| 64 | 38.1 | 50 | 27.1 | 100 | ||||||
| 65 | 36.8 | 45 | 145 | |||||||
| 66 | 33.7 | |||||||||
| 67/68 | 28.2 | |||||||||
| 67/68 | 28.2 | |||||||||
| 67/68 | 28.2 | 25.5 | ||||||||
| 69/70 | 24.9 | |||||||||
| 69/70 | 24.9 | |||||||||
| 71 | 22.7 | |||||||||
| 72 | 20.9 | |||||||||
| 73/74 | 14.2 | |||||||||
| 73/74 | 14.2 | |||||||||
| 75 | 12.9 | 47 | 73.9 | 100 | ||||||
| 76 | 10.9 | 5.4 | ||||||||
| 77 | 9.91 | |||||||||
| 78 | 8.50 | |||||||||
| 79 | 8.41 | |||||||||
| 80 | 7.08 | |||||||||
| 81 | 6.60 | |||||||||
| 82/83 | 6.51 | |||||||||
| 82/83 | 6.51 | |||||||||
| 84 | 6.23 | |||||||||
| 85 | 6.03 | |||||||||
| 86/89 | 5.66 | |||||||||
| 86/89 | 5.66 | |||||||||
| 86/89 | 5.66 | |||||||||
| 86/89 | 5.66 | |||||||||
| 90 | 5.10 | |||||||||
| 91 | 3.96 | 0.229 [13] | ~17~ (if by U.S. EIA data (2018) and The World Factbook [14] data (2017) ) | |||||||
| 92 | 2.83 | |||||||||
| 93 | 2.55 | |||||||||
| 95 | 1.13 | |||||||||
| 96/97 | 0.991 | |||||||||
| 96/97 | 0.991 | |||||||||
| 98 | 0.821 | |||||||||
| 99 | 0.142 | |||||||||
| 18.0 | ||||||||||
| ENI, start 2018[15] | 4 | |||||||||
| ENI, start 2018[16] | 3 | |||||||||
| ENI, start 2018[17] | 20 | |||||||||
- Star denotes includes "recoverable portion of shale reserves"
Comparison of proven natural gas reserves from different sources (cubic kilometers, as of 31 December 2014/1 January 2015)
| Source | Canada | Iran | Russia | Saudi Arabia | United States | Venezuela |
|---|---|---|---|---|---|---|
| BP[18] | 2,000 | 34,000 | 32,800 | 8,200 | 9,800 | 5,600 |
| OPEC[19] | 2,028 | 34,020 | 49,541 | 8,489 | 9,580 | 5,617 |
| U.S. Energy Information Administration[20] | 2,535 | 42,426 | 59,619 | 10,393 | 10,441 | 6,960 |
See also
References
- Rank Order - Natural gas - proved reserves. Retrieved June 2014.
- 2011 report on oil and gas companies, Promoting revenue Transparency Transparency International 2011 page reserves 113
- Natural gas - proved reserves. Retrieved 1 December 2013.
- US Energy Information Administration, . Retrieved 23 October 2015.
- OPEC, Table 3.2 Natural gas proven reserves by country Archived 27 February 2018 at the Wayback Machine. Retrieved 1 December 2013.
- BP, BP Statistical Review of World Energy, June 2013. Archived 6 December 2013 at the Wayback Machine
- U.S. Energy Information Administration, International Energy Statistics, accessed 17 Jan. 2019.
- OPEC, Annual Statistical Bulletin 2018
- BP, Statistical Review of World Energy, June 2018.
- https://www.iea.org/reports/natural-gas-information-overview. 2018 data for clarity. Access date 01/17/2021.
- https://www.iea.org/reports/natural-gas-information-overview. 2018 data for clarity. Access date 01/17/2021.
- https://www.cia.gov/the-world-factbook/field/natural-gas-production/ access date - 01/17/2020
- https://www.cia.gov/the-world-factbook/field/natural-gas-production/ access date - 01/17/2020
- ENI, World Gas and Renewables Review, 2018.
- ENI, World Gas and Renewables Review, 2018.
- ENI, World Gas and Renewables Review, 2018.
- BP Statistical Review of World Energy, 2015
- OPEC Statistical Bulletin, 2015.
- International Data: Natural Gas Reserves, US EIA. Retrieved 3 July 2016.