List of federal subjects of Russia by life expectancy
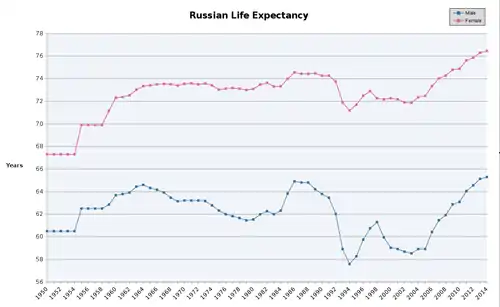
List of the federal subjects of Russia by life expectancy provided by the Russian statistical agency Rosstat. As of 2018, the average life expectancy in Russia was 67.75 years for males and 77.82 years for females.[1]
| Rank | Federal subject | Overall | Male | Female |
|---|---|---|---|---|
| 1 | 82.41 | 79.22 | 85.41 | |
| 2 | 77.84 | 74.28 | 81.19 | |
| 3 | 78.69 | 75.82 | 81.36 | |
| 4 | 75.93 | 71.47 | 80.39 | |
| 5 | 76.28 | 71.92 | 80.23 | |
| 6 | 75.68 | 70.35 | 80.57 | |
| 7 | 75.93 | 71.34 | 79.85 | |
| 8 | 75.43 | 73.01 | 77.67 | |
| 9 | 74.35 | 68.93 | 79.44 | |
| 10 | 74.18 | 69.44 | 78.62 | |
| 11 | 74.28 | 69.94 | 78.40 | |
| 12 | 73.67 | 68.76 | 78.30 | |
| 13 | 73.84 | 68.94 | 78.55 | |
| 14 | 73.47 | 68.46 | 78.25 | |
| 15 | 74.07 | 69.39 | 78.48 | |
| 16 | 74.30 | 69.68 | 78.66 | |
| 17 | 73.66 | 68.64 | 78.47 | |
| 18 | 73.48 | 68.75 | 77.93 | |
| 19 | 73.21 | 67.84 | 78.28 | |
| 20 | 73.52 | 68.55 | 78.08 | |
| 21 | 73.56 | 68.86 | 78.01 | |
| 22 | 72.95 | 67.39 | 78.40 | |
| 23 | 73.21 | 68.51 | 77.67 | |
| 24 | 73.15 | 67.70 | 78.41 | |
| 25 | 72.95 | 67.85 | 77.72 | |
| 26 | 72.95 | 67.24 | 78.62 | |
| 27 | 72.47 | 66.84 | 78.03 | |
| 28 | 72.84 | 67.40 | 78.04 | |
| 29 | 72.92 | 67.94 | 77.54 | |
| 30 | 73.07 | 68.01 | 77.98 | |
| 31 | 72.62 | 66.87 | 78.17 | |
| 32 | 72.17 | 66.86 | 77.23 | |
| 33 | 71.99 | 66.28 | 77.61 | |
| 34 | 73.40 | 68.43 | 78.19 | |
| 35 | 72.45 | 66.49 | 78.15 | |
| 36 | 72.84 | 67.69 | 77.76 | |
| 37 | 72.10 | 66.40 | 77.69 | |
| 38 | 71.69 | 66.01 | 77.03 | |
| 39 | 71.89 | 66.53 | 77.14 | |
| 40 | 72.25 | 66.62 | 77.40 | |
| 41 | 71.87 | 66.76 | 76.66 | |
| 42 | 71.91 | 66.57 | 76.98 | |
| 43 | 72.31 | 66.89 | 77.40 | |
| 44 | 72.06 | 66.69 | 77.40 | |
| 45 | 72.72 | 67.61 | 77.83 | |
| 46 | 71.68 | 66.41 | 76.61 | |
| 47 | 71.56 | 65.81 | 77.09 | |
| 48 | 71.83 | 66.34 | 77.13 | |
| 49 | 71.64 | 66.11 | 76.86 | |
| 50 | 71.52 | 65.94 | 77.18 | |
| 51 | 71.96 | 66.45 | 77.23 | |
| 52 | 71.29 | 65.64 | 76.58 | |
| 53 | 71.71 | 65.60 | 77.78 | |
| 54 | 71.23 | 65.42 | 76.77 | |
| 55 | 71.43 | 65.72 | 77.01 | |
| 56 | 71.29 | 65.47 | 76.85 | |
| 57 | 71.77 | 66.26 | 77.01 | |
| 58 | 70.59 | 65.00 | 76.16 | |
| 59 | 71.16 | 65.62 | 76.65 | |
| 60 | 71.11 | 65.74 | 76.40 | |
| 61 | 71.45 | 65.93 | 76.88 | |
| 62 | 70.78 | 65.03 | 76.55 | |
| 63 | 70.72 | 64.97 | 76.27 | |
| 64 | 70.84 | 65.70 | 75.81 | |
| 65 | 70.56 | 64.77 | 76.14 | |
| 66 | 70.71 | 64.94 | 76.44 | |
| 67 | 70.47 | 64.73 | 76.14 | |
| 68 | 70.48 | 65.52 | 75.51 | |
| 69 | 71.15 | 66.10 | 75.90 | |
| 70 | 69.92 | 64.64 | 75.45 | |
| 71 | 70.09 | 64.91 | 75.72 | |
| 72 | 70.16 | 64.23 | 76.16 | |
| 73 | 70.19 | 64.75 | 75.58 | |
| 74 | 70.26 | 64.34 | 76.01 | |
| 75 | 69.62 | 64.05 | 75.68 | |
| 76 | 69.32 | 63.66 | 74.88 | |
| 77 | 69.31 | 63.32 | 75.19 | |
| 78 | 69.11 | 64.06 | 74.17 | |
| 79 | 68.60 | 63.36 | 73.88 | |
| 80 | 68.99 | 63.78 | 74.32 | |
| 81 | 66.47 | 61.40 | 71.50 | |
| 82 | 63.58 | 59.22 | 67.97 | |
| 72.70 | 67.51 | 77.64 |
See also
References
- "Life expectancy in Russia 2018". Retrieved 7 October 2019.
- "Life expectancy of the Russian Federation since 1950". Demoscope.ru. 26 April 2011. Archived from the original on 14 May 2011. Retrieved 14 May 2011.
- Life Expectancy of the Russian Federation since 1992 Retrieved on 29 May 2008
This article is issued from Wikipedia. The text is licensed under Creative Commons - Attribution - Sharealike. Additional terms may apply for the media files.

