Mabini, Bohol
Mabini, officially the Municipality of Mabini (Cebuano: Lungsod sa Mabini; Tagalog: Bayan ng Mabini), is a 4th class municipality in the province of Bohol, Philippines. According to the 2015 census, it has a population of 27,171 people. [3]
Mabini | |
|---|---|
| Municipality of Mabini | |
 Mabini, Bohol | |
 Map of Bohol with Mabini highlighted | |
OpenStreetMap 
| |
.svg.png.webp) Mabini Location within the Philippines | |
| Coordinates: 9°52′N 124°31′E | |
| Country | |
| Region | Central Visayas (Region VII) |
| Province | Bohol |
| District | 3rd District |
| Founded | 1904 |
| Barangays | 22 (see Barangays) |
| Government | |
| • Type | Sangguniang Bayan |
| • Mayor | Juanito L. Jayoma |
| • Vice Mayor | Renato Tutor |
| • Representative | Kristine Alexie B. Tutor |
| • Electorate | 18,738 voters (2019) |
| Area | |
| • Total | 104.57 km2 (40.37 sq mi) |
| Elevation | 34 m (112 ft) |
| Population | |
| • Total | 27,171 |
| • Density | 260/km2 (670/sq mi) |
| • Households | 6,240 |
| Economy | |
| • Income class | 4th municipal income class |
| • Poverty incidence | 34.14% (2015)[4] |
| • Revenue | ₱79,706,914.95 (2016) |
| Time zone | UTC+8 (PST) |
| ZIP code | 6313 |
| PSGC | |
| IDD : area code | +63 (0)38 |
| Climate type | tropical monsoon climate |
| Native languages | Boholano dialect Cebuano Tagalog |
| Website | www |
The town of Mabini, Bohol celebrates its feast on May 4, to honor the town patron Santa Monica.[5]
History
Established on July 23, 1904,[6] through a resolution approved by then Governor General of the Philippines, the town of Mabini was initially composed of the three large barangays of Libas or Ubayon from Candijay, Batuanan (now Alicia) and Cabulao from Ubay. The efforts of establishing these barangays into a town came from Capitan Canuto Bernales, General Pedro Samsom and Atty. Gabino Sepulveda when the Philippines Governor General issued a directive to organize large barangays into towns.
Capitan Canuto Bernales, General Pedro Samsom and Atty. Gabino Sepulveda were friends and comrades-in-arms during the Filipino-Spanish and Filipino-American revolutions. The idea of naming the town as Mabini came from General Pedro Samson and Atty. Sepulveda, in honor of the hero, Apolinario Mabini, the Sublime Paralytic and Brain of the Revolution . Then provincial Governor Aniceto Clarin handed over the approved resolution to Capitan Canuto Bernales who had to walk all the way to Tagbilaran City to receive it. The approved resolution he receive formally recognized the formation of the town of Mabini. Capitan Canuto Bernales became the first town president of Mabini.[7]
Barangays
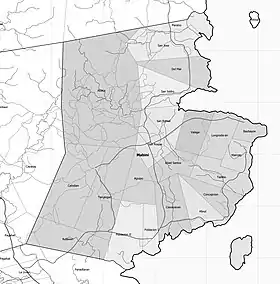
Mabini comprises 22 barangays:
| PSGC | Barangay | Population | ±% p.a. | |||
|---|---|---|---|---|---|---|
| 2015 [3] | 2010 [8] | |||||
| 071231001 | Abaca | 8.9% | 2,413 | 2,349 | 0.51% | |
| 071231002 | Abad Santos | 2.1% | 567 | 720 | −4.45% | |
| 071231003 | Aguipo | 4.5% | 1,231 | 1,368 | −1.99% | |
| 071231005 | Baybayon | 4.8% | 1,314 | 1,508 | −2.59% | |
| 071231006 | Bulawan | 2.0% | 533 | 658 | −3.93% | |
| 071231007 | Cabidian | 3.3% | 903 | 1,040 | −2.65% | |
| 071231009 | Cawayanan | 5.8% | 1,568 | 1,552 | 0.20% | |
| 071231004 | Concepcion (Banlas) | 4.5% | 1,215 | 1,259 | −0.68% | |
| 071231010 | Del Mar | 3.1% | 833 | 759 | 1.79% | |
| 071231011 | Lungsoda‑an | 4.0% | 1,081 | 1,130 | −0.84% | |
| 071231012 | Marcelo | 3.4% | 918 | 1,000 | −1.62% | |
| 071231013 | Minol | 5.1% | 1,399 | 1,414 | −0.20% | |
| 071231014 | Paraiso | 3.0% | 821 | 819 | 0.05% | |
| 071231015 | Poblacion I | 5.2% | 1,405 | 1,425 | −0.27% | |
| 071231016 | Poblacion II | 6.2% | 1,675 | 1,697 | −0.25% | |
| 071231017 | San Isidro | 6.0% | 1,638 | 1,633 | 0.06% | |
| 071231018 | San Jose | 5.2% | 1,403 | 1,427 | −0.32% | |
| 071231019 | San Rafael | 2.5% | 683 | 736 | −1.41% | |
| 071231020 | San Roque (Cabulao) | 9.4% | 2,548 | 2,529 | 0.14% | |
| 071231021 | Tambo | 3.2% | 874 | 914 | −0.85% | |
| 071231022 | Tangkigan | 5.0% | 1,350 | 1,438 | −1.20% | |
| 071231023 | Valaga | 2.9% | 799 | 799 | 0.00% | |
| Total | 27,171 | 28,174 | −0.69% | |||
Climate
| Climate data for Mabini, Bohol | |||||||||||||
|---|---|---|---|---|---|---|---|---|---|---|---|---|---|
| Month | Jan | Feb | Mar | Apr | May | Jun | Jul | Aug | Sep | Oct | Nov | Dec | Year |
| Average high °C (°F) | 28 (82) |
28 (82) |
29 (84) |
31 (88) |
31 (88) |
30 (86) |
30 (86) |
30 (86) |
30 (86) |
29 (84) |
29 (84) |
28 (82) |
29 (85) |
| Average low °C (°F) | 23 (73) |
23 (73) |
23 (73) |
23 (73) |
24 (75) |
24 (75) |
24 (75) |
24 (75) |
24 (75) |
24 (75) |
24 (75) |
23 (73) |
24 (74) |
| Average precipitation mm (inches) | 98 (3.9) |
82 (3.2) |
96 (3.8) |
71 (2.8) |
104 (4.1) |
129 (5.1) |
101 (4.0) |
94 (3.7) |
99 (3.9) |
135 (5.3) |
174 (6.9) |
143 (5.6) |
1,326 (52.3) |
| Average rainy days | 18.0 | 14.1 | 17.1 | 16.8 | 23.7 | 25.7 | 25.8 | 23.3 | 24.2 | 25.9 | 24.0 | 20.6 | 259.2 |
| Source: Meteoblue [9] | |||||||||||||
Demographics
| Year | Pop. | ±% p.a. |
|---|---|---|
| 1918 | 9,005 | — |
| 1939 | 17,473 | +3.21% |
| 1948 | 22,673 | +2.94% |
| 1960 | 14,703 | −3.54% |
| 1970 | 16,223 | +0.99% |
| 1975 | 19,071 | +3.30% |
| 1980 | 20,876 | +1.82% |
| 1990 | 21,854 | +0.46% |
| 1995 | 23,370 | +1.26% |
| 2000 | 27,250 | +3.35% |
| 2007 | 28,788 | +0.76% |
| 2010 | 28,174 | −0.78% |
| 2015 | 27,171 | −0.69% |
| Source: Philippine Statistics Authority [3] [8] [10][11] | ||

References
- Municipality of Mabini | (DILG)
- "Province: Bohol". PSGC Interactive. Quezon City, Philippines: Philippine Statistics Authority. Retrieved 12 November 2016.
- Census of Population (2015). "Region VII (Central Visayas)". Total Population by Province, City, Municipality and Barangay. PSA. Retrieved 20 June 2016.
- "PSA releases the 2015 Municipal and City Level Poverty Estimates". Quezon City, Philippines. Retrieved 12 October 2019.
- "Bohol Festivals Timetable". "www.bohol-philippines.com". Retrieved 2019-04-03.
- "Mabini Bohol Travel Guide". www.bohol-philippines.com. Retrieved 2019-04-17.
- "Brief Historical Background". mabinibohol.gov.ph. Retrieved January 31, 2019.
- Census of Population and Housing (2010). "Region VII (Central Visayas)". Total Population by Province, City, Municipality and Barangay. NSO. Retrieved 29 June 2016.
- "Mabini: Average Temperatures and Rainfall". Meteoblue. Retrieved 9 May 2020.
- Censuses of Population (1903–2007). "Region VII (Central Visayas)". Table 1. Population Enumerated in Various Censuses by Province/Highly Urbanized City: 1903 to 2007. NSO.
- "Province of Bohol". Municipality Population Data. Local Water Utilities Administration Research Division. Retrieved 17 December 2016.
External links
| Wikimedia Commons has media related to Mabini, Bohol. |
- Mabini Profile at PhilAtlas.com
- Philippine Standard Geographic Code
- Mabini Online News
- Municipality of Mabini
- Bohol.ph article on Mabini