Winnipeg Centre
Winnipeg Centre (French: Winnipeg-Centre) is a federal electoral district in Manitoba, Canada, that has been represented in the House of Commons of Canada from 1917 to 1925 and since 1997.
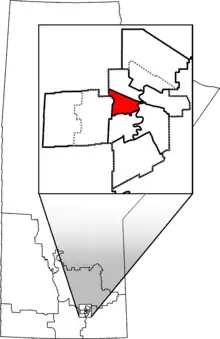 Winnipeg Centre in relation to other Manitoba federal electoral districts as of the 2013 Representation Order. Dotted line shows Winnipeg city limits. | |||
| Federal electoral district | |||
| Legislature | House of Commons | ||
| MP |
New Democratic | ||
| District created | 1996 | ||
| First contested | 1997 | ||
| Last contested | 2019 | ||
| District webpage | profile, map | ||
| Demographics | |||
| Population (2011)[1] | 82,026 | ||
| Electors (2015) | 54,719 | ||
| Area (km²)[2] | 28.42 | ||
| Pop. density (per km²) | 2,886.2 | ||
| Census division(s) | Division No. 11 | ||
| Census subdivision(s) | Winnipeg | ||
History
This riding was originally created in 1914 from Winnipeg and Selkirk ridings.
In 1924, it was abolished, and parts transferred to Winnipeg North Centre and Winnipeg South Centre ridings.
In 1997, it was re-created from Winnipeg North Centre and Winnipeg South Centre.
This riding was left unchanged after the 2012 electoral redistribution.
Members of Parliament
This riding has elected the following Members of Parliament:
| Parliament | Years | Member | Party | |
|---|---|---|---|---|
| Winnipeg Centre Riding created from Winnipeg and Selkirk |
||||
| 13th | 1917–1921 | George William Andrews | Government (Unionist) | |
| 14th | 1921–1925 | J.S. Woodsworth | Independent Labour | |
| Riding dissolved into Winnipeg North Centre and Winnipeg South Centre | ||||
| Riding re-created from Winnipeg North Centre, Winnipeg St. James, Winnipeg North and Winnipeg South Centre |
||||
| 36th | 1997–2000 | Pat Martin | New Democratic | |
| 37th | 2000–2004 | |||
| 38th | 2004–2006 | |||
| 39th | 2006–2008 | |||
| 40th | 2008–2011 | |||
| 41st | 2011–2015 | |||
| 42nd | 2015–2019 | Robert-Falcon Ouellette | Liberal | |
| 43rd | 2019–present | Leah Gazan | New Democratic | |
Election results
1997–present
| 2019 Canadian federal election | ||||||||
|---|---|---|---|---|---|---|---|---|
| Party | Candidate | Votes | % | ±% | Expenditures | |||
| New Democratic | Leah Gazan | 13,073 | 41.2 | +13.2 | $81,565.86 | |||
| Liberal | Robert-Falcon Ouellette | 10,704 | 33.7 | -20.8 | none listed | |||
| Conservative | Ryan Dyck | 5,561 | 17.5 | +5.1 | $16,427.27 | |||
| Green | Andrea Shalay | 1,661 | 5.2 | +1.1 | none listed | |||
| People's | Yogi Henderson | 474 | 1.5 | – | none listed | |||
| Christian Heritage | Stephanie Hein | 251 | 0.8 | +0.1 | none listed | |||
| Total valid votes/Expense limit | 31,724 | 100.0 | ||||||
| Total rejected ballots | 274 | |||||||
| Turnout | 31,998 | 54.2 | ||||||
| Eligible voters | 59,012 | |||||||
| New Democratic gain from Liberal | Swing | +17.0 | ||||||
| Source: Elections Canada[3][4] | ||||||||
| 2015 Canadian federal election | ||||||||
|---|---|---|---|---|---|---|---|---|
| Party | Candidate | Votes | % | ±% | Expenditures | |||
| Liberal | Robert-Falcon Ouellette | 18,471 | 54.51 | +43.44 | $78,138.26 | |||
| New Democratic | Pat Martin | 9,490 | 28.01 | -25.65 | $104,378.44 | |||
| Conservative | Allie Szarkiewicz | 4,189 | 12.36 | -15.28 | $32,966.82 | |||
| Green | Don Woodstock | 1,379 | 4.07 | -2.98 | $38,782.49 | |||
| Christian Heritage | Scott Miller | 221 | 0.65 | – | $1,210.15 | |||
| Communist | Darrell Rankin | 135 | 0.40 | -0.19 | – | |||
| Total valid votes/Expense limit | 33,885 | 100.00 | $192,170.62 | |||||
| Total rejected ballots | 281 | 0.82 | – | |||||
| Turnout | 34,166 | 61.41 | – | |||||
| Eligible voters | 55,633 | |||||||
| Liberal gain from New Democratic | Swing | +34.59 | ||||||
| Source: Elections Canada[5][6][7] | ||||||||
| 2011 Canadian federal election | ||||||||
|---|---|---|---|---|---|---|---|---|
| Party | Candidate | Votes | % | ±% | Expenditures | |||
| New Democratic | Pat Martin | 13,928 | 53.66 | +4.74 | – | |||
| Conservative | Bev Pitura | 7,173 | 27.64 | +5.99 | – | |||
| Liberal | Allan Wise | 2,872 | 11.07 | -4.55 | – | |||
| Green | Jacqueline Romanow | 1,830 | 7.05 | -4.01 | – | |||
| Communist | Darrell Rankin | 152 | 0.59 | +0.12 | – | |||
| Total valid votes/Expense limit | 25,955 | 100.00 | – | |||||
| Total rejected ballots | 248 | 0.95 | +0.05 | |||||
| Turnout | 26,203 | 49.02 | +6 | |||||
| Eligible voters | 53,452 | – | – | |||||
| 2008 Canadian federal election | ||||||||
|---|---|---|---|---|---|---|---|---|
| Party | Candidate | Votes | % | ±% | Expenditures | |||
| New Democratic | Pat Martin | 12,285 | 48.92 | +0.5 | $42,608 | |||
| Conservative | Kenny Daodu | 5,437 | 21.65 | +2.1 | $20,177 | |||
| Liberal | Daniel Hurley | 3,922 | 15.62 | -8.7 | $37,980 | |||
| Green | Jessie Klassen | 2,777 | 11.06 | +4.0 | $2,733 | |||
| Independent | Joe Chan | 226 | 0.90 | – | – | |||
| First Peoples National | Lyle Morrisseau | 212 | 0.84 | – | – | |||
| Independent | Ed Ackerman | 135 | 0.54 | – | – | |||
| Communist | Darrell Rankin | 119 | 0.47 | -0.2 | – | |||
| Total valid votes/Expense limit | 25,113 | 100.00 | $77,206 | |||||
| Total rejected ballots | 227 | 0.90 | +0.1 | |||||
| Turnout | 25,340 | 43 | -6 | |||||
| 2006 Canadian federal election | ||||||||
|---|---|---|---|---|---|---|---|---|
| Party | Candidate | Votes | % | ±% | Expenditures | |||
| New Democratic | Pat Martin | 13,805 | 48.4 | +3.0 | $58,778 | |||
| Liberal | Ray St. Germain | 6,940 | 24.3 | -10.4 | $27,375 | |||
| Conservative | Helen Sterzer | 5,554 | 19.5 | +5.9 | $37,740 | |||
| Green | Gary Gervais | 2,010 | 7.1 | +2.8 | $2,651 | |||
| Communist | Anna-Celestrya Carr | 199 | 0.7 | +0.3 | $295 | |||
| Total valid votes | 28,508 | 100.0 | – | |||||
| Total rejected ballots | 231 | 0.8 | +0.1 | |||||
| Turnout | 28,739 | 49 | +4 | |||||
| 2004 Canadian federal election | ||||||||
|---|---|---|---|---|---|---|---|---|
| Party | Candidate | Votes | % | ±% | Expenditures | |||
| New Democratic | Pat Martin | 12,149 | 45.4 | +4.1 | $51,914 | |||
| Liberal | David Northcott | 9,285 | 34.7 | +0.6 | $67,134 | |||
| Conservative | Robert Eng | 3,631 | 13.6 | -8.0 | $7,572 | |||
| Green | Robin (Pilar) Faye | 1,151 | 4.3 | +1.7 | $2,087 | |||
| Marijuana | John M. Siedleski | 346 | 1.3 | – | – | |||
| Communist | Anna-Celestrya Carr | 114 | 0.4 | -0.1 | $654 | |||
| Independent | Douglas Edward Schweitzer | 92 | 0.3 | – | – | |||
| Total valid votes | 26,768 | 100.0 | – | |||||
| Total rejected ballots | 188 | 0.7 | ||||||
| Turnout | 26,956 | 45.1 | ||||||
Note: Conservative vote is compared to the total of the Canadian Alliance vote and Progressive Conservative vote in 2000 election.
| 2000 Canadian federal election | ||||||||
|---|---|---|---|---|---|---|---|---|
| Party | Candidate | Votes | % | ±% | ||||
| New Democratic | Pat Martin | 11,263 | 41.3 | +0.4 | ||||
| Liberal | Kevin Lamoureux | 9,310 | 34.1 | -2.7 | ||||
| Alliance | Reg Smith | 3,975 | 14.6 | +3.0 | ||||
| Progressive Conservative | Michel Allard | 1,915 | 7.0 | -2.1 | ||||
| Green | Mikel Magnusson | 698 | 2.6 | – | ||||
| Communist | Harold Dyck | 134 | 0.5 | – | ||||
| Total valid votes | 27,295 | 100.0 | ||||||
Note: Canadian Alliance vote is compared to the Reform vote in 1997 election.
| 1997 Canadian federal election | ||||||||
|---|---|---|---|---|---|---|---|---|
| Party | Candidate | Votes | % | |||||
| New Democratic | Pat Martin | 10,979 | 40.9 | |||||
| Liberal | David Walker | 9,895 | 36.9 | |||||
| Reform | Reginald A. Smith | 3,095 | 11.5 | |||||
| Progressive Conservative | Campbell Alexander | 2,442 | 9.1 | |||||
| Independent | Greg Krawchuk | 148 | 0.6 | |||||
| Marxist–Leninist | Glenn Michalchuk | 136 | 0.5 | |||||
| Independent | Darrell Rankin | 108 | 0.4 | |||||
| Independent | Didz Zuzens | 44 | 0.2 | |||||
| Total valid votes | 26,847 | 100.0 | ||||||
1917–1925
| 1921 Canadian federal election | ||||||||
|---|---|---|---|---|---|---|---|---|
| Party | Candidate | Votes | % | ±% | ||||
| Labour | James Shaver Woodsworth | 7,774 | 40.1 | – | ||||
| Conservative | Norman Kitson McIvor | 4,034 | 20.8 | -63.8 | ||||
| Liberal | John W. Wilton | 4,032 | 20.8 | +5.4 | ||||
| Independent | Harriet S. Dick | 2,314 | 11.9 | – | ||||
| Independent | George William Andrews | 1,220 | 6.3 | – | ||||
| Total valid votes | 19,374 | 100.0 | ||||||
Note: Conservative vote is compared to Unionist vote in 1917 election.
| 1917 Canadian federal election | ||||||||
|---|---|---|---|---|---|---|---|---|
| Party | Candidate | Votes | % | |||||
| Government (Unionist) | George William Andrews | 25,580 | 84.6 | |||||
| Opposition (Laurier Liberals) | Robert Sinclair Ward | 4,650 | 15.4 | |||||
| Total valid votes | 30,230 | 100.0 | ||||||
References
- "(Code 46011) Census Profile". 2011 census. Statistics Canada. 2012. Retrieved 2011-03-03.
Notes
- Statistics Canada: 2011
- Statistics Canada: 2011
- "List of confirmed candidates". Elections Canada. Retrieved October 4, 2019.
- "Election Night Results". Elections Canada. Retrieved November 9, 2019.
- Elections Canada – Confirmed candidates for Winnipeg Centre, 30 September 2015
- Elections Canada – Preliminary Election Expenses Limits for Candidates
- http://www.elections.ca/WPAPPS/WPF/EN/CC/DistrictReport?act=C23&eventid=41&returntype=1&option=3&queryid=72c1eb8bd75a4964986c724956f5a358