Results breakdown of the 1979 Spanish local elections (Catalonia)
This is the results breakdown of the local elections held in Catalonia on 3 April 1979. The following tables show detailed results in the autonomous community's most populous municipalities, sorted alphabetically.[1][2][3]
Overall
| Parties and coalitions | Popular vote | Councillors | ||||
|---|---|---|---|---|---|---|
| Votes | % | ±pp | Total | +/− | ||
| Socialists' Party of Catalonia (PSC–PSOE) | 727,931 | 27.15 | n/a | 945 | n/a | |
| Socialists' Party–Unified Socialist Party of Catalonia (PSC–PSUC) | 7,766 | 0.29 | n/a | 17 | n/a | |
| Unified Socialist Party of Catalonia (PSUC) | 543,156 | 20.26 | n/a | 549 | n/a | |
| Convergence and Union (CiU) | 509,128 | 18.99 | n/a | 1,782 | n/a | |
| Centrists of Catalonia (CC–UCD) | 362,405 | 13.52 | n/a | 1,272 | n/a | |
| Republican Left of Catalonia–National Front of Catalonia (ERC–FNC) | 103,547 | 3.86 | n/a | 210 | n/a | |
| Democratic Coalition (CD) | 32,840 | 1.22 | n/a | 18 | n/a | |
| Workers' Party of Catalonia–Communist Unity (PTC–UC) | 28,934 | 1.08 | n/a | 10 | n/a | |
| Communists of Catalonia (ComC) | 14,529 | 0.54 | n/a | 0 | n/a | |
| Communist Movement–Organization of Communist Left (MC–OEC) | 11,755 | 0.44 | n/a | 0 | n/a | |
| Socialist Party of National Liberation (PSAN) | 8,878 | 0.33 | n/a | 5 | n/a | |
| Revolutionary Communist League (LCR) | 5,099 | 0.19 | n/a | 1 | n/a | |
| Workers' Revolutionary Organization (ORT) | 4,391 | 0.16 | n/a | 4 | n/a | |
| Social Christian Democracy of Catalonia (DSCC) | 3,171 | 0.12 | n/a | 0 | n/a | |
| Union of Citizens of Badalona (UCBGI) | 2,952 | 0.11 | n/a | 0 | n/a | |
| Olot Independents (Ind.Olot) | 2,920 | 0.11 | n/a | 5 | n/a | |
| For Berga and for Catalonia (PBPC) | 2,882 | 0.11 | n/a | 7 | n/a | |
| Candidacy for the Neighbors' Participation in the City Council (CPV) | 2,832 | 0.11 | n/a | 2 | n/a | |
| Democratic Municipal Action (AMD) | 2,802 | 0.10 | n/a | 45 | n/a | |
| Straightening and Progress (RP) | 2,704 | 0.10 | n/a | 7 | n/a | |
| Agreement of Independents for Badalona (EI) | 2,312 | 0.09 | n/a | 0 | n/a | |
| Spanish Phalanx of the CNSO (FE–JONS) | 1,755 | 0.07 | n/a | 0 | n/a | |
| Unity of Aran (UA) | 1,341 | 0.05 | n/a | 19 | n/a | |
| People's Unitary Candidacy of Arbucias (CUPA) | 1,317 | 0.05 | n/a | 7 | n/a | |
| Liberal Party of Catalonia (PLC) | 1,155 | 0.04 | n/a | 0 | n/a | |
| Communist Unity Group of Terrassa (AUCT) | 1,031 | 0.04 | n/a | 0 | n/a | |
| Others | 289,485 | 10.80 | n/a | 3,380 | n/a | |
| Blank ballots | 10,078 | 0.38 | n/a | |||
| Total | 2,681,330 | 100.00 | 8,268 | n/a | ||
| Valid votes | 2,681,330 | 99.38 | n/a | |||
| Invalid votes | 16,852 | 0.62 | n/a | |||
| Votes cast / turnout | 2,698,182 | 61.46 | n/a | |||
| Abstentions | 1,692,062 | 38.54 | n/a | |||
| Registered voters | 4,390,244 | |||||
| Sources[1][2][4][5] | ||||||
City control
The following table lists party control in the most populous municipalities, including provincial capitals (shown in bold).[1][2]
| Municipality | Population | New control | |
|---|---|---|---|
| Badalona | 229,780 | Unified Socialist Party of Catalonia (PSUC) | |
| Barcelona | 1,754,579 | Socialists' Party of Catalonia (PSC–PSOE) | |
| Cornellá | 91,563 | Unified Socialist Party of Catalonia (PSUC) | |
| Gerona | 83,929 | Socialists' Party of Catalonia (PSC–PSOE) | |
| Hospitalet | 289,747 | Socialists' Party of Catalonia (PSC–PSOE) | |
| Lérida | 106,190 | Socialists' Party of Catalonia (PSC–PSOE) | |
| Mataró | 96,942 | Socialists' Party of Catalonia (PSC–PSOE) | |
| Reus | 82,407 | Socialists' Party of Catalonia (PSC–PSOE) | |
| Sabadell | 187,247 | Unified Socialist Party of Catalonia (PSUC) | |
| Sant Cugat del Vallès | 31,748 | Socialists' Party of Catalonia (PSC–PSOE) | |
| Santa Coloma de Gramanet | 140,613 | Unified Socialist Party of Catalonia (PSUC) | |
| Tarragona | 108,131 | Socialists' Party of Catalonia (PSC–PSOE) | |
| Tarrasa | 157,442 | Socialists' Party of Catalonia (PSC–PSOE) | |
Municipalities
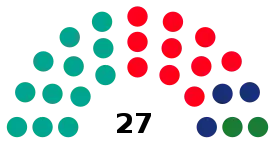
Badalona
- Population: 229,780
 | ||||||
| Parties and coalitions | Popular vote | Seats | ||||
|---|---|---|---|---|---|---|
| Votes | % | ±pp | Total | +/− | ||
| Unified Socialist Party of Catalonia (PSUC) | 29,976 | 34.89 | n/a | 12 | n/a | |
| Socialists' Party of Catalonia (PSC–PSOE) | 26,674 | 31.05 | n/a | 10 | n/a | |
| Convergence and Union (CiU) | 9,212 | 10.72 | n/a | 3 | n/a | |
| Centrists of Catalonia (CC–UCD) | 7,419 | 8.64 | n/a | 2 | n/a | |
| Union of Citizens of Badalona (UCBGI) | 2,952 | 3.44 | n/a | 0 | n/a | |
| Workers' Party of Catalonia–Communist Unity (PTC–UC) | 2,937 | 3.42 | n/a | 0 | n/a | |
| Agreement of Independents for Badalona (EI) | 2,312 | 2.69 | n/a | 0 | n/a | |
| Republican Left of Catalonia–National Front of Catalonia (ERC–FNC) | 1,586 | 1.85 | n/a | 0 | n/a | |
| Communists of Catalonia (ComC) | 1,536 | 1.79 | n/a | 0 | n/a | |
| Communist Movement–Organization of Communist Left (MC–OEC) | 638 | 0.74 | n/a | 0 | n/a | |
| Revolutionary Communist League (LCR) | 404 | 0.47 | n/a | 0 | n/a | |
| Workers' Revolutionary Organization (ORT) | 0 | 0.00 | n/a | 0 | n/a | |
| Democratic Coalition (CD) | 0 | 0.00 | n/a | 0 | n/a | |
| Blank ballots | 263 | 0.31 | n/a | |||
| Total | 85,909 | 27 | n/a | |||
| Valid votes | 85,909 | 99.48 | n/a | |||
| Invalid votes | 447 | 0.52 | n/a | |||
| Votes cast / turnout | 86,356 | 59.40 | n/a | |||
| Abstentions | 59,013 | 40.60 | n/a | |||
| Registered voters | 145,369 | |||||
| Sources[1][2][6][7] | ||||||
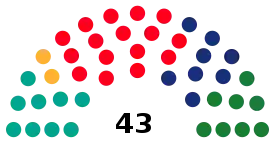
Barcelona
- Population: 1,754,579
 | ||||||
| Parties and coalitions | Popular vote | Seats | ||||
|---|---|---|---|---|---|---|
| Votes | % | ±pp | Total | +/− | ||
| Socialists' Party of Catalonia (PSC–PSOE) | 272,512 | 34.05 | n/a | 16 | n/a | |
| Unified Socialist Party of Catalonia (PSUC) | 151,288 | 18.90 | n/a | 9 | n/a | |
| Convergence and Union (CiU) | 148,806 | 18.59 | n/a | 8 | n/a | |
| Centrists of Catalonia (CC–UCD) | 133,885 | 16.73 | n/a | 8 | n/a | |
| Republican Left of Catalonia–National Front of Catalonia (ERC–FNC) | 41,845 | 5.23 | n/a | 2 | n/a | |
| Democratic Coalition (CD) | 24,039 | 3.00 | n/a | 0 | n/a | |
| Workers' Party of Catalonia–Communist Unity (PTC–UC) | 8,832 | 1.10 | n/a | 0 | n/a | |
| Communist Movement–Organization of Communist Left (MC–OEC) | 4,259 | 0.53 | n/a | 0 | n/a | |
| Socialist Party of National Liberation (PSAN) | 3,123 | 0.39 | n/a | 0 | n/a | |
| Social Christian Democracy of Catalonia (DSCC) | 2,950 | 0.37 | n/a | 0 | n/a | |
| Revolutionary Communist League (LCR) | 1,939 | 0.24 | n/a | 0 | n/a | |
| Catalan Left Bloc (BEC) | 0 | 0.00 | n/a | 0 | n/a | |
| Democratic Municipal Action (AMD) | 0 | 0.00 | n/a | 0 | n/a | |
| New Force (FN) | 0 | 0.00 | n/a | 0 | n/a | |
| Republican Left (IR) | 0 | 0.00 | n/a | 0 | n/a | |
| List for Workers' Courts (LCO) | 0 | 0.00 | n/a | 0 | n/a | |
| Workers' Revolutionary Organization (ORT) | 0 | 0.00 | n/a | 0 | n/a | |
| Blank ballots | 2,547 | 0.32 | n/a | |||
| Total | 800,428 | 43 | n/a | |||
| Valid votes | 800,428 | 99.63 | n/a | |||
| Invalid votes | 2,991 | 0.37 | n/a | |||
| Votes cast / turnout | 803,419 | 54.27 | n/a | |||
| Abstentions | 677,034 | 45.73 | n/a | |||
| Registered voters | 1,480,453 | |||||
| Sources[1][2][8][9][10] | ||||||
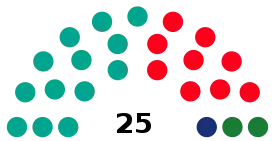
Cornellá
- Population: 91,563
 | ||||||
| Parties and coalitions | Popular vote | Seats | ||||
|---|---|---|---|---|---|---|
| Votes | % | ±pp | Total | +/− | ||
| Unified Socialist Party of Catalonia (PSUC) | 18,659 | 46.21 | n/a | 13 | n/a | |
| Socialists' Party of Catalonia (PSC–PSOE) | 12,937 | 32.04 | n/a | 9 | n/a | |
| Centrists of Catalonia (CC–UCD) | 2,940 | 7.28 | n/a | 2 | n/a | |
| Convergence and Union (CiU) | 2,621 | 6.49 | n/a | 1 | n/a | |
| Workers' Party of Catalonia–Communist Unity (PTC–UC) | 1,169 | 2.89 | n/a | 0 | n/a | |
| Independents (INDEP) | 853 | 2.11 | n/a | 0 | n/a | |
| Communists of Catalonia (ComC) | 595 | 1.47 | n/a | 0 | n/a | |
| Communist Movement–Organization of Communist Left (MC–OEC) | 351 | 0.87 | n/a | 0 | n/a | |
| Spanish Phalanx of the CNSO (FE–JONS) | 165 | 0.41 | n/a | 0 | n/a | |
| Workers' Revolutionary Organization (ORT) | 0 | 0.00 | n/a | 0 | n/a | |
| Blank ballots | 90 | 0.22 | n/a | |||
| Total | 40,380 | 25 | n/a | |||
| Valid votes | 40,380 | 99.47 | n/a | |||
| Invalid votes | 216 | 0.53 | n/a | |||
| Votes cast / turnout | 40,596 | 64.01 | n/a | |||
| Abstentions | 22,828 | 35.99 | n/a | |||
| Registered voters | 63,424 | |||||
| Sources[1][2][11][12] | ||||||
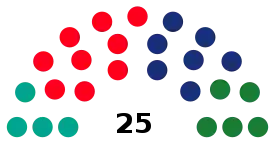
Gerona
- Population: 83,929
 | ||||||
| Parties and coalitions | Popular vote | Seats | ||||
|---|---|---|---|---|---|---|
| Votes | % | ±pp | Total | +/− | ||
| Socialists' Party of Catalonia (PSC–PSOE) | 11,746 | 31.98 | n/a | 9 | n/a | |
| Convergence and Union (CiU) | 9,284 | 25.27 | n/a | 7 | n/a | |
| Centrists of Catalonia (CC–UCD) | 7,674 | 20.89 | n/a | 5 | n/a | |
| Unified Socialist Party of Catalonia (PSUC) | 6,061 | 16.50 | n/a | 4 | n/a | |
| Communists of Catalonia (ComC) | 1,384 | 3.77 | n/a | 0 | n/a | |
| Workers' Party of Catalonia–Communist Unity (PTC–UC) | 474 | 1.29 | n/a | 0 | n/a | |
| Blank ballots | 110 | 0.30 | n/a | |||
| Total | 36,733 | 25 | n/a | |||
| Valid votes | 36,733 | 99.48 | n/a | |||
| Invalid votes | 191 | 0.52 | n/a | |||
| Votes cast / turnout | 36,924 | 64.49 | n/a | |||
| Abstentions | 20,331 | 35.51 | n/a | |||
| Registered voters | 57,255 | |||||
| Sources[1][2][13][14] | ||||||
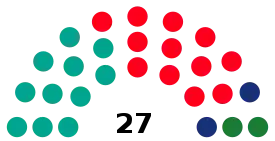
Hospitalet
- Population: 289,747
 | ||||||
| Parties and coalitions | Popular vote | Seats | ||||
|---|---|---|---|---|---|---|
| Votes | % | ±pp | Total | +/− | ||
| Socialists' Party of Catalonia (PSC–PSOE) | 48,687 | 41.09 | n/a | 12 | n/a | |
| Unified Socialist Party of Catalonia (PSUC) | 41,457 | 34.99 | n/a | 11 | n/a | |
| Centrists of Catalonia (CC–UCD) | 10,581 | 8.93 | n/a | 2 | n/a | |
| Convergence and Union (CiU) | 8,783 | 7.41 | n/a | 2 | n/a | |
| Workers' Party of Catalonia–Communist Unity (PTC–UC) | 3,918 | 3.31 | n/a | 0 | n/a | |
| Communists of Catalonia (ComC) | 2,135 | 1.80 | n/a | 0 | n/a | |
| Republican Left of Catalonia–National Front of Catalonia (ERC–FNC) | 1,842 | 1.55 | n/a | 0 | n/a | |
| Communist Movement–Organization of Communist Left (MC–OEC) | 672 | 0.57 | n/a | 0 | n/a | |
| Workers' Revolutionary Organization (ORT) | 0 | 0.00 | n/a | 0 | n/a | |
| Democratic Coalition (CD) | 0 | 0.00 | n/a | 0 | n/a | |
| Blank ballots | 405 | 0.34 | n/a | |||
| Total | 118,480 | 27 | n/a | |||
| Valid votes | 118,480 | 99.50 | n/a | |||
| Invalid votes | 590 | 0.50 | n/a | |||
| Votes cast / turnout | 119,070 | 58.58 | n/a | |||
| Abstentions | 84,886 | 41.62 | n/a | |||
| Registered voters | 203,956 | |||||
| Sources[1][2][15][16] | ||||||
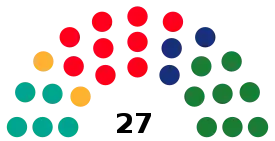
Lérida
- Population: 106,190
 | ||||||
| Parties and coalitions | Popular vote | Seats | ||||
|---|---|---|---|---|---|---|
| Votes | % | ±pp | Total | +/− | ||
| Socialists' Party of Catalonia (PSC–PSOE) | 12,593 | 31.25 | n/a | 9 | n/a | |
| Centrists of Catalonia (CC–UCD) | 10,157 | 25.21 | n/a | 8 | n/a | |
| Unified Socialist Party of Catalonia (PSUC) | 7,214 | 17.90 | n/a | 5 | n/a | |
| Convergence and Union (CiU) | 4,759 | 11.81 | n/a | 3 | n/a | |
| Republican Left of Catalonia (ERC) | 2,914 | 7.23 | n/a | 2 | n/a | |
| Workers' Party of Catalonia–Communist Unity (PTC–UC) | 1,217 | 3.02 | n/a | 0 | n/a | |
| Democratic Coalition (CD) | 1,003 | 2.49 | n/a | 0 | n/a | |
| Carlist Party of Catalonia (PCdC) | 307 | 0.76 | n/a | 9 | n/a | |
| Blank ballots | 130 | 0.32 | n/a | |||
| Total | 40,294 | 27 | n/a | |||
| Valid votes | 40,294 | 99.36 | n/a | |||
| Invalid votes | 258 | 0.64 | n/a | |||
| Votes cast / turnout | 40,552 | 52.43 | n/a | |||
| Abstentions | 36,787 | 47.57 | n/a | |||
| Registered voters | 77,339 | |||||
| Sources[1][2][17][18] | ||||||
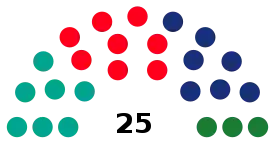
Mataró
- Population: 96,942
 | ||||||
| Parties and coalitions | Popular vote | Seats | ||||
|---|---|---|---|---|---|---|
| Votes | % | ±pp | Total | +/− | ||
| Socialists' Party of Catalonia (PSC–PSOE) | 14,078 | 31.36 | n/a | 8 | n/a | |
| Unified Socialist Party of Catalonia (PSUC) | 12,093 | 26.94 | n/a | 7 | n/a | |
| Convergence and Union (CiU) | 11,587 | 25.81 | n/a | 7 | n/a | |
| Centrists of Catalonia (CC–UCD) | 5,580 | 12.43 | n/a | 3 | n/a | |
| Republican Left of Catalonia–National Front of Catalonia (ERC–FNC) | 1,444 | 3.22 | n/a | 0 | n/a | |
| Blank ballots | 111 | 0.25 | n/a | |||
| Total | 44,893 | 25 | n/a | |||
| Valid votes | 44,893 | 99.69 | n/a | |||
| Invalid votes | 138 | 0.31 | n/a | |||
| Votes cast / turnout | 45,031 | 65.72 | n/a | |||
| Abstentions | 23,492 | 34.28 | n/a | |||
| Registered voters | 68,523 | |||||
| Sources[1][2][19][20] | ||||||
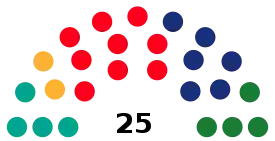
Reus
- Population: 82,407
 | ||||||
| Parties and coalitions | Popular vote | Seats | ||||
|---|---|---|---|---|---|---|
| Votes | % | ±pp | Total | +/− | ||
| Socialists' Party of Catalonia (PSC–PSOE) | 9,512 | 31.26 | n/a | 9 | n/a | |
| Convergence and Union (CiU) | 6,468 | 21.26 | n/a | 6 | n/a | |
| Unified Socialist Party of Catalonia (PSUC) | 5,110 | 16.79 | n/a | 4 | n/a | |
| Centrists of Catalonia (CC–UCD) | 4,978 | 16.36 | n/a | 4 | n/a | |
| Republican Left of Catalonia–National Front of Catalonia (ERC–FNC) | 2,445 | 8.04 | n/a | 2 | n/a | |
| Conservatives of Catalonia (CiC) | 686 | 2.25 | n/a | 0 | n/a | |
| Workers' Party of Catalonia–Communist Unity (PTC–UC) | 546 | 1.79 | n/a | 0 | n/a | |
| Democratic Coalition (CD) | 503 | 1.65 | n/a | 0 | n/a | |
| Workers' Revolutionary Organization (ORT) | 109 | 0.36 | n/a | 0 | n/a | |
| Blank ballots | 70 | 0.23 | n/a | |||
| Total | 30,427 | 25 | n/a | |||
| Valid votes | 30,427 | 99.53 | n/a | |||
| Invalid votes | 143 | 0.47 | n/a | |||
| Votes cast / turnout | 30,570 | 53.71 | n/a | |||
| Abstentions | 26,343 | 46.29 | n/a | |||
| Registered voters | 56,913 | |||||
| Sources[1][2][21][22] | ||||||
Sabadell
- Population: 187,247
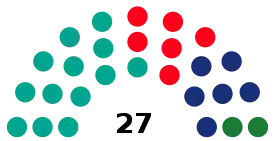 | ||||||
| Parties and coalitions | Popular vote | Seats | ||||
|---|---|---|---|---|---|---|
| Votes | % | ±pp | Total | +/− | ||
| Unified Socialist Party of Catalonia (PSUC) | 37,590 | 43.52 | n/a | 13 | n/a | |
| Socialists' Party of Catalonia (PSC–PSOE) | 17,820 | 20.63 | n/a | 6 | n/a | |
| Convergence and Union (CiU) | 16,869 | 19.53 | n/a | 6 | n/a | |
| Centrists of Catalonia (CC–UCD) | 7,460 | 8.64 | n/a | 2 | n/a | |
| Communist Movement–Organization of Communist Left (MC–OEC) | 1,510 | 1.75 | n/a | 0 | n/a | |
| Republican Left of Catalonia–National Front of Catalonia (ERC–FNC) | 1,256 | 1.45 | n/a | 0 | n/a | |
| Liberal Party of Catalonia (PLC) | 1,155 | 1.34 | n/a | 0 | n/a | |
| Popular Unity Candidacy (CUP) | 1,033 | 1.20 | n/a | 0 | n/a | |
| Workers' Party of Catalonia–Communist Unity (PTC–UC) | 823 | 0.95 | n/a | 0 | n/a | |
| Republican Left (IR) | 645 | 0.75 | n/a | 0 | n/a | |
| Blank ballots | 223 | 0.26 | n/a | |||
| Total | 86,384 | 27 | n/a | |||
| Valid votes | 86,384 | 99.62 | n/a | |||
| Invalid votes | 333 | 0.38 | n/a | |||
| Votes cast / turnout | 86,717 | 66.91 | n/a | |||
| Abstentions | 42,884 | 33.09 | n/a | |||
| Registered voters | 129,601 | |||||
| Sources[1][2][23][24] | ||||||
Sant Cugat del Vallès
- Population: 31,748
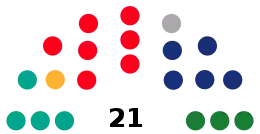 | ||||||
| Parties and coalitions | Popular vote | Seats | ||||
|---|---|---|---|---|---|---|
| Votes | % | ±pp | Total | +/− | ||
| Socialists' Party of Catalonia (PSC–PSOE) | 3,525 | 30.20 | n/a | 7 | n/a | |
| Convergence and Union (CiU) | 2,595 | 22.23 | n/a | 5 | n/a | |
| Unified Socialist Party of Catalonia (PSUC) | 2,266 | 19.42 | n/a | 4 | n/a | |
| Centrists of Catalonia (CC–UCD) | 1,512 | 12.96 | n/a | 3 | n/a | |
| Independents for Sant Cugat (ISC) | 771 | 6.61 | n/a | 1 | n/a | |
| Republican Left of Catalonia–National Front of Catalonia (ERC–FNC) | 673 | 5.77 | n/a | 1 | n/a | |
| Catalan Left Bloc (BEC) | 252 | 2.16 | n/a | 0 | n/a | |
| Communist Movement–Organization of Communist Left (MC–OEC) | 53 | 0.45 | n/a | 0 | n/a | |
| Blank ballots | 24 | 0.21 | n/a | |||
| Total | 11,671 | 21 | n/a | |||
| Valid votes | 11,671 | 99.67 | n/a | |||
| Invalid votes | 39 | 0.33 | n/a | |||
| Votes cast / turnout | 11,710 | 53.42 | n/a | |||
| Abstentions | 10,212 | 46.58 | n/a | |||
| Registered voters | 21,922 | |||||
| Sources[1][2][25][26] | ||||||
Santa Coloma de Gramanet
- Population: 140,613
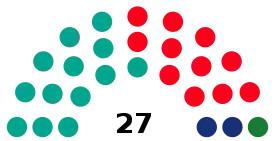 | ||||||
| Parties and coalitions | Popular vote | Seats | ||||
|---|---|---|---|---|---|---|
| Votes | % | ±pp | Total | +/− | ||
| Unified Socialist Party of Catalonia (PSUC) | 26,065 | 45.31 | n/a | 13 | n/a | |
| Socialists' Party of Catalonia (PSC–PSOE) | 20,801 | 36.16 | n/a | 11 | n/a | |
| Convergence and Union (CiU) | 3,828 | 6.65 | n/a | 2 | n/a | |
| Centrists of Catalonia (CC–UCD) | 3,226 | 5.61 | n/a | 1 | n/a | |
| Communist Movement–Organization of Communist Left (MC–OEC) | 1,158 | 2.01 | n/a | 0 | n/a | |
| Workers' Party of Catalonia–Communist Unity (PTC–UC) | 1,104 | 1.92 | n/a | 0 | n/a | |
| Communists of Catalonia (ComC) | 1,068 | 1.86 | n/a | 0 | n/a | |
| Revolutionary Communist League (LCR) | 163 | 0.28 | n/a | 0 | n/a | |
| Blank ballots | 119 | 0.21 | n/a | |||
| Total | 57,532 | 27 | n/a | |||
| Valid votes | 57,532 | 99.68 | n/a | |||
| Invalid votes | 187 | 0.32 | n/a | |||
| Votes cast / turnout | 57,719 | 61.89 | n/a | |||
| Abstentions | 35,539 | 38.11 | n/a | |||
| Registered voters | 93,258 | |||||
| Sources[1][2][27][28] | ||||||
Tarragona
- Population: 108,131
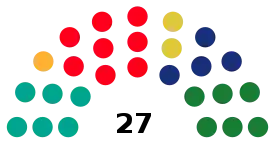 | ||||||
| Parties and coalitions | Popular vote | Seats | ||||
|---|---|---|---|---|---|---|
| Votes | % | ±pp | Total | +/− | ||
| Socialists' Party of Catalonia (PSC–PSOE) | 10,912 | 25.88 | n/a | 8 | n/a | |
| Unified Socialist Party of Catalonia (PSUC) | 9,136 | 21.67 | n/a | 6 | n/a | |
| Centrists of Catalonia (CC–UCD) | 8,545 | 20.26 | n/a | 6 | n/a | |
| Convergence and Union (CiU) | 6,021 | 14.28 | n/a | 4 | n/a | |
| Candidacy for the Neighbors' Participation in the City Council (CPV) | 2,832 | 6.72 | n/a | 2 | n/a | |
| Republican Left of Catalonia–National Front of Catalonia (ERC–FNC) | 2,138 | 5.07 | n/a | 1 | n/a | |
| Democratic Coalition (CD) | 1,098 | 2.60 | n/a | 0 | n/a | |
| Workers' Revolutionary Organization (ORT) | 689 | 1.63 | n/a | 0 | n/a | |
| Communist Movement–Organization of Communist Left (MC–OEC) | 508 | 1.20 | n/a | 0 | n/a | |
| Workers' Party of Catalonia–Communist Unity (PTC–UC) | 158 | 0.37 | n/a | 0 | n/a | |
| Blank ballots | 131 | 0.31 | n/a | |||
| Total | 42,168 | 27 | n/a | |||
| Valid votes | 42,168 | 99.38 | n/a | |||
| Invalid votes | 264 | 0.62 | n/a | |||
| Votes cast / turnout | 42,432 | 56.68 | n/a | |||
| Abstentions | 32,429 | 43.32 | n/a | |||
| Registered voters | 74,861 | |||||
| Sources[1][2][29][30] | ||||||
Tarrasa
- Population: 157,442
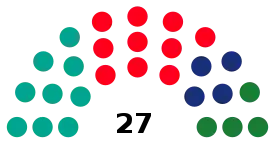 | ||||||
| Parties and coalitions | Popular vote | Seats | ||||
|---|---|---|---|---|---|---|
| Votes | % | ±pp | Total | +/− | ||
| Socialists' Party of Catalonia (PSC–PSOE) | 22,244 | 30.67 | n/a | 10 | n/a | |
| Unified Socialist Party of Catalonia (PSUC) | 22,066 | 30.43 | n/a | 9 | n/a | |
| Convergence and Union (CiU) | 10,877 | 15.00 | n/a | 4 | n/a | |
| Centrists of Catalonia (CC–UCD) | 10,365 | 14.29 | n/a | 4 | n/a | |
| Democratic Coalition (CD) | 2,266 | 3.12 | n/a | 0 | n/a | |
| Republican Left of Catalonia–National Front of Catalonia (ERC–FNC) | 1,860 | 2.56 | n/a | 0 | n/a | |
| Revolutionary Communist League (LCR) | 1,105 | 1.52 | n/a | 0 | n/a | |
| Communist Unity Group of Terrassa (AUCT) | 1,031 | 1.42 | n/a | 0 | n/a | |
| Workers' Revolutionary Organization (ORT) | 504 | 0.70 | n/a | 0 | n/a | |
| Workers' Party of Catalonia–Communist Unity (PTC–UC) | 0 | 0.00 | n/a | 0 | n/a | |
| Blank ballots | 199 | 0.27 | n/a | |||
| Total | 72,517 | 27 | n/a | |||
| Valid votes | 72,517 | 99.69 | n/a | |||
| Invalid votes | 222 | 0.31 | n/a | |||
| Votes cast / turnout | 72,739 | 63.79 | n/a | |||
| Abstentions | 41,298 | 36.21 | n/a | |||
| Registered voters | 114,037 | |||||
| Sources[1][2][31][32] | ||||||
References
- "Eleccions municipals a Catalunya (1979 - 2019). Capitals de comarca i ciutats de més de 25.000 habitants". Historia Electoral.com (in Catalan). Retrieved 11 August 2018.
- "Catalunya : Eleccions Municipals (1979 - 2019)". Historia Electoral.com (in Catalan). Retrieved 24 December 2018.
- "Elecciones Municipales. 3 de abril de 1979. Catalunya". eldiario.es (in Spanish). Retrieved 7 June 2019.
- "Election Results. Municipal Elections 1979. Catalonia". Government of Catalonia (in Catalan). Retrieved 22 December 2018.
- "Electoral Results Consultation. Municipal. April 1979. Catalonia". Ministry of the Interior (in Spanish). Retrieved 22 December 2018.
- "Election Results. Municipal Elections 1979. Badalona". Government of Catalonia (in Catalan). Retrieved 12 November 2017.
- "Electoral Results Consultation. Municipal. April 1979. Badalona Municipality". Ministry of the Interior (in Spanish). Retrieved 12 November 2017.
- "Election Results. Municipal Elections 1979. Barcelona". Government of Catalonia (in Catalan). Retrieved 12 November 2017.
- "Electoral Results Consultation. Municipal. April 1979. Barcelona Municipality". Ministry of the Interior (in Spanish). Retrieved 12 November 2017.
- "Eleccions municipals a Barcelona (1979 - 2015)". Historia Electoral.com (in Catalan). Retrieved 30 September 2017.
- "Election Results. Municipal Elections 1979. Cornellá". Government of Catalonia (in Catalan). Retrieved 1 January 2019.
- "Electoral Results Consultation. Municipal. April 1979. Cornellá Municipality". Ministry of the Interior (in Spanish). Retrieved 1 January 2019.
- "Election Results. Municipal Elections 1979. Gerona". Government of Catalonia (in Catalan). Retrieved 12 November 2017.
- "Electoral Results Consultation. Municipal. April 1979. Gerona Municipality". Ministry of the Interior (in Spanish). Retrieved 12 November 2017.
- "Election Results. Municipal Elections 1979. Hospitalet". Government of Catalonia (in Catalan). Retrieved 12 November 2017.
- "Electoral Results Consultation. Municipal. April 1979. Hospitalet Municipality". Ministry of the Interior (in Spanish). Retrieved 12 November 2017.
- "Election Results. Municipal Elections 1979. Lérida". Government of Catalonia (in Catalan). Retrieved 12 November 2017.
- "Electoral Results Consultation. Municipal. April 1979. Lérida Municipality". Ministry of the Interior (in Spanish). Retrieved 12 November 2017.
- "Election Results. Municipal Elections 1979. Mataró". Government of Catalonia (in Catalan). Retrieved 27 December 2018.
- "Electoral Results Consultation. Municipal. April 1979. Mataró Municipality". Ministry of the Interior (in Spanish). Retrieved 27 December 2018.
- "Election Results. Municipal Elections 1979. Reus". Government of Catalonia (in Catalan). Retrieved 27 December 2018.
- "Electoral Results Consultation. Municipal. April 1979. Reus Municipality". Ministry of the Interior (in Spanish). Retrieved 27 December 2018.
- "Election Results. Municipal Elections 1979. Sabadell". Government of Catalonia (in Catalan). Retrieved 12 November 2017.
- "Electoral Results Consultation. Municipal. April 1979. Sabadell Municipality". Ministry of the Interior (in Spanish). Retrieved 12 November 2017.
- "Election Results. Municipal Elections 1979. Sant Cugat del Vallès". Government of Catalonia (in Catalan). Retrieved 1 January 2019.
- "Electoral Results Consultation. Municipal. April 1979. Sant Cugat del Vallès Municipality". Ministry of the Interior (in Spanish). Retrieved 1 January 2019.
- "Election Results. Municipal Elections 1979. Santa Coloma de Gramanet". Government of Catalonia (in Catalan). Retrieved 27 December 2018.
- "Electoral Results Consultation. Municipal. April 1979. Santa Coloma de Gramanet Municipality". Ministry of the Interior (in Spanish). Retrieved 27 December 2018.
- "Election Results. Municipal Elections 1979. Tarragona". Government of Catalonia (in Catalan). Retrieved 12 November 2017.
- "Electoral Results Consultation. Municipal. April 1979. Tarragona Municipality". Ministry of the Interior (in Spanish). Retrieved 12 November 2017.
- "Election Results. Municipal Elections 1979. Tarrasa". Government of Catalonia (in Catalan). Retrieved 12 November 2017.
- "Electoral Results Consultation. Municipal. April 1979. Tarrasa Municipality". Ministry of the Interior (in Spanish). Retrieved 12 November 2017.
This article is issued from Wikipedia. The text is licensed under Creative Commons - Attribution - Sharealike. Additional terms may apply for the media files.