Results breakdown of the 2015 Spanish local elections (Catalonia)
This is the results breakdown of the local elections held in Catalonia on 24 May 2015. The following tables show detailed results in the autonomous community's most populous municipalities, sorted alphabetically.[1][2][3][4]
Opinion polls
Overall
| Parties and coalitions | Popular vote | Councillors | ||||
|---|---|---|---|---|---|---|
| Votes | % | ±pp | Total | +/− | ||
| Convergence and Union (CiU) | 671,766 | 21.56 | –5.64 | 3,361 | –497 | |
| Aranese Democratic Convergence–Aranese Nationalist Party (CDA–PNA) | 1,985 | 0.06 | –0.02 | 25 | –7 | |
| Socialists' Party of Catalonia–Progress Candidacy (PSC–CP) | 531,388 | 17.06 | –8.07 | 1,278 | –849 | |
| Republican Left of Catalonia–Municipal Agreement (ERC–AM) | 511,227 | 16.41 | +7.38 | 2,398 | +975 | |
| Forward Cerdanya (En–Cerd) | 1,147 | 0.04 | –0.02 | 18 | –5 | |
| Agreement (Entesa) | 372,858 | 11.97 | +3.54 | 370 | –32 | |
| Popular Unity Candidacy–Active People (CUP–PA) | 237,643 | 7.63 | +4.98 | 382 | +265 | |
| People's Party (PP) | 235,157 | 7.55 | –5.13 | 215 | –259 | |
| Citizens–Party of the Citizenry (C's) | 231,379 | 7.43 | +6.21 | 175 | +168 | |
| We Can-supported candidacies (Podemos/Podem) | 40,699 | 1.31 | New | 48 | +48 | |
| Municipal Democracy (DM) | 2,291 | 0.07 | New | 1 | +1 | |
| Platform for Catalonia (PxC) | 27,281 | 0.88 | –1.42 | 9 | –58 | |
| Let's Win (Ganemos) | 22,664 | 0.73 | New | 16 | +16 | |
| Animalist Party Against Mistreatment of Animals (PACMA) | 9,189 | 0.29 | +0.07 | 0 | ±0 | |
| Catalan Solidarity for Independence (SI) | 8,102 | 0.26 | –0.85 | 17 | –30 | |
| Catalan Solidarity for Independence (SI) | 3,273 | 0.11 | –1.00 | 10 | –37 | |
| Left Movement (MES) | 7,587 | 0.24 | New | 32 | +32 | |
| Advance–Left Movement (Avancem–MES) | 1,011 | 0.03 | New | 3 | +3 | |
| Federation of Independents of Catalonia (FIC) | 7,301 | 0.23 | –0.21 | 66 | –20 | |
| Independents of La Selva (IdSelva) | 6,943 | 0.22 | New | 43 | +43 | |
| The Greens–The Ecologist Alternative (EV–AE) | 5,684 | 0.18 | New | 0 | ±0 | |
| Now–Catalonia Now (A–AraCatalunya) | 5,061 | 0.16 | +0.09 | 4 | +2 | |
| Common of Lleida (Comú de Lleida) | 3,787 | 0.12 | New | 2 | +2 | |
| Union, Progress and Democracy (UPyD) | 3,319 | 0.11 | +0.03 | 0 | ±0 | |
| Blank Seats (EB) | 3,002 | 0.10 | –0.45 | 1 | –3 | |
| Vox (Vox) | 2,469 | 0.08 | New | 0 | ±0 | |
| Family and Life Party (PFiV) | 411 | 0.01 | –0.02 | 0 | ±0 | |
| Others | 118,276 | 3.80 | — | 660 | +142 | |
| Blank ballots | 52,801 | 1.69 | –2.50 | |||
| Total | 3,115,583 | 100.00 | 9,077 | –55 | ||
| Valid votes | 3,115,583 | 99.04 | +0.72 | |||
| Invalid votes | 30,206 | 0.96 | –0.72 | |||
| Votes cast / turnout | 3,145,789 | 58.51 | +3.50 | |||
| Abstentions | 2,230,764 | 41.49 | –3.50 | |||
| Registered voters | 5,376,553 | |||||
| Sources[1][2][5][6] | ||||||
City control
The following table lists party control in the most populous municipalities, including provincial capitals (shown in bold).[1][2] Gains for a party are displayed with the cell's background shaded in that party's colour.
Municipalities
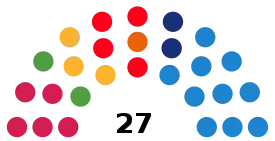
Badalona
- Population: 217,210
 | ||||||
| Parties and coalitions | Popular vote | Seats | ||||
|---|---|---|---|---|---|---|
| Votes | % | ±pp | Total | +/− | ||
| People's Party (PP) | 30,567 | 34.21 | +0.73 | 10 | –1 | |
| Let's Win Badalona–Badalona in Common–Active People (GBC–PA)1 | 15,645 | 17.51 | +15.69 | 5 | +5 | |
| Socialists' Party of Catalonia–Progress Candidacy (PSC–CP) | 12,593 | 14.09 | –12.96 | 4 | –5 | |
| ERC–Advance–Left Movement–Municipal Agreement (ERC–A–MES–AM) | 9,812 | 10.98 | +7.28 | 3 | +3 | |
| Convergence and Union (CiU) | 7,097 | 7.94 | –4.61 | 2 | –2 | |
| Initiative Greens–EUiA–It is Possible–Agreement (ICV–EUiA–EP–E) | 5,971 | 6.68 | –2.22 | 2 | –1 | |
| Citizens–Party of the Citizenry (C's) | 5,002 | 5.60 | +4.43 | 1 | +1 | |
| We Make Badalona, Municipal Party for Badalona (Fem B, PMB) | 460 | 0.51 | New | 0 | ±0 | |
| Citizens' Democratic Renewal Movement (RED) | 403 | 0.45 | New | 0 | ±0 | |
| Independent Space Place (LLEI) | 328 | 0.37 | +0.05 | 0 | ±0 | |
| Union, Progress and Democracy (UPyD) | 277 | 0.31 | New | 0 | ±0 | |
| Blank ballots | 1,198 | 1.34 | –2.44 | |||
| Total | 89,353 | 27 | ±0 | |||
| Valid votes | 89,353 | 99.44 | +0.55 | |||
| Invalid votes | 499 | 0.56 | –0.55 | |||
| Votes cast / turnout | 89,852 | 57.53 | +5.42 | |||
| Abstentions | 66,337 | 42.47 | –5.42 | |||
| Registered voters | 156,189 | |||||
| Sources[1][2][9][10][11] | ||||||
Barcelona
- Population: 1,602,386
 | ||||||
| Parties and coalitions | Popular vote | Seats | ||||
|---|---|---|---|---|---|---|
| Votes | % | ±pp | Total | +/− | ||
| Barcelona in Common (Let's Win Barcelona)–Agreement (BComú–E)1 | 176,612 | 25.21 | +14.82 | 11 | +6 | |
| Convergence and Union (CiU) | 159,393 | 22.75 | –5.98 | 10 | –4 | |
| Citizens–Party of the Citizenry (C's) | 77,272 | 11.03 | +9.09 | 5 | +5 | |
| ERC–MES–Barcelona Open City–Advance–AM (ERC–MES–BcnCO–A–AM) | 77,120 | 11.01 | +5.42 | 5 | +3 | |
| Socialists' Party of Catalonia–Progress Candidacy (PSC–CP) | 67,489 | 9.63 | –12.51 | 4 | –7 | |
| People's Party (PP) | 61,004 | 8.71 | –8.53 | 3 | –6 | |
| Popular Unity Candidacy–Let's Reverse Barcelona (CUP–Capgirem–PA) | 51,945 | 7.42 | +5.47 | 3 | +3 | |
| Animalist Party Against Mistreatment of Animals (PACMA) | 5,720 | 0.82 | +0.11 | 0 | ±0 | |
| The Greens–The Ecologist Alternative (EV–AE) | 5,684 | 0.81 | New | 0 | ±0 | |
| Better Barcelona (RI.cat–SI)2 | 2,626 | 0.37 | –0.76 | 0 | ±0 | |
| Blank Seats (EB) | 1,957 | 0.28 | –1.39 | 0 | ±0 | |
| Platform for Catalonia (PxC) | 1,617 | 0.23 | –0.34 | 0 | ±0 | |
| Vox–Family and Life Party (Vox–PFiV)3 | 1,520 | 0.22 | +0.13 | 0 | ±0 | |
| United Free Citizens (CILUS) | 989 | 0.14 | New | 0 | ±0 | |
| Union, Progress and Democracy (UPyD) | 811 | 0.12 | –0.12 | 0 | ±0 | |
| Communist Party of the Catalan People (PCPC) | 656 | 0.09 | –0.07 | 0 | ±0 | |
| Spanish Phalanx of the CNSO (FE–JONS) | 455 | 0.07 | +0.01 | 0 | ±0 | |
| Humanist Party (PH) | 439 | 0.06 | –0.04 | 0 | ±0 | |
| United for Declaring Catalan Independence (UPDIC) | 286 | 0.04 | New | 0 | ±0 | |
| Libertarian Party (P–LIB) | 273 | 0.04 | New | 0 | ±0 | |
| Internationalist Solidarity and Self-Management (SAIn) | 166 | 0.02 | –0.02 | 0 | ±0 | |
| The National Coalition (LCN) | 99 | 0.01 | New | 0 | ±0 | |
| Blank ballots | 6,363 | 0.91 | –3.56 | |||
| Total | 700,496 | 41 | ±0 | |||
| Valid votes | 700,496 | 99.56 | +1.26 | |||
| Invalid votes | 3,094 | 0.44 | –1.26 | |||
| Votes cast / turnout | 703,590 | 60.59 | +7.60 | |||
| Abstentions | 457,550 | 39.41 | –7.60 | |||
| Registered voters | 1,161,140 | |||||
| Sources[1][2][9][12][13][14] | ||||||
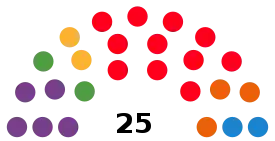
Cornellà de Llobregat
- Population: 86,234
 | ||||||
| Parties and coalitions | Popular vote | Seats | ||||
|---|---|---|---|---|---|---|
| Votes | % | ±pp | Total | +/− | ||
| Socialists' Party of Catalonia–Progress Candidacy (PSC–CP) | 13,416 | 38.56 | –3.52 | 11 | –3 | |
| Cornellà in Common–Call for Cornellà (CEC–CPC) | 6,061 | 17.42 | New | 5 | +5 | |
| Citizens–Party of the Citizenry (C's) | 3,926 | 11.28 | +8.67 | 3 | +3 | |
| Republican Left of Catalonia–Municipal Agreement (ERC–AM) | 3,208 | 9.22 | +4.73 | 2 | +2 | |
| Initiative for Catalonia Greens–EUiA–Progress Agreement (ICV–EUiA–EP) | 2,831 | 8.14 | –3.74 | 2 | –2 | |
| People's Party (PP) | 2,717 | 7.81 | –8.14 | 2 | –3 | |
| Convergence and Union (CiU) | 1,454 | 4.18 | –4.70 | 0 | –2 | |
| Platform for Catalonia (PxC) | 630 | 1.81 | –3.14 | 0 | ±0 | |
| Union, Progress and Democracy (UPyD) | 176 | 0.51 | New | 0 | ±0 | |
| Blank ballots | 373 | 1.07 | –3.57 | |||
| Total | 34,792 | 25 | ±0 | |||
| Valid votes | 34,792 | 99.44 | +1.04 | |||
| Invalid votes | 195 | 0.56 | –1.04 | |||
| Votes cast / turnout | 34,987 | 56.44 | +5.97 | |||
| Abstentions | 26,998 | 43.56 | –5.97 | |||
| Registered voters | 61,985 | |||||
| Sources[1][2][9][15][16] | ||||||
Girona
- Population: 97,227
 | ||||||
| Parties and coalitions | Popular vote | Seats | ||||
|---|---|---|---|---|---|---|
| Votes | % | ±pp | Total | +/− | ||
| Convergence and Union (CiU) | 11,833 | 32.59 | +1.08 | 10 | ±0 | |
| Republican Left–Left Movement–Municipal Agreement (ERC–MES–AM) | 5,513 | 15.18 | +10.19 | 4 | +4 | |
| Popular Unity Candidacy–Call for Girona–Active People (CUP–Crida–PA) | 5,425 | 14.94 | +5.66 | 4 | +1 | |
| Socialists' Party of Catalonia–Progress Candidacy (PSC–CP) | 5,265 | 14.50 | –8.86 | 4 | –3 | |
| Citizens–Party of the Citizenry (C's) | 2,740 | 7.55 | +6.30 | 2 | +2 | |
| People's Party (PP) | 2,163 | 5.96 | –5.71 | 1 | –2 | |
| Initiative for Catalonia Greens–EUiA–Agreement (ICV–EUiA–E) | 1,512 | 4.16 | –2.86 | 0 | –2 | |
| Commitment with Girona (CG) | 598 | 1.65 | New | 0 | ±0 | |
| Animalist Party Against Mistreatment of Animals (PACMA) | 399 | 1.10 | +0.42 | 0 | ±0 | |
| Catalan Solidarity for Independence (SI) | 182 | 0.50 | –1.95 | 0 | ±0 | |
| Blank Seats (EB) | 156 | 0.43 | –0.87 | 0 | ±0 | |
| Union, Progress and Democracy (UPyD) | 86 | 0.24 | +0.06 | 0 | ±0 | |
| Blank ballots | 434 | 1.20 | –3.21 | |||
| Total | 36,306 | 25 | ±0 | |||
| Valid votes | 36,306 | 99.34 | +1.13 | |||
| Invalid votes | 242 | 0.66 | –1.13 | |||
| Votes cast / turnout | 36,548 | 56.02 | +4.32 | |||
| Abstentions | 28,694 | 43.98 | –4.32 | |||
| Registered voters | 65,242 | |||||
| Sources[1][2][17][18][19] | ||||||
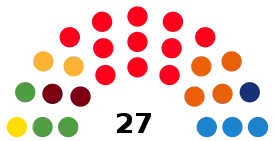
L'Hospitalet de Llobregat
- Population: 253,518
 | ||||||
| Parties and coalitions | Popular vote | Seats | ||||
|---|---|---|---|---|---|---|
| Votes | % | ±pp | Total | +/− | ||
| Socialists' Party of Catalonia–Progress Candidacy (PSC–CP) | 30,942 | 33.24 | –5.61 | 11 | –2 | |
| Citizens–Party of the Citizenry (C's) | 12,324 | 13.24 | +11.11 | 4 | +4 | |
| Initiative for Catalonia Greens–EUiA–Pirates–Agreement (ICV–EUiA–P–E)1 | 9,516 | 10.22 | +0.32 | 3 | +1 | |
| People's Party (PP) | 9,238 | 9.92 | –8.65 | 3 | –3 | |
| Republican Left of Catalonia–Municipal Agreement (ERC–AM) | 8,348 | 8.97 | +6.30 | 2 | +2 | |
| Let's Win L'Hospitalet (Ganemos) | 6,949 | 7.46 | New | 2 | +2 | |
| Convergence and Union (CiU) | 5,579 | 5.99 | –6.31 | 1 | –3 | |
| Popular Unity Candidacy–Active People (CUP–PA) | 4,755 | 5.11 | +4.47 | 1 | +1 | |
| Platform for Catalonia (PxC) | 3,653 | 3.92 | –3.40 | 0 | –2 | |
| Union, Progress and Democracy (UPyD) | 502 | 0.54 | New | 0 | ±0 | |
| Blank ballots | 1,286 | 1.38 | –2.65 | |||
| Total | 93,092 | 27 | ±0 | |||
| Valid votes | 93,092 | 99.35 | +0.81 | |||
| Invalid votes | 607 | 0.65 | –0.81 | |||
| Votes cast / turnout | 93,699 | 53.36 | +3.12 | |||
| Abstentions | 81,909 | 46.64 | –3.12 | |||
| Registered voters | 175,608 | |||||
| Sources[1][2][9][20][21] | ||||||
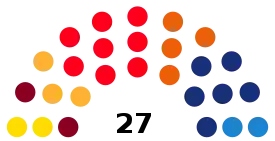
Lleida
- Population: 139,176
 | ||||||
| Parties and coalitions | Popular vote | Seats | ||||
|---|---|---|---|---|---|---|
| Votes | % | ±pp | Total | +/− | ||
| Socialists' Party of Catalonia–Progress Candidacy (PSC–CP) | 12,367 | 24.67 | –17.39 | 8 | –7 | |
| Convergence and Union (CiU) | 8,983 | 17.92 | –0.39 | 6 | ±0 | |
| Citizens–Party of the Citizenry (C's) | 5,965 | 11.90 | +10.93 | 4 | +4 | |
| Republican Left–Advance–Municipal Agreement (ERC–Avancem–AM) | 5,656 | 11.28 | +7.07 | 3 | +3 | |
| Call for Lleida–Popular Unity Candidacy (Crida–CUP) | 4,387 | 8.75 | +5.49 | 2 | +2 | |
| People's Party (PP) | 4,358 | 8.69 | –7.83 | 2 | –4 | |
| Common of Lleida (Comú de Lleida) | 3,787 | 7.55 | New | 2 | +2 | |
| Agreement for Lleida–ICV–EUiA–ME–Agreement (ICV–EUiA–ME) | 2,419 | 4.83 | +0.19 | 0 | ±0 | |
| Animalist Party Against Mistreatment of Animals (PACMA) | 674 | 1.34 | +0.86 | 0 | ±0 | |
| Blank Seats (EB) | 287 | 0.57 | –0.29 | 0 | ±0 | |
| Communist Party of the Catalan People (PCPC) | 176 | 0.35 | New | 0 | ±0 | |
| Union, Progress and Democracy (UPyD) | 142 | 0.28 | +0.10 | 0 | ±0 | |
| Blank ballots | 928 | 1.85 | –2.48 | |||
| Total | 50,129 | 27 | ±0 | |||
| Valid votes | 50,129 | 99.10 | +0.68 | |||
| Invalid votes | 457 | 0.90 | –0.68 | |||
| Votes cast / turnout | 50,586 | 54.51 | +4.70 | |||
| Abstentions | 42,212 | 45.49 | –4.70 | |||
| Registered voters | 92,798 | |||||
| Sources[1][2][22][23][24] | ||||||
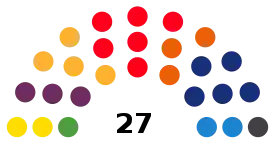
Mataró
- Population: 124,280
 | ||||||
| Parties and coalitions | Popular vote | Seats | ||||
|---|---|---|---|---|---|---|
| Votes | % | ±pp | Total | +/− | ||
| Socialists' Party of Catalonia–Progress Candidacy (PSC–CP) | 8,420 | 18.46 | –3.85 | 6 | –2 | |
| Convergence and Union (CiU) | 7,374 | 16.17 | –8.59 | 5 | –3 | |
| Republican Left–Left Movement–Municipal Agreement (ERC–MES–AM) | 6,648 | 14.58 | +10.64 | 4 | +4 | |
| We Want Mataró (VoleMataró) | 5,276 | 11.57 | New | 3 | +3 | |
| Citizens–Party of the Citizenry (C's) | 4,409 | 9.67 | New | 3 | +3 | |
| People's Party (PP) | 3,862 | 8.47 | –6.86 | 2 | –3 | |
| Popular Unity Candidacy–Active People (CUP–PA) | 3,843 | 8.43 | +2.87 | 2 | +1 | |
| Platform for Catalonia (PxC) | 2,572 | 5.64 | –4.79 | 1 | –2 | |
| Initiative for Catalonia Greens–EUiA–Agreement (ICV–EUiA–E) | 2,561 | 5.62 | –1.13 | 1 | –1 | |
| Blank ballots | 639 | 1.40 | –3.37 | |||
| Total | 45,604 | 27 | ±0 | |||
| Valid votes | 45,604 | 97.80 | –1.22 | |||
| Invalid votes | 1,025 | 2.20 | +1.22 | |||
| Votes cast / turnout | 46,629 | 53.82 | +0.61 | |||
| Abstentions | 40,017 | 46.18 | –0.61 | |||
| Registered voters | 86,646 | |||||
| Sources[1][2][9][25][26] | ||||||
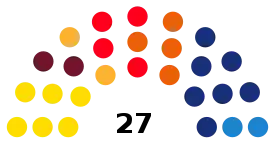
Reus
- Population: 104,962
 | ||||||
| Parties and coalitions | Popular vote | Seats | ||||
|---|---|---|---|---|---|---|
| Votes | % | ±pp | Total | +/− | ||
| Convergence and Union (CiU) | 8,307 | 21.42 | –6.37 | 7 | –3 | |
| Popular Unity Candidacy–Active People (CUP–PA) | 6,884 | 17.75 | +12.63 | 6 | +5 | |
| Citizens–Party of the Citizenry (C's) | 5,573 | 14.37 | +12.84 | 4 | +4 | |
| Socialists' Party of Catalonia–Progress Candidacy (PSC–CP) | 5,334 | 13.75 | –7.60 | 4 | –4 | |
| National Left Reus–Municipal Agreement (ERC–MES–MDC–A–AM) | 3,367 | 8.68 | +4.52 | 2 | +2 | |
| People's Party (PP) | 3,151 | 8.12 | –8.27 | 2 | –4 | |
| Reus Now (A) | 2,443 | 6.30 | +1.05 | 2 | ±0 | |
| Reus Anew (DNR) | 987 | 2.54 | New | 0 | ±0 | |
| Moving Reus–Open Assembly–Agreement (MR–AO–E)1 | 960 | 2.48 | –1.59 | 0 | ±0 | |
| Unitary List (Llista Unitària) | 647 | 1.67 | New | 0 | ±0 | |
| Platform for Catalonia (PxC) | 524 | 1.35 | –3.50 | 0 | ±0 | |
| Blank ballots | 609 | 1.57 | –1.51 | |||
| Total | 38,786 | 27 | ±0 | |||
| Valid votes | 38,786 | 99.05 | +0.16 | |||
| Invalid votes | 371 | 0.95 | –0.16 | |||
| Votes cast / turnout | 39,157 | 55.33 | +1.43 | |||
| Abstentions | 31,610 | 44.67 | –1.43 | |||
| Registered voters | 70,767 | |||||
| Sources[1][2][27][28][29] | ||||||
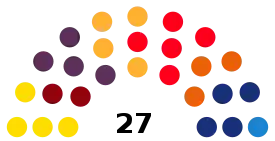
Sabadell
- Population: 207,444
 | ||||||
| Parties and coalitions | Popular vote | Seats | ||||
|---|---|---|---|---|---|---|
| Votes | % | ±pp | Total | +/− | ||
| Socialists' Party of Catalonia–Progress Candidacy (PSC–CP) | 12,950 | 15.41 | –22.91 | 5 | –8 | |
| Unity for Change Sabadell–Agreement (UPCS–E)1 | 12,611 | 15.01 | +3.53 | 4 | ±0 | |
| Republican Left of Catalonia–Municipal Agreement (ERC–AM) | 12,426 | 14.79 | +11.61 | 4 | +4 | |
| Call for Sabadell–Alternative Candidacies–Active People (CpSBD–CAV–PA)2 | 11,110 | 13.22 | +2.99 | 4 | +2 | |
| Convergence and Union (CiU) | 11,092 | 13.20 | –3.72 | 4 | –1 | |
| Citizens–Party of the Citizenry (C's) | 10,106 | 12.03 | +10.33 | 3 | +3 | |
| Let's Win Sabadell (Ganemos) | 5,398 | 6.42 | New | 2 | +2 | |
| People's Party (PP) | 4,821 | 5.74 | –4.53 | 1 | –2 | |
| Animalist Party Against Mistreatment of Animals (PACMA) | 1,712 | 2.04 | +0.62 | 0 | ±0 | |
| Socialist Party of Labour (Internationalist) (PST (I)) | 272 | 0.32 | New | 0 | ±0 | |
| Union, Progress and Democracy (UPyD) | 265 | 0.32 | New | 0 | ±0 | |
| Blank ballots | 1,270 | 1.51 | –2.55 | |||
| Total | 84,033 | 27 | ±0 | |||
| Valid votes | 84,033 | 99.28 | +0.47 | |||
| Invalid votes | 608 | 0.72 | –0.47 | |||
| Votes cast / turnout | 84,641 | 55.15 | +4.93 | |||
| Abstentions | 68,843 | 44.85 | –4.93 | |||
| Registered voters | 153,484 | |||||
| Sources[1][2][9][30][31] | ||||||
Sant Cugat del Vallès
- Population: 87,118
 | ||||||
| Parties and coalitions | Popular vote | Seats | ||||
|---|---|---|---|---|---|---|
| Votes | % | ±pp | Total | +/− | ||
| Convergence and Union (CiU) | 13,524 | 36.98 | –9.13 | 11 | –4 | |
| Popular Unity Candidacy–CAV–Active People (CUP–CAV–PA) | 5,561 | 15.21 | +7.46 | 4 | +2 | |
| Citizens–Party of the Citizenry (C's) | 4,727 | 12.93 | +10.68 | 3 | +3 | |
| Republican Left–Left Movement–Municipal Agreement (ERC–MES–AM) | 4,100 | 11.21 | +6.34 | 3 | +3 | |
| Initiative for Catalonia Greens–EUiA–Agreement (ICV–EUiA–E) | 2,419 | 6.61 | –1.90 | 2 | ±0 | |
| Socialists' Party of Catalonia–Progress Candidacy (PSC–CP) | 2,366 | 6.47 | –2.69 | 1 | –1 | |
| People's Party (PP) | 2,284 | 6.25 | –6.29 | 1 | –3 | |
| Vox–Family and Life Party (Vox–PFiV)1 | 482 | 1.32 | +0.79 | 0 | ±0 | |
| Another Sant Cugat–Citizen Platform for Sant Cugat (UASC) | 479 | 1.97 | –0.66 | 0 | ±0 | |
| Catalan Solidarity for Independence (SI) | 119 | 0.33 | –1.20 | 0 | ±0 | |
| Blank ballots | 508 | 1.39 | –3.38 | |||
| Total | 36,569 | 25 | ±0 | |||
| Valid votes | 36,569 | 99.56 | +1.09 | |||
| Invalid votes | 161 | 0.44 | –1.09 | |||
| Votes cast / turnout | 36,730 | 61.13 | +5.64 | |||
| Abstentions | 23,352 | 38.87 | –5.64 | |||
| Registered voters | 60,082 | |||||
| Sources[1][2][9][32][33] | ||||||
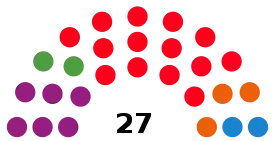
Santa Coloma de Gramenet
- Population: 118,738
 | ||||||
| Parties and coalitions | Popular vote | Seats | ||||
|---|---|---|---|---|---|---|
| Votes | % | ±pp | Total | +/− | ||
| Socialists' Party of Catalonia–Progress Candidacy (PSC–CP) | 17,247 | 40.65 | +1.48 | 14 | +2 | |
| We Are Gramenet–Active People (SG–PA)1 | 7,872 | 18.56 | +11.92 | 6 | +4 | |
| Citizens–Party of the Citizenry (C's) | 4,876 | 11.49 | +9.50 | 3 | +3 | |
| Left People–Initiative for Catalonia Greens–EUiA (GE–ICV–EUiA) | 3,331 | 7.85 | –4.09 | 2 | –1 | |
| People's Party (PP) | 3,293 | 7.76 | –9.43 | 2 | –3 | |
| Republican Left–Gramenet Yes–Municipal Agreement (ERC–Gramenet–AM) | 2,030 | 4.78 | +3.23 | 0 | ±0 | |
| Convergence and Union (CiU) | 1,536 | 3.62 | –2.96 | 0 | –2 | |
| Platform for Catalonia&Neighbors of Santa Coloma (PxC&Vecinos) | 1,445 | 3.41 | –5.67 | 0 | –3 | |
| Communist Party of the Catalan People (PCPC) | 182 | 0.43 | –0.45 | 0 | ±0 | |
| Union, Progress and Democracy (UPyD) | 151 | 0.36 | New | 0 | ±0 | |
| Blank ballots | 462 | 1.09 | –2.71 | |||
| Total | 42,425 | 27 | ±0 | |||
| Valid votes | 42,425 | 99.47 | +0.73 | |||
| Invalid votes | 224 | 0.53 | –0.73 | |||
| Votes cast / turnout | 42,649 | 54.03 | +4.35 | |||
| Abstentions | 36,293 | 45.97 | –4.35 | |||
| Registered voters | 78,942 | |||||
| Sources[1][2][9][34][35] | ||||||
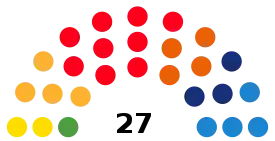
Tarragona
- Population: 132,199
 | ||||||
| Parties and coalitions | Popular vote | Seats | ||||
|---|---|---|---|---|---|---|
| Votes | % | ±pp | Total | +/− | ||
| Socialists' Party of Catalonia–Progress Candidacy (PSC–CP) | 14,486 | 28.49 | –8.45 | 9 | –3 | |
| Citizens–Party of the Citizenry (C's) | 7,257 | 14.27 | +12.56 | 4 | +4 | |
| Republican Left–MES–Catalan Democratic–AM (ERC–MES–MDC–AM) | 5,963 | 11.73 | +7.76 | 4 | +4 | |
| People's Party (PP) | 5,823 | 11.45 | –9.10 | 4 | –3 | |
| Convergence and Union (CiU) | 5,555 | 10.92 | –9.63 | 3 | –4 | |
| Popular Unity Candidacy–Active People (CUP–PA) | 4,182 | 8.22 | +5.94 | 2 | +2 | |
| Initiative for Catalonia Greens–EUiA–Agreement (ICV–EUiA–E) | 2,869 | 5.64 | +0.25 | 1 | ±0 | |
| Catalonia Now (AraCatalunya) | 1,862 | 3.66 | New | 0 | ±0 | |
| Let's Win Tarragona (Ganemos) | 1,157 | 2.28 | New | 0 | ±0 | |
| Animalist Party Against Mistreatment of Animals (PACMA) | 684 | 1.35 | +0.74 | 0 | ±0 | |
| Blank Seats (EB) | 257 | 0.51 | –0.57 | 0 | ±0 | |
| Union, Progress and Democracy (UPyD) | 131 | 0.26 | +0.02 | 0 | ±0 | |
| Engine and Sports Alternative (AMD) | 56 | 0.11 | –0.10 | 0 | ±0 | |
| Blank ballots | 568 | 1.12 | –2.39 | |||
| Total | 50,850 | 27 | ±0 | |||
| Valid votes | 50,850 | 99.31 | +0.60 | |||
| Invalid votes | 354 | 0.69 | –0.60 | |||
| Votes cast / turnout | 51,204 | 56.31 | +2.09 | |||
| Abstentions | 39,726 | 43.69 | –2.09 | |||
| Registered voters | 90,930 | |||||
| Sources[1][2][27][36][37] | ||||||
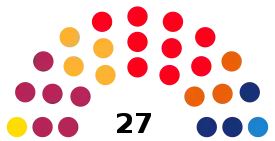
Terrassa
- Population: 215,517
 | ||||||
| Parties and coalitions | Popular vote | Seats | ||||
|---|---|---|---|---|---|---|
| Votes | % | ±pp | Total | +/− | ||
| Socialists' Party of Catalonia–Progress Candidacy (PSC–CP) | 23,543 | 28.21 | –4.11 | 9 | –2 | |
| Terrassa in Common–Agreement (TeC–E)1 | 16,051 | 19.24 | +9.99 | 6 | +3 | |
| Republican Left–Left Movement–Municipal Agreement (ERC–MES–AM) | 11,255 | 13.49 | +9.05 | 4 | +4 | |
| Convergence and Union (CiU) | 10,132 | 12.14 | –12.31 | 3 | –6 | |
| Citizens–Party of the Citizenry (C's) | 9,008 | 10.80 | +8.69 | 3 | +3 | |
| Popular Unity Candidacy–CAV–Active People (CUP–CAV–PA) | 4,804 | 5.76 | +4.54 | 1 | +1 | |
| People's Party (PP) | 4,719 | 5.66 | –6.59 | 1 | –3 | |
| Platform for Catalonia (PxC) | 1,656 | 1.98 | –0.97 | 0 | ±0 | |
| Centre Union for Terrassa (UCTerrassa) | 583 | 0.70 | +0.16 | 0 | ±0 | |
| Family and Life Party (PFiV) | 411 | 0.49 | +0.22 | 0 | ±0 | |
| Union, Progress and Democracy (UPyD) | 207 | 0.25 | New | 0 | ±0 | |
| Blank ballots | 1,077 | 1.29 | –3.31 | |||
| Total | 83,446 | 27 | ±0 | |||
| Valid votes | 83,446 | 99.59 | +0.99 | |||
| Invalid votes | 345 | 0.41 | –0.99 | |||
| Votes cast / turnout | 83,791 | 54.65 | +6.15 | |||
| Abstentions | 69,540 | 45.35 | –6.15 | |||
| Registered voters | 153,331 | |||||
| Sources[1][2][9][38][39] | ||||||
References
- "Eleccions municipals a Catalunya (1979 - 2019). Capitals de comarca i ciutats de més de 25.000 habitants". Historia Electoral.com (in Catalan). Retrieved 11 August 2018.
- "Catalunya : Eleccions Municipals (1979 - 2019)". Historia Electoral.com (in Catalan). Retrieved 24 December 2018.
- "Elecciones Municipales. 24 de mayo de 2015. Catalunya". eldiario.es (in Spanish). Retrieved 7 June 2019.
- "24M/Elecciones Municipales 2015. Catalunya". Público (in Spanish). Retrieved 28 October 2018.
- "Election Results. Municipal Elections 2015. Catalonia". Government of Catalonia (in Catalan). Retrieved 22 December 2018.
- "Electoral Results Consultation. Municipal. May 2015. Catalonia". Ministry of the Interior (in Spanish). Retrieved 22 December 2018.
- "Álex Pastor, nuevo alcalde de Badalona tras prosperar la moción de censura". La Vanguardia (in Spanish). 20 June 2018. Retrieved 5 July 2020.
- "Sabadell pasa a manos de la CUP con un alcalde imputado". El País (in Spanish). 26 July 2017. Retrieved 5 July 2020.
- "Local election results, 24 May 2015, in Álava, Asturias, Ávila, Badajoz, Barcelona and Biscay provinces" (PDF). Central Electoral Commission (in Spanish). Retrieved 11 February 2018.
- "Election Results. Municipal Elections 2015. Badalona". Government of Catalonia (in Catalan). Retrieved 12 November 2017.
- "Electoral Results Consultation. Municipal. May 2015. Badalona Municipality". Ministry of the Interior (in Spanish). Retrieved 12 November 2017.
- "Election Results. Municipal Elections 2015. Barcelona". Government of Catalonia (in Catalan). Retrieved 12 November 2017.
- "Electoral Results Consultation. Municipal. May 2015. Barcelona Municipality". Ministry of the Interior (in Spanish). Retrieved 12 November 2017.
- "Eleccions municipals a Barcelona (1979 - 2015)". Historia Electoral.com (in Catalan). Retrieved 30 September 2017.
- "Election Results. Municipal Elections 2015. Cornellà de Llobregat". Government of Catalonia (in Catalan). Retrieved 1 January 2019.
- "Electoral Results Consultation. Municipal. May 2015. Cornellà de Llobregat Municipality". Ministry of the Interior (in Spanish). Retrieved 1 January 2019.
- "Local election results, 24 May 2015, in Gipuzkoa, Girona, Granada, Guadalajara, Huelva, Huesca, Balearic Islands and Jaén provinces" (PDF). Central Electoral Commission (in Spanish). Retrieved 11 February 2018.
- "Election Results. Municipal Elections 2015. Girona". Government of Catalonia (in Catalan). Retrieved 12 November 2017.
- "Electoral Results Consultation. Municipal. May 2015. Girona Municipality". Ministry of the Interior (in Spanish). Retrieved 12 November 2017.
- "Election Results. Municipal Elections 2015. L'Hospitalet de Llobregat". Government of Catalonia (in Catalan). Retrieved 12 November 2017.
- "Electoral Results Consultation. Municipal. May 2015. L'Hospitalet de Llobregat Municipality". Ministry of the Interior (in Spanish). Retrieved 12 November 2017.
- "Local election results, 24 May 2015, in León, Lleida, Lugo, Madrid, Málaga, Murcia, Navarre, Ourense, Palencia, Las Palmas and Pontevedra provinces" (PDF). Central Electoral Commission (in Spanish). Retrieved 11 February 2018.
- "Election Results. Municipal Elections 2015. Lleida". Government of Catalonia (in Catalan). Retrieved 12 November 2017.
- "Electoral Results Consultation. Municipal. May 2015. Lleida Municipality". Ministry of the Interior (in Spanish). Retrieved 12 November 2017.
- "Election Results. Municipal Elections 2015. Mataró". Government of Catalonia (in Catalan). Retrieved 27 December 2018.
- "Electoral Results Consultation. Municipal. May 2015. Mataró Municipality". Ministry of the Interior (in Spanish). Retrieved 27 December 2018.
- "Local election results, 24 May 2015, in La Rioja, Salamanca, Santa Cruz de Tenerife, Segovia, Seville, Soria, Reus, Teruel and Toledo provinces" (PDF). Central Electoral Commission (in Spanish). Retrieved 11 February 2018.
- "Election Results. Municipal Elections 2015. Reus". Government of Catalonia (in Catalan). Retrieved 27 December 2018.
- "Electoral Results Consultation. Municipal. May 2015. Reus Municipality". Ministry of the Interior (in Spanish). Retrieved 27 December 2018.
- "Election Results. Municipal Elections 2015. Sabadell". Government of Catalonia (in Catalan). Retrieved 12 November 2017.
- "Electoral Results Consultation. Municipal. May 2015. Sabadell Municipality". Ministry of the Interior (in Spanish). Retrieved 12 November 2017.
- "Election Results. Municipal Elections 2015. Sant Cugat del Vallès". Government of Catalonia (in Catalan). Retrieved 1 January 2019.
- "Electoral Results Consultation. Municipal. May 2015. Sant Cugat del Vallès Municipality". Ministry of the Interior (in Spanish). Retrieved 1 January 2019.
- "Election Results. Municipal Elections 2015. Santa Coloma de Gramenet". Government of Catalonia (in Catalan). Retrieved 27 December 2018.
- "Electoral Results Consultation. Municipal. May 2015. Santa Coloma de Gramenet Municipality". Ministry of the Interior (in Spanish). Retrieved 27 December 2018.
- "Election Results. Municipal Elections 2015. Tarragona". Government of Catalonia (in Catalan). Retrieved 12 November 2017.
- "Electoral Results Consultation. Municipal. May 2015. Tarragona Municipality". Ministry of the Interior (in Spanish). Retrieved 12 November 2017.
- "Election Results. Municipal Elections 2015. Terrassa". Government of Catalonia (in Catalan). Retrieved 12 November 2017.
- "Electoral Results Consultation. Municipal. May 2015. Terrassa Municipality". Ministry of the Interior (in Spanish). Retrieved 12 November 2017.
This article is issued from Wikipedia. The text is licensed under Creative Commons - Attribution - Sharealike. Additional terms may apply for the media files.