Straw polls for the 2012 Republican Party presidential primaries
This is a list of straw polls that have been conducted relating to the Republican presidential primaries, 2012.
| |||||||||||||||||||||||||||||||||||||||||||||||
| |||||||||||||||||||||||||||||||||||||||||||||||
| |||||||||||||||||||||||||||||||||||||||||||||||
| |||||||||||||||||||||||||||||||||||||||||||||||
.jpg.webp)
.jpg.webp)
2012 U.S. presidential election | |
|---|---|
| Democratic Party | |
| Republican Party | |
| Related races | |
| |
Total Straw Poll Victories (Updated March 20, 2012)
Total Straw Poll Victories is as follows:
| Rank | Potential candidate | Victories | |
|---|---|---|---|
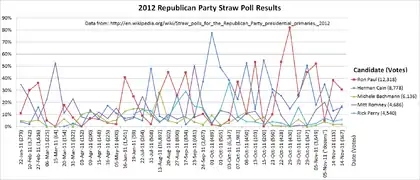
| 1 | Ron Paul | 28 | |
| 2 | Herman Cain | 17 | |
| 3 | Mitt Romney | 8 | |
| 4 | Rick Santorum | 3 | |
| 5 | Michele Bachmann | 2 | |
| 6 | Rick Perry | 2 | |
| 7 | Newt Gingrich | 2 | |
| 8 | Other | 4 |
Straw Poll Victories After Voting Started (Updated March 20, 2012)
The number of Straw Poll victories after voting started is as follows:
| Rank | Potential candidate | Victories | |
|---|---|---|---|
| 1 | Ron Paul | 5 (55.6%) | |
| 2 | Mitt Romney | 3 (33.3%) | |
| 3 | Newt Gingrich | 0 (0%) | |
January 22, 2011, Derry, New Hampshire – New Hampshire Straw Poll
Results from the 2011 New Hampshire Straw Poll were as follows:[3]
| Finish | Potential candidate | Percentage | |
|---|---|---|---|
| 1 | Mitt Romney | 35% | |
| 2 | Ron Paul | 11% | |
| 3 | Tim Pawlenty | 8% | |
| 4 | Sarah Palin | 7% | |
| 5 | Michele Bachmann | 5% | |
| 6 | Jim DeMint | 5% | |
| 7 | Herman Cain | 4% | |
| 8 | Chris Christie | 3% | |
| 9 | Rick Santorum | 3% | |
| 10 | Mitch Daniels | 3% | |
| 11 | Newt Gingrich | 3% | |
| 12 | Mike Huckabee | 3% | |
| 13 | Mike Pence | 3% | |
| 14 | Rudy Giuliani | 2% | |
| 15 | Judd Gregg | 2% | |
| 16 | Gary Johnson | 1% | |
| 17 | Donald Trump | 1% | |
| 18 | Haley Barbour | 1% | |
| 19 | Jon Huntsman Jr. | 0% | |
| 20 | John Thune | 0% | |
| Total | 100% | 273 |
February 10–12, 2011, Washington, D.C. – CPAC Straw Poll
Results from the 2011 CPAC Straw Poll were as follows:[4]
| Finish | Potential candidate | Percentage | Votes |
|---|---|---|---|
| 1 | Ron Paul | 30% | |
| 2 | Mitt Romney | 23% | |
| 3 | Gary Johnson | 6% | |
| 4 | Chris Christie | 6% | |
| 5 | Newt Gingrich | 5% | |
| 6 | Tim Pawlenty | 4% | |
| 7 | Michele Bachmann | 4% | |
| 8 | Mitch Daniels | 4% | |
| 9 | Sarah Palin | 3% | |
| 10 | Herman Cain | 2% | |
| 11 | Mike Huckabee | 2% | |
| 12 | Rick Santorum | 2% | |
| 13 | John Thune | 2% | |
| 14 | Jon Huntsman, Jr. | 1% | |
| 15 | Haley Barbour | 1% | |
| Other | 5% | ||
| Total | 100% | 3,742 |
February 27, 2011, Phoenix, Arizona – Tea Party Straw Polls
Results from the 2011 Tea Party Straw Poll were as follows:
Onsite Poll
| Finish | Potential candidate | Percentage | Votes |
|---|---|---|---|
| 1 | Herman Cain | 22% | |
| 2 | Tim Pawlenty | 16% | |
| 3 | Ron Paul | 15% | |
| 4 | Sarah Palin | 10% | |
| 5 | Mitt Romney | 6.5% | |
| 6 | Michele Bachmann | 5.6% | |
| Other | 24.9% | 620 |
Online Poll
| Finish | Potential candidate | Percentage | Votes |
|---|---|---|---|
| 1 | Ron Paul | 49% | |
| 2 | Herman Cain | 12% | |
| 3 | Sarah Palin | 8.7% | |
| ? | Tim Pawlenty | 4.4% | |
| Other | 25.8% | 996 |
Combined Polls
| Finish | Potential candidate | Percentage | Votes |
|---|---|---|---|
| 1 | Ron Paul | 36% | 581 |
| 2 | Herman Cain | 16% | 256 |
| 3 | Sarah Palin | 9.2% | 149 |
| 4 | Tim Pawlenty | 8.8% | 143 |
| Other | 30.1% | 1616 |
March 6, 2011, Seaside, Oregon – Dorchester Conference Straw Poll
Results from the 2011 Dorchester Conference Straw Poll were as follows:[5]
| Finish | Potential candidate | Percentage | Votes |
|---|---|---|---|
| 1 | Mitch Daniels | 29.33% | 66 |
| 2 | Mitt Romney | 22.67% | 51 |
| 3 | Sarah Palin | 18.22% | 41 |
| 4 | Mike Huckabee | 10.22% | 23 |
| 5 | Newt Gingrich | 6.22% | 14 |
| 6 | Ron Paul | 4.89% | 11 |
| 7 | Tim Pawlenty | 3.56% | 8 |
| 8 | Haley Barbour | 2.67% | 6 |
| 9 | Donald Trump | 1.78% | 4 |
| 10 | Barack Obama | 0.44% | 1 |
March 15, 2011, Washington, D.C. – National League of Cities Straw Poll
Results from the 2011 National League of Cities Straw Poll were as follows:[6]
| Finish | Potential candidate | Percentage |
|---|---|---|
| 1 | Mitt Romney | 53% |
| 2 | Mike Huckabee | 9% |
| 3 | Mitch Daniels | 6% |
| 4 | Newt Gingrich | 6% |
| 5 | Haley Barbour | 3% |
| 6 | Donald Trump | 3% |
| 7 | Chris Christie | 3% |
| 8 | Jon Huntsman | 3% |
| 9 | Sarah Palin | 3% |
| 10 | Paul Ryan | 3% |
| 11 | Ted Turner | 3% |
| 12 | Joe Wilson | 3% |
The "50 or so votes" referenced in all articles on this ballot can only mean that there were either 32 or 64 votes given the percentages above (i.e. 3% of the vote is either 1 vote or 2 votes). Human estimation tendencies would lean towards the real answer being 64 votes.
March 20, 2011, Sacramento, California – Republican Liberty Caucus of California Presidential Straw Poll
Republican Liberty Caucus straw poll at the 2011 California Republican convention:[7]
| Finish | Potential candidate | Percentage | Votes |
|---|---|---|---|
| 1 | Ron Paul | 17.8% | 36 |
| 2 | Mitt Romney | 10.9% | 22 |
| 3 | Sarah Palin | 7.9% | 16 |
| 4 | Newt Gingrich | 6.9% | 14 |
| 5 | Michele Bachmann | 6.4% | 13 |
| 6 | Rudy Giuliani | 5.4% | 11 |
| 6 | Mike Huckabee | 5.4% | 11 |
| 6 | Tim Pawlenty | 5.4% | 11 |
| 9 | Mitch Daniels | 5.0% | 10 |
| 9 | Undecided | 5.0% | 10 |
Finishing with less than ten votes were, in order, John R. Bolton (8), Gary Johnson (7), Herman Cain (5), Haley Barbour (4), Rick Santorum (4), Jon Huntsman, Jr. (3), Donald Trump (3), Chris Christie (2), Jim DeMint (2), Marco Rubio (2), Scott Walker (2), Paul Ryan (1), Colin Powell (1), Allen West (1), Tom McClintock (1), Dana Perino (1), and None of the Above (1).[7]
March 31, 2011, Goffstown, New Hampshire - St. Anselm College Republicans Straw Poll
Karger wins St. Anselm straw poll
| Finish | Potential candidate | Votes | Percentage |
|---|---|---|---|
| 1 | Fred Karger | 79 | 24.6% |
| 2 | Mitt Romney | 74 | 23.0% |
| 3 | Donald Trump | 26 | 8.1% |
| 4 | Ron Paul | 24 | 7.4% |
| 4 | Tim Pawlenty | 24 | 7.4% |
| 6 | Rudy Giuliani | 22 | 6.8% |
| 7 | Rick Santorum | 20 | 6.2% |
| 8 | Sarah Palin | 9 | 2.8% |
| 9 | Herman Cain | 8 | 2.5% |
| 9 | Gary Johnson | 8 | 2.5% |
| 9 | Mike Huckabee | 8 | 2.5% |
| 10 | Newt Gingrich | 7 | 2.2% |
| 11 | Haley Barbour | 3 | 0.9% |
| 12 | Mitch Daniels | 2 | 0.6% |
| 13 | John Bolton | 1 | 0.3% |
| 13 | Rand Paul | 1 | 0.3% |
| Other | 6 | 1.9% | |
| TOTAL | 322 | 100.0% |
April 3, 2011, York County, South Carolina - South Carolina Straw Poll
South Carolina straw poll as part of the Grassroots SC campaign:[8]
| Finish | Potential candidate | Percentage | Votes |
|---|---|---|---|
| 1 | Mike Huckabee | 23% | |
| 2 | Newt Gingrich | 11% | |
| 3 | Michele Bachmann | 10% | |
| 4 | Mitt Romney | 8% | |
| 5 | Donald Trump | 7% | |
| 6 | Tim Pawlenty | 7% | |
| - | Total | 100% | 152 |
Also appearing on the ballot but failing to get more than 5% were, in alphabetical order, Haley Barbour, John R. Bolton, Herman Cain, Mitch Daniels, Jon Huntsman, Jr., Gary Johnson, Sarah Palin, Ron Paul and Rick Santorum.
April 15, 2011, Charleston County - Republican Party Straw Poll
| Place | Candidate | Percentage | Votes |
|---|---|---|---|
| 1 | Haley Barbour | 22% | |
| 2 | Mitt Romney | 12% | |
| 3 | Rick Santorum | 11% | |
| 3 | Donald Trump | 10% | |
| 5 | Michele Bachmann | 9% | |
| 5 | Mike Huckabee | 9% | |
| 7 | Ron Paul | 6% | |
| 7 | Herman Cain | 6% | |
| 9 | Tim Pawlenty | 5% | |
| 10 | Newt Gingrich | ||
| 10 | Sarah Palin | ||
| 12 | Mitch Daniels | ||
| 13 | John Bolton | ||
| Gingrich, Palin, Daniels, Bolton | 10% | ||
| Total | 100% | 148 |
April 16, 2011, Georgia's 3rd congressional district - Georgia 3rd District Convention Straw Poll
Georgia straw poll as part of the 3rd District Republican convention:[10]
| Finish | Potential candidate | Percentage | Votes |
|---|---|---|---|
| 1 | Herman Cain | 17.3% | 39 |
| 2 | Newt Gingrich | 17.3% | 39 |
| 3 | Mike Huckabee | 15.6% | 35 |
| 4 | Donald Trump | 13.8% | 31 |
| 5 | Chris Christie | 8.9% | 20 |
| 6 | Mitt Romney | 6.7% | 15 |
| 7 | Sarah Palin | 4.4% | 10 |
| 8 | Michele Bachmann | 3.6% | 8 |
| 8 | Tim Pawlenty | 3.6% | 8 |
| 10 | Ron Paul | 3.1% | 7 |
| Other | 5.8% | 13 |
May 5–6, 2011, Columbia, South Carolina – South Carolina Republican Party Convention presidential straw poll
| Finish | Candidate | Votes | Percentage |
|---|---|---|---|
| 1 | Santorum | 150 | 37.5% |
| 2 | Romney | 61 | 15.25% |
| 3 | Cain | 44 | 11% |
| 4 | Trump | 29 | 7.25% |
| 5 | Bachmann | 22 | 5.5% |
| 6 | Christie | 22 | 5.5% |
| 7 | Gingrich | 16 | 4% |
| 8 | Huckabee | 16 | 4% |
| 9 | Daniels | 15 | 3.75% |
| 10 | Paul | 8 | 2% |
| 11 | Pawlenty | 7 | 1.75% |
| 12 | Palin | 6 | 1.5% |
| 13 | Huntsman | 4 | 1% |
May 6, 2011, Washington state – Washington GOP 29th Annual Spring Gala straw poll
| Finish | Candidate | Votes | Percentage |
|---|---|---|---|
| 1 | Cain | 54 | 16% |
| 2 | Romney | 52 | 15% |
| 3 | Daniels | 51 | 15% |
| 4 | Christie | 39 | 12% |
| 5 | Pawlenty | 28 | 9% |
| 6 | Ryan | 22 | 7% |
| 7 | Gingrich | 14 | 4% |
| 8 | Huckabee | 14 | 4% |
| 9 | Giuliani | 12 | 4% |
| 10 | Paul | 10 | 3% |
| 11 | Trump | 10 | 3% |
| 12 | Bachmann | 9 | 3% |
| 13 | J. Bush | 8 | 2% |
| 14 | Santorum | 7 | 2% |
| TOTAL | 330 | 100% |
May 15, 2011, Kauai County, Hawaii – Hawaii GOP Presidential straw poll
| Finish | Candidate | Percent |
|---|---|---|
| 1 | Cain | 20.3% |
| 2 | Romney | 13.6% |
| 3 | Gingrich | 11.9% |
| 3 | Pawlenty | 11.9% |
| 3 | Palin | 11.9% |
| 6 | Bachmann | 6.8% |
| 7 | Paul | 3.4% |
| 7 | Giuliani | 3.4% |
| 7 | Huckabee | 3.4% |
| 7 | Trump | 3.4% |
| 11 | Roemer | 1.7% |
| 11 | Santorum | 1.7% |
| 11 | Bolton | 1.7% |
| 11 | Daniels | 1.7% |
| 11 | Christie | 1.7% |
[13] Arithmetic shows 59 votes were canvassed in the straw poll (all rounded-percentages above are multiples of 1.69%).
June 16–18, 2011, New Orleans, Louisiana – Republican Leadership Conference Straw Poll
Source of results: Republican Leadership Conference[14]
| Finish | Candidate | Percentage | Votes |
|---|---|---|---|
| 1 | Ron Paul | 40.77% | 612 |
| 2 | Jon Huntsman | 25.45% | 382 |
| 3 | Michele Bachmann | 12.72% | 191 |
| 4 | Herman Cain | 6.93% | 104 |
| 5 | Mitt Romney | 4.93% | 74 |
| 6 | Newt Gingrich | 4.60% | 69 |
| 7 | Rick Santorum | 2.00% | 30 |
| 8 | Tim Pawlenty | 1.20% | 18 |
| 9 | Gary Johnson | 0.67% | 10 |
| 10 | Buddy Roemer | 0.60% | 9 |
| 11 | Thad McCotter | 0.13% | 2 |
June 19, 2011, Clay County, Iowa - Republican Party Straw Poll
| Finish | Candidate | Votes | Percentage |
|---|---|---|---|
| 1 | Ron Paul | 15 | 25% |
| 2 | Michele Bachmann | 9 | 15% |
| 3 | Rick Santorum | 8 | 14% |
| 4 | Rick Perry | 6 | 10% |
| 5 | Herman Cain | 5 | 8% |
| 6 | Thaddeus McCotter | 4 | 7% |
| 6 | Tim Pawlenty | 4 | 7% |
| 6 | Mitt Romney | 4 | 7% |
| 9 | Newt Gingrich | 2 | 3% |
| 9 | Sarah Palin | 2 | 3% |
July 22, 2011, Ohio Republican Party - Ohio Republican Party Presidential Straw Poll
Source of results: Politico[16]
| Finish | Potential candidate | Percentage | Votes |
|---|---|---|---|
| 1 | Mitt Romney | 25% | |
| 2 | Tim Pawlenty | 16% | |
| 3 | Michele Bachmann | 15% | |
| 4 | Rick Perry (write-in) | 14% | |
| 5 | Ron Paul | 9% | |
| 6 | Herman Cain | 5% | |
| 6 | Rick Santorum | 5% | |
| 8 | Newt Gingrich | 3% | |
| 9 | Jon Huntsman Jr. | 2% | |
| - | Other write-in | 6% | |
| - | Total | 100% | 264 |
July 31, 2011, Denver, Colorado - Western Conservative Summit
Source of results:[17]
| Finish | Potential candidate | Percentage | Votes |
|---|---|---|---|
| 1 | Herman Cain | 48% | 246 |
| 2 | Rick Perry | 13% | 67 |
| 3 | Rick Santorum | 10% | 50 |
| 4 | Mitt Romney | 10% | 49 |
| 5 | Michele Bachmann | 9% | 44 |
| 6 | John Bolton | 4% | 20 |
| 7 | Ron Paul | 2% | 12 |
| 8 | Tim Pawlenty | 1% | 7 |
| 9 | Sarah Palin | 1% | 5 |
| 10 | Newt Gingrich | 1% | 3 |
| 11 | Thaddeus McCotter | 0% | 2 |
| 12 | Jon Huntsman Jr. | 0% | 1 |
| 13 | Gary Johnson | 0% | 1 |
| 14 | Paul Ryan | 0% | 1 |
| 15 | Rudy Giuliani | 0% | 0 |
| - | Total | 100% | 508 |
August 4, 2011, Harrington, Delaware - Delaware State Fair GOP Straw Poll
Source of results:[18]
| Finish | Potential candidate | Percentage |
|---|---|---|
| 1 | Michele Bachmann | 18% |
| 2 | Rick Perry | 15% |
| 2 | Mitt Romney | 15% |
| 4 | Chris Christie | 12% |
| - | Total | 100% |
August 13, 2011, Hilton Coliseum, Ames, Iowa - Iowa Straw Poll
Source of results: Washington Examiner and National Journal[19][20]
| Place | Candidate | Votes | Percentage |
|---|---|---|---|
| 1 | Michele Bachmann | 4,823 | 28.6% |
| 2 | Ron Paul | 4,671 | 27.7% |
| 3 | Tim Pawlenty | 2,293 | 13.6%1 |
| 4 | Rick Santorum | 1,657 | 9.8% |
| 5 | Herman Cain | 1,456 | 8.6% |
| 6 | Rick Perry (write-in)2 | 718 | 4.3% |
| 7 | Mitt Romney3 | 567 | 3.4% |
| 8 | Newt Gingrich | 385 | 2.3% |
| 9 | Jon Huntsman | 69 | 0.4% |
| 10 | Thaddeus McCotter | 35 | 0.2% |
| — | Scattering | 218 | 1.30% |
| Total | 16,892 | 100% |
^1 The day after the poll, on August 14, Tim Pawlenty announced his withdrawal from the race after his third-place finish.[21]
^2 Rick Perry, who was not on the poll ballot and only appeared as a write-in candidate, formally announced his candidacy while in South Carolina on the same day that the poll took place.[22]
^3 In June, two months before the poll, presidential candidate Mitt Romney, who had won the 2007 Ames Straw Poll, announced that he would skip the 2011 Ames Straw Poll.[23]
August 15, 2011, Milwaukee, Wisconsin - Wisconsin State Fair straw poll
Source of results:[24]
| Place | Candidate | Percentage | Votes |
|---|---|---|---|
| 1 | Rick Perry | 36% | |
| 2 | Ron Paul | 23% | |
| 3 | Michele Bachmann | 18% | |
| 4 | Sarah Palin | 13% | |
| 5 | Herman Cain | 8% | |
| 6 | Mitt Romney | 2% | |
| 7 | Jon Huntsman | 0% | |
| 8 | Rick Santorum | 0% | |
| Total | 100% |
August 20, 2011, New Hampshire - New Hampshire Young Republicans Straw Poll
Source of results: Hampton-NorthHamptonPatch[25]
| Place | Candidate | Percentage | Votes |
|---|---|---|---|
| 1 | Ron Paul | 45% | |
| 2 | Mitt Romney | 10% | |
| 3 | Thaddeus McCotter | 8% | |
| 3 | Rick Perry | 8% | |
| 5 | Gary Johnson | 6% | |
| 6 | Michele Bachmann | 5% | |
| 6 | Herman Cain | 5% | |
| 8 | Rick Santorum3 | 3% | |
| 8 | Buddy Roemer | 3% | |
| 8 | Jon Huntsman | 3% | |
| 11 | Newt Gingrich | 1% | |
| 11 | Paul Ryan | 1% | |
| 11 | Rudy Giuliani | 1% | |
| 14 | Fred Karger | 0% | |
| — | Scattering | 1% | |
| Total | 100% | 302 |
August 27, 2011, Georgia - Georgia State GOP Straw Poll
Source of results: Politico[26]
| Place | Candidate | Percentage | Votes |
|---|---|---|---|
| 1 | Herman Cain | 26% | 232 |
| 2 | Ron Paul | 25.7% | 229 |
| 3 | Rick Perry | 20% | 179 |
| 4 | Newt Gingrich | 18% | 162 |
| 5 | Mitt Romney | 6% | 51 |
| 6 | Michele Bachmann | 3% | 29 |
| 7 | Rick Santorum | .4% | 4 |
| 8 | Jon Huntsman | .3% | 3 |
| 9 | Thad McCotter | .1% | 1 |
| 10 | Buddy Roemer | 0% | 0 |
| 10 | Gary Johnson | 0% | 0 |
| Total | 100% | 890 |
September 9, 2011, Maryland - Maryland GOP Straw Poll
Source of results: Republican Party of Maryland[27]
| Place | Candidate | Percentage |
|---|---|---|
| 1 | Rick Perry | 25.8% |
| 2 | Mitt Romney | 21.2% |
| 3 | Ron Paul | 16.8% |
| 4 | Michele Bachmann | 12.5% |
| 5 | Sarah Palin | 7.2% |
| 6 | Herman Cain | 5.0% |
| 7 | Other/Write-in | 4.4% |
| 8 | Newt Gingrich | 2.3% |
| 9 | Jon Huntsman | 2.2% |
| 10 | Buddy Roemer | 0.5% |
| 11 | Gary Johnson | 0.3% |
| 11 | Thad McCotter | 0.3% |
| Total | 100% |
September 12, 2011 Cincinnati Tea Party Straw Poll
A straw poll was held at the September 12 Republican debate, to find out who the debate audience thought were the front runners, both before and after the debate. Before the debate, Ron Paul came first, Rick Perry came second, and Michele Bachmann came third. After the debate, Ron Paul was still first, Michele Bachmann came second, and Herman Cain came third.[28] CNN have not released the full results of this poll, instead holding an online poll which omitted Ron Paul from the choices. The winner of the online poll was Mitt Romney.
Pre-Debate Poll
| Finish | Candidate |
|---|---|
| 1 | Ron Paul |
| 2 | Rick Perry |
| 3 | Michele Bachmann |
Post-Debate Poll
| Finish | Candidate |
|---|---|
| 1 | Ron Paul |
| 2 | Michele Bachmann |
| 3 | Herman Cain |
September 16, 2011 Harrisburg, Pennsylvania straw poll
Former senator Rick Santorum won first place in a straw poll among Pennsylvania Republicans, winning 36% of the vote. Governor Mitt Romney won 25%, and Governor Rick Perry won 18%.[29]
September 17 California GOP Straw Poll
The California Republican Party held a straw poll in mid-September 2011, which was won by Ron Paul. The full results were:
Source of results: Politico[30]
| Place | Candidate | Percentage | Votes |
|---|---|---|---|
| 1 | Ron Paul | 44.9% | 374 |
| 2 | Rick Perry | 29.3% | 244 |
| 3 | Mitt Romney | 8.8% | 74 |
| 4 | Michele Bachmann | 7.7% | 64 |
| 5 | Jon Huntsman | 2.0% | 17 |
| 6 | Herman Cain | 1.8% | 15 |
| 7 | Newt Gingrich | 1.7% | 14 |
| 8 | Thad McCotter | 0.8% | 7 |
| 9 | Rick Santorum | 0.8% | 7 |
| 10 | Gary Johnson | 0.2% | 2 |
| 11 | Fred Karger | 0.1% | 1 |
| Write-ins | 1.8% | 15 |
September 24 Florida GOP Presidency 5 Straw Poll
The Florida Republican Party held a straw poll at the end of September 2011,[31] which was won by Herman Cain. Political analysts attributed Cain's win to Perry's poor debate performances, but others pointed to the fact that Cain won the Florida straw poll after campaigning in-person throughout the state more than Perry.[32]
The full results were:
Source of results:[33]
| Place | Candidate | Percentage | Votes |
|---|---|---|---|
| 1 | Herman Cain | 37.11% | 986 |
| 2 | Rick Perry | 15.43% | 410 |
| 3 | Mitt Romney | 14.00% | 372 |
| 4 | Rick Santorum | 10.88% | 289 |
| 5 | Ron Paul | 10.39% | 276 |
| 6 | Newt Gingrich | 8.43% | 224 |
| 7 | Jon Huntsman, Jr. | 2.26% | 60 |
| 8 | Michele Bachmann | 1.51% | 40 |
September 23–25, 2011, Michigan Republican Party Mackinac Republican Leadership Conference Straw Poll
| Finish | Potential candidate | Percentage | Votes |
|---|---|---|---|
| 1 | Mitt Romney | 50.81% | 346 |
| 2 | Rick Perry | 16.74% | 114 |
| 3 | Herman Cain | 8.5% | 58 |
| 4 | Ron Paul | 7.7% | 52 |
| 5 | Michele Bachmann | 4% | 27 |
| 6 | Newt Gingrich | 3.5% | 24 |
| 7 | Rick Santorum | 3.4% | 23 |
| 8 | Jon Huntsman, Jr. | 2% | 13 |
| 9 | Thaddeus McCotter | 0.73% | 5 |
| Other | 2.82% | 19 | |
| Total | 100% | 681 |
October 1, 2011, National Federation of Republican Women Straw Poll
| Finish | Potential candidate | Percentage | Votes |
|---|---|---|---|
| 1 | Herman Cain | 48.9% | |
| 2 | Rick Perry | 14.1% | |
| 3 | Mitt Romney | 13.3% | |
| 4 | Newt Gingrich | 12.5% | |
| 5 | Rick Santorum | 6.9% | |
| 6 | Michele Bachmann | 1.4% | |
| 7 | Ron Paul | 0.6% | |
| 8 | Gary Johnson | 0.4% | |
| 9 | Jon Huntsman, Jr. | 0.2% | |
| Undecided | 1.8% | ||
| Total | 100% | 505 |
October 1, 2011, TeaCon Midwest Straw Poll
Source of results:[38]
| Finish | Potential candidate | Percentage | Votes |
|---|---|---|---|
| 1 | Herman Cain | 77.5% | 379 |
| 2 | Michele Bachmann | 9.4% | 46 |
| 3 | Newt Gingrich | 3.8% | 19 |
| 4 | Rick Perry | 3.0% | 15 |
| 5 | Mitt Romney | 2.6% | 13 |
| 6 | Ron Paul | 1.6% | 9 |
| 7 | Rick Santorum | 1.4% | 7 |
| 8 | Barack Obama | 0.2% | 1 |
| 9 | Gary Johnson | 0.0% | 0 |
| 10 | Jon Huntsman, Jr. | 0.0% | 0 |
| Total | 100% | 489 |
The vote for Obama was attributed to a vote by one of the media members present for the event by the announcer.[39]
October 3–9, 2011, South Carolina - Orangeburg County Fair Straw Poll
Source of results:[40]
| Finish | Potential candidate | Votes | Percentage |
|---|---|---|---|
| 1 | Herman Cain | 2438 | 38.4% |
| 2 | Rick Perry | 2292 | 36.1% |
| 3 | Mitt Romney | 728 | 11.5% |
| 4 | Ron Paul | 337 | 5.3% |
| 5 | Michele Bachmann | 194 | 3.1% |
| 6 | Newt Gingrich | 137 | 2.2% |
| 7 | Rick Santorum | 107 | 1.7% |
| 8 | Sarah Palin | 54 | 0.9% |
| 9 | Donald Trump | 53 | 0.8% |
| 10 | Jon Huntsman Jr. | 5 | 0.1% |
| 11 | Gary Johnson | 2 | 0.0% |
| Total | 6,347 | 100% |
October 7–9, 2011, Washington, D.C. – Values Voter Straw Poll
Source of results:[41]
| Finish | Potential candidate | Percentage | Votes |
|---|---|---|---|
| 1 | Ron Paul | 36.9% | 732 |
| 2 | Herman Cain | 22.5% | 447 |
| 3 | Rick Santorum | 16.3% | 323 |
| 4 | Rick Perry | 8.4% | 167 |
| 5 | Michele Bachmann | 7.9% | 157 |
| 6 | Mitt Romney | 4.4% | 88 |
| 7 | Newt Gingrich | 2.7% | 54 |
| 8 | Undecided | 0.7% | 13 |
| 9 | Jon Huntsman | 0.1% | 2 |
| Total | 100% | 1,983 |
October 8, 2011, Saint Paul, Minnesota - Republican Midwest Leadership Conference Straw Poll
Source of results:[42]
| Finish | Potential candidate | Percentage | Votes |
|---|---|---|---|
| 1 | Herman Cain | 52.6% | 237 |
| 2 | Michele Bachmann | 12.2% | 55 |
| 3 | Mitt Romney | 11.1% | 50 |
| 4 | Ron Paul | 10.7% | 48 |
| 5 | Rick Perry | 4.0% | 18 |
| 6 | Newt Gingrich | 3.3% | 15 |
| 7 | Rick Santorum | 2.0% | 9 |
| 8 | Jon Huntsman | 0.9% | 4 |
| 9 | Gary Johnson | 0.2% | 1 |
| Total | 100% | 450 |
October 13, 2011, Los Angeles County, California - RPLAC Straw Poll
| Finish | Potential candidate | Percentage | Votes |
|---|---|---|---|
| 1 | Ron Paul | 53.4% | 55 |
| 2 | Herman Cain | 14.6% | 15 |
| 3 | Mitt Romney | 12.6% | 13 |
| 4 | Newt Gingrich | 5.8% | 6 |
| 5 | Michele Bachmann | 4.9% | 5 |
| 6 | Rick Perry | 3.9% | 4 |
| 7 | Gary Johnson | 3.9% | 4 |
| 8 | Rick Santorum | 1.0% | 1 |
| 9 | Jon Huntsman | 0.0% | 0 |
| Total | 100% | 103 |
October 15, 2011, Columbia, South Carolina - Tea Party Straw Poll
Source of results:[43]
| Finish | Potential candidate | Percentage | Votes |
|---|---|---|---|
| 1 | Herman Cain | 55% | 110 |
| 2 | Newt Gingrich | 14.5% | 29 |
| 3 | Michele Bachmann | 8% | 16 |
| 4 | Mitt Romney | 3% | 6 |
| 5 | Rick Perry | 2% | 4 |
| 6 | Jon Huntsman | 1% | 2 |
| Total | 100% | 200 |
Note: the percentages only add to 83.5% because results for 3 contenders (likely Ron Paul, Rick Santorum and Gary Johnson) are unknown, but they polled somewhere in between Romney and Bachmann.
October 15, 2011, Bismarck, North Dakota - Tea Party Straw Poll
Source of results:[44]
| Finish | Candidate | Percentage |
|---|---|---|
| 1 | Herman Cain | 55.5% |
| 2 | Ron Paul | 9% |
| 3 | Rick Perry | 8% |
| Total | 100% |
October 18, 2011, Charleston, South Carolina - Charleston County Republican Party
Source of results:[45]
| Finish | Potential candidate | Percentage | Votes |
|---|---|---|---|
| 1 | Ron Paul | 51% | 35 |
| 2 | Rick Santorum | 17% | 12 |
| 3 | Newt Gingrich | 12% | 8 |
| 4 | Herman Cain | 8% | 5 |
| 5 | Mitt Romney | 5% | 3 |
| 6 | Michele Bachmann | 3% | 2 |
| 7 | Rick Perry | 2% | 2 |
| 8 | Jon Huntsman | 0% | 0 |
| * | Rudy Giuliani | 1% | 1 |
| Total | 100% | 68 |
October 18, 2011, Mississippi College Straw poll
Source of results:[46]
| Finish | Candidate | Percentage |
|---|---|---|
| 1 | Ron Paul | 55% |
| 2 | Rick Perry | 30% |
| 3 | Herman Cain | 19% |
| 4 | Mitt Romney | 17% |
| 5 | Michele Bachmann | 6% |
| 6 | Gary Johnson | 6% |
| 7 | Newt Gingrich | 4% |
| 8 | Other | 3% |
| Total | 100% |
October 21, 2011, Las Vegas, Nevada - Nevada GOP Straw Poll
| Finish | Potential candidate | Percentage (approx.) | Votes |
|---|---|---|---|
| 1 | Herman Cain | 31% | |
| 2 | Mitt Romney | 29% | |
| 3 | Newt Gingrich | 21% | |
| 4 | Ron Paul | 10% | |
| 5 | Rick Perry | 4% | |
| Michele Bachmann | 1% | ||
| Rick Santorum | < 5% | ||
| Total | > 550 |
October 22, 2011, Columbus, Ohio - Ohio GOP Swing State Straw Poll
Source of results:[49]
| Finish | Potential candidate | Percentage | Votes |
|---|---|---|---|
| 1 | Ron Paul | 53.50% | 229 |
| 2 | Herman Cain | 25.47% | 109 |
| 3 | Mitt Romney | 8.88% | 38 |
| 4 | Newt Gingrich | 5.37% | 23 |
| 5 | Rick Perry | 2.80% | 12 |
| 6 | Jon Huntsman, Jr | 2.10% | 9 |
| 7 | Rick Santorum | 0.93% | 4 |
| 8 | Michele Bachmann | 0.47% | 2 |
| Write-in | 0.47% | 2 | |
| Total | 100% | 428 |
October 25, 2011, Anderson County, Tennessee - East Tennessee GOP straw poll
Source of results:[50]
| Finish | Potential candidate | Percentage |
|---|---|---|
| 1 | Herman Cain | 59% |
| 2 | Ron Paul | 16% |
| 3 | Mitt Romney | 11% |
| 4 | Michele Bachmann | 5% |
| 5 | Newt Gingrich | 4% |
| 6 | Rick Perry | 3% |
| 7 | Rick Santorum | 1% |
| 8 | Jon Huntsman | 1% |
| Total | 100% |
October 29, 2011, Des Moines, Iowa - National Federation of Republican Assemblies Presidential Straw Poll
Source of results:[51]
Tally 1 (Iowa voters only):
| Finish | Potential candidate | Percentage | Votes |
|---|---|---|---|
| 1 | Ron Paul | 82% | 353 |
| 2 | Herman Cain | 14.7% | 63 |
| 3 | Rick Santorum | 1% | 5 |
| 4 | Newt Gingrich | 0.9% | 4 |
| 5 | Michele Bachmann | 0.5% | 2 |
| 5 | Rick Perry | 0.5% | 2 |
| 7 | Gary Johnson | 0.2% | 1 |
| 8 | Mitt Romney | 0.0% | 0 |
| 8 | Jon Huntsman | 0.0% | 0 |
| Total | 100% | 430 |
Tally 2 (non-Iowa voters)
| Finish | Potential candidate | Percentage | Votes |
|---|---|---|---|
| 1 | Ron Paul | 26% | 26 |
| 2 | Herman Cain | 25% | 25 |
| 3 | Rick Santorum | 16% | 16 |
| 3 | Rick Perry | 16% | 16 |
| 5 | Newt Gingrich | 11% | 11 |
| 6 | Michele Bachmann | 6% | 6 |
| 7 | Mitt Romney | 1% | 1 |
| 8 | Jon Huntsman | 0% | 0 |
| 8 | Gary Johnson | 0% | 0 |
| Total | 100% | 101 |
October 29, 2011, Tuscaloosa, Alabama - West Alabama Straw Poll
Source of results:[52]
| Finish | Potential candidate | Percentage | Votes |
|---|---|---|---|
| 1 | Herman Cain | 50.7% | 176 |
| 2 | Ron Paul | 45% | 156 |
| 3 | Newt Gingrich | 1.4% | 5 |
| 3 | Rick Perry | 1.4% | 5 |
| 5 | Mitt Romney | 0.9% | 3 |
| 6 | Gary Johnson | 0.3% | 1 |
| 6 | Rick Santorum | 0.3% | 1 |
| 8 | Michele Bachmann | 0% | 0 |
| 8 | Jon Huntsman | 0% | 0 |
| Total | 100% | 347 |
November 5, 2011, Illinois - Illinois Straw Poll
Source of results:[53]
| Finish | Potential candidate | Percentage | Votes |
|---|---|---|---|
| 1 | Ron Paul | 52% | 1,907 |
| 2 | Herman Cain | 18% | 670 |
| 3 | Mitt Romney | 14% | 515 |
| 4 | Newt Gingrich | 9% | 332 |
| 5 | Rick Perry | 2.5% | 87 |
| 6 | Jon Huntsman | 1.5% | 54 |
| 7 | Rick Santorum | 1.2% | 43 |
| 8 | Michele Bachmann | 1.1% | 41 |
| Total | 100% | 3,649 |
November 5, 2011, Sioux Falls, South Dakota - South Dakota Straw Poll
Source of results:[54]
According to KSFY/ABC "dozens" of people participated in this straw poll. No definitive number was given.[55]
| Finish | Potential candidate | Percentage |
|---|---|---|
| 1 | Herman Cain | 35% |
| 2 | Newt Gingrich | 23% |
| 3 | Mitt Romney | 20% |
| 4 | Rick Perry | 7% |
| 5 | Ron Paul | 5% |
| 6 | Michele Bachmann | 4% |
| 7 | Jon Huntsman | 3% |
| 8 | Rick Santorum | 3% |
| Total | 100% |
November 14, 2011, North Charleston, South Carolina - Charleston County Republican Party Straw Poll
Source of results:[56]
| Finish | Potential candidate | Percentage | Votes |
|---|---|---|---|
| 1 | Ron Paul | 38.26% | 44 |
| 2 | Newt Gingrich | 28.70% | 33 |
| 3 | Herman Cain | 13.04% | 15 |
| 4 | Rick Santorum | 7.83% | 9 |
| 5 | Rick Perry | 4.35% | 5 |
| 6 | Mitt Romney | 3.48% | 4 |
| 7 | Michele Bachmann | 1.74% | 2 |
| 8 | Other | 1.74% | 2 |
| 9 | Jon Huntsman | 0.87% | 1 |
| Total | 100% | 115 |
November 14, 2011, San Diego, California - San Diego GOP Straw poll
Source of results:[57]
| Finish | Potential candidate | Percentage | Votes |
|---|---|---|---|
| 1 | Ron Paul | 30.5% | 112 |
| 2 | Newt Gingrich | 22.6% | 83 |
| 3 | Mitt Romney | 17.4% | 64 |
| 4 | Herman Cain | 16.1% | 59 |
| 5 | Rick Perry | 5.7% | 21 |
| 6 | Gary Johnson | 3.5% | 13 |
| 7 | Jon Huntsman | 2.2% | 8 |
| 8 | Michele Bachmann | 1.9% | 7 |
| 9 | Rick Santorum | 0% | 0 |
| Total | 100% | 367 |
November 19, 2011, Springfield, Missouri - Missouri Tea Party Straw poll
Source of results:[58]
| Finish | Potential candidate | Percentage | Votes |
|---|---|---|---|
| 1 | Herman Cain | 32% | 320 |
| 2 | Ron Paul | 28% | 282 |
| 3 | Newt Gingrich | 28% | 276 |
| 4 | Mitt Romney | 3% | 32 |
| 5 | Michele Bachmann | 3% | 31 |
| 6 | Rick Perry | 3% | 30 |
| 7 | Rick Santorum | 1% | 13 |
| Other | 2% | 11 | |
| Total | 100% | 995 |
November 19, 2011, North Carolina - North Carolina Republican straw poll
Source of results:[59]
| Finish | Potential candidate | Percentage | Votes |
|---|---|---|---|
| 1 | Ron Paul | 52.2% | 329 |
| 2 | Newt Gingrich | 22.1% | 139 |
| 3 | Herman Cain | 13.3% | 84 |
| 4 | Mitt Romney | 3.6% | 23 |
| 5 | Michele Bachmann | 2.8% | 18 |
| 6 | Rick Perry | 1.9% | 12 |
| 6 | Rick Santorum | 1.9% | 12 |
| 7 | Jon Huntsman | 0.6% | 4 |
| 8 | Gary Johnson | 0.3% | 2 |
| 9 | Other | 1.3% | 7 |
| Total | 100% | 630 |
November 19, 2011, Rockford, Illinois - Winnebago County GOP straw poll
Source of results:[60]
| Finish | Potential candidate | Votes | Percentage |
|---|---|---|---|
| 1 | Newt Gingrich | 32 | 32.7% |
| 2 | Ron Paul | 20 | 20.4% |
| 3 | Herman Cain | 17 | 17.3% |
| 4 | Mitt Romney | 15 | 15.3% |
| 5 | Michele Bachmann | 8 | 8.2% |
| 6 | Rick Perry | 4 | 4.1% |
| 7 | Jon Huntsman | 1 | 1.0% |
| 7 | Rick Santorum | 1 | 1.0% |
| Total | 98 | 100.0% |
December 1, 2011, Dubuque, Iowa - Dubuque Tea Party straw poll
Source of results:[61]
| Finish | Candidate | Percentage | Votes |
|---|---|---|---|
| 1 | Ron Paul | 71% | 59 |
| 2 | Newt Gingrich | 29% | 24 |
| Total | 100% | 83 |
Note: This was an unusual straw poll in which voter's preferences were matched against each other for five rounds, with the less popular candidate being removed at each stage. There were initially 6 available choices, which were whittled down to two, with the final result being as shown above.
December 5, 2011, Oklahoma City, Oklahoma - Oklahoma GOP straw poll
Source of results:[62]
| Finish | Candidate | Percent |
|---|---|---|
| 1 | Ron Paul | 46% |
| 2 | Herman Cain | 25% |
| 3 | Newt Gingrich | 17% |
| 4 | Mitt Romney | 6% |
| 5 | Rick Perry | 3% |
| 6 | Michele Bachmann | 2% |
| 7 | Rick Santorum | 1% |
| 8 | Gary Johnson | <1% |
| Total | 100% |
December 8, 2011, Chattanooga, Tennessee - Hamilton County Young Republican straw poll
Source of results:[63]
| Finish | Candidate | Percent |
|---|---|---|
| 1 | Newt Gingrich | 50% |
| 2 | Ron Paul | 20% |
| 3 | Mitt Romney | 12% |
| 4 | Rick Perry | 10% |
| 5 | Michele Bachmann | 4% |
| 6 | Jon Huntsman | 3% |
| 7 | Rick Santorum | 1% |
| Total | 100% |
December 10, 2011, Des Moines, IA – Drake University Straw Poll
Results from the 2011 Drake University Straw Poll were as follows:[64][65]
| Finish | Candidate | Percentage | Votes |
|---|---|---|---|
| 1 | Ron Paul | 35% | 429 |
| 2 | Mitt Romney | 25% | 311 |
| 3 | Newt Gingrich | 10% | 128 |
| 4 | Jon Huntsman | 8% | 98 |
| 5 | Other | 8% | 98 |
| 6 | Rick Perry | 5% | 63 |
| 7 | Michele Bachmann | 3% | 37 |
| 8 | Rick Santorum | 2% | 29 |
| 9 | Fred Karger | 1% | 12 |
| 10 | Gary Johnson | 1% | 11 |
| 11 | Buddy Roemer | 1% | 7 |
| Total | 100% | 1,223 |
The poll was distributed to Drake students via email to coincide with the December 10 Republican presidential debate, held on campus.
December 13, 2011, Pasco County, Florida – Pasco County GOP straw poll
Results:[66]
| Finish | Candidate | Percentage | Votes |
|---|---|---|---|
| 1 | Ron Paul | 68% | 171 |
| 2 | Newt Gingrich | 20% | 51 |
| 3 | Mitt Romney | 12% | 30 |
| Total | 100% | 252 |
December 13, 2011, Cedar Valley, Iowa – Cedar Falls Tea Party Straw Poll
Results:[67]
| Finish | Candidate | Percentage | Votes |
|---|---|---|---|
| 1 | Ron Paul | 72% | 60 |
| 2 | Rick Santorum | 11% | 9 |
| 3 | Newt Gingrich | 6% | 5 |
| 4 | Michele Bachmann | 4% | 3 |
| 5 | Jon Huntsman | 4% | 3 |
| 6 | Mitt Romney | 2% | 2 |
| 7 | Rick Perry | 1% | 1 |
| Total | 100% | 83 |
January 2–4, 2012, Online - Idaho Straw Poll
Results:[68]
| Finish | Candidate | Percentage |
|---|---|---|
| 1 | Ron Paul | 73.53% |
| 2 | Rick Santorum | 8.09% |
| 3 | Newt Gingrich | 7.35% |
| 4 | Mitt Romney | 5.15% |
| 5 | Barack Obama | 3.68% |
| 6 | Gary Johnson | 1.47% |
| 7 | Rick Perry | 0.74% |
| 8 | Jon Huntsman | 0.00% |
| 9 | Michele Bachmann | 0.00% |
| Total | 100% |
January 6, 2012, Boise, Idaho – Idaho Republican Party Presidential Straw Poll
Results:[69]
| Finish | Candidate | Percentage | Votes |
|---|---|---|---|
| 1 | Ron Paul | 43% | 173 |
| 2 | Mitt Romney | 34% | 135 |
| 3 | Newt Gingrich | 12% | 47 |
| 4 | Rick Santorum | 10% | 40 |
| 5 | Jon Huntsman | 1% | 4 |
| Total | 100% | 399 |
Note: Rick Perry's campaign asked not to be included on Straw Poll Ballot.
January 14, 2012: Saddle Up Texas straw poll
Results:[70]
Paper ballots:
| Finish | Candidate | Percentage |
|---|---|---|
| 1 | Ron Paul | 27.9% |
| 2 | Newt Gingrich | 23.8% |
| 3 | Rick Santorum | 21.2% |
| 4 | Rick Perry | 19.4% |
| 5 | Mitt Romney | 6.6% |
| 6 | Jon Huntsman | 1.1% |
| Total | 707 |
Text message voting:
| Finish | Candidate | Percentage |
|---|---|---|
| 1 | Ron Paul | 54.4% |
| 2 | Rick Santorum | 15.6% |
| 4 | Rick Perry | 13.3% |
| 3 | Newt Gingrich | 11.9% |
| 5 | Mitt Romney | 4.2% |
| 6 | Jon Huntsman | 0.5% |
| Total | 3300 |
January 20, 2012: Connecticut GOP straw poll
Results:[71]
| Finish | Candidate | Percentage |
|---|---|---|
| 1 | Mitt Romney | 29% |
| 2 | Newt Gingrich | 28% |
| 3 | Ron Paul | 26% |
| 4 | Rick Santorum | 11% |
| 5 | Other | 6% |
| Total | 100% |
January 28, 2012, Arizona Republican Party Presidential Straw Poll
Results:[72]
| Finish | Candidate | Percentage | Votes |
|---|---|---|---|
| 1 | Ron Paul | 85% | 256 |
| 2 | Newt Gingrich | 6.6% | 20 |
| 3 | Mitt Romney | 5.6% | 17 |
| 4 | Rick Santorum | 2.7% | 8 |
| Total | 100% | 301 |
February 2–4, 2012, Online – Idaho Straw Poll II
Results:[73]
| Finish | Candidate | Percentage |
|---|---|---|
| 1 | Mitt Romney | 45.39% |
| 2 | Ron Paul | 42.70% |
| 3 | Rick Santorum | 4.49% |
| 4 | Newt Gingrich | 3.82% |
| 5 | Barack Obama | 3.15% |
| 6 | Other | 0.45% |
| Total | 100% |
February 10–12, 2012, Washington, D.C. – CPAC Straw Poll
| Finish | Candidate | Percentage | Votes |
|---|---|---|---|
| 1 | Mitt Romney | 38% | ~1295 |
| 2 | Rick Santorum | 31% | ~1056 |
| 3 | Newt Gingrich | 15% | ~511 |
| 4 | Ron Paul | 12% | ~409 |
| Total | 100% | 3408 |
February 18, 2012, Coweta County Republican Presidential Straw Poll
Results:[77]
| Finish | Candidate | Percentage | Votes |
|---|---|---|---|
| 1 | Rick Santorum | 40.0% | 38 |
| 2 | Newt Gingrich | 27.4% | 26 |
| 3 | Ron Paul | 17.9% | 17 |
| 4 | Mitt Romney | 5.3% | 5 |
| 5 | Jeb Bush | 1.1% | 1 |
| 6 | Sarah Palin | 1.1% | 1 |
| 7 | Other | 4.2% | 4 |
| 8 | Undecided | 3.2% | 3 |
| Total | 100% | 95 |
March 1–3, 2012, Online - Idaho Straw Poll III
Results:[78]
Candidate Totals
| Finish | Candidate | Percentage | Votes |
|---|---|---|---|
| 1 | Ron Paul | 51.37% | 525 |
| 2 | Mitt Romney | 35.03% | 358 |
| 3 | Gary Johnson | 3.91% | 40 |
| 4 | Rick Santorum | 3.23% | 33 |
| 5 | Virgil Goode | 2.84% | 29 |
| 6 | Buddy Roemer | 1.96% | 20 |
| 7 | Newt Gingrich | 0.98% | 10 |
| 8 | Barack Obama | 0.49% | 5 |
| 9 | Other | 0.2% | 2 |
| Total | 100% | 1022 |
Zip Code Totals
| Zip Code | Ron Paul | Mitt Romney | Gary Johnson | Rick Santorum | Virgil Goode | Buddy Roemer | Newt Gingrich | Barack Obama | Other | Total |
|---|---|---|---|---|---|---|---|---|---|---|
| 83201 | 90 | 20 | 21 | 1 | 13 | 9 | 0 | 1 | 1 | 156 |
| 83642 | 11 | 46 | 0 | 1 | 0 | 0 | 0 | 0 | 0 | 58 |
| 83709 | 21 | 24 | 0 | 6 | 0 | 0 | 0 | 0 | 0 | 51 |
| 83440 | 20 | 19 | 0 | 1 | 0 | 0 | 0 | 0 | 0 | 40 |
| 83401 | 7 | 26 | 0 | 6 | 0 | 0 | 1 | 0 | 0 | 40 |
| 83202 | 15 | 3 | 9 | 0 | 8 | 2 | 0 | 0 | 0 | 37 |
| 83705 | 10 | 14 | 0 | 1 | 0 | 0 | 0 | 2 | 0 | 27 |
| 83646 | 5 | 19 | 0 | 3 | 0 | 0 | 0 | 0 | 0 | 27 |
| 83704 | 18 | 6 | 0 | 0 | 0 | 0 | 2 | 0 | 0 | 26 |
| 83714 | 14 | 9 | 0 | 0 | 0 | 0 | 0 | 0 | 0 | 23 |
| 83713 | 16 | 3 | 0 | 2 | 0 | 0 | 0 | 0 | 0 | 21 |
| 83706 | 10 | 10 | 0 | 1 | 0 | 0 | 0 | 0 | 0 | 21 |
| 83350 | 0 | 20 | 0 | 1 | 0 | 0 | 0 | 0 | 0 | 21 |
| 83702 | 14 | 5 | 0 | 0 | 0 | 0 | 0 | 0 | 0 | 19 |
| 83402 | 0 | 16 | 0 | 1 | 0 | 0 | 1 | 0 | 0 | 18 |
| 83204 | 12 | 0 | 0 | 0 | 1 | 4 | 0 | 0 | 0 | 17 |
| 83203 | 9 | 0 | 4 | 0 | 3 | 1 | 0 | 0 | 0 | 17 |
| 83406 | 4 | 11 | 0 | 0 | 0 | 0 | 0 | 0 | 0 | 15 |
| 83616 | 4 | 11 | 0 | 0 | 0 | 0 | 0 | 0 | 0 | 15 |
| 83814 | 11 | 2 | 0 | 1 | 0 | 0 | 0 | 0 | 0 | 14 |
| Zip Code | Ron Paul | Mitt Romney | Gary Johnson | Rick Santorum | Virgil Goode | Buddy Roemer | Newt Gingrich | Barack Obama | Other | Total |
| 83815 | 11 | 1 | 0 | 1 | 0 | 0 | 0 | 0 | 0 | 13 |
| 83205 | 8 | 0 | 4 | 0 | 1 | 0 | 0 | 0 | 0 | 13 |
| 83318 | 2 | 10 | 0 | 1 | 0 | 0 | 0 | 0 | 0 | 13 |
| 83654 | 12 | 0 | 0 | 0 | 0 | 0 | 0 | 0 | 0 | 12 |
| 83835 | 10 | 0 | 0 | 1 | 0 | 0 | 0 | 0 | 1 | 12 |
| 83687 | 5 | 7 | 0 | 0 | 0 | 0 | 0 | 0 | 0 | 12 |
| 83301 | 10 | 1 | 0 | 0 | 0 | 0 | 0 | 0 | 0 | 11 |
| 83206 | 5 | 0 | 1 | 0 | 3 | 2 | 0 | 0 | 0 | 11 |
| 83843 | 9 | 0 | 0 | 1 | 0 | 0 | 0 | 0 | 0 | 10 |
| 83686 | 8 | 1 | 0 | 0 | 0 | 0 | 1 | 0 | 0 | 10 |
| 83651 | 6 | 3 | 0 | 0 | 0 | 0 | 0 | 1 | 0 | 10 |
| 83605 | 6 | 3 | 0 | 1 | 0 | 0 | 0 | 0 | 0 | 10 |
| 83607 | 6 | 4 | 0 | 0 | 0 | 0 | 0 | 0 | 0 | 10 |
| 83404 | 0 | 9 | 0 | 0 | 0 | 0 | 1 | 0 | 0 | 10 |
| 83703 | 7 | 2 | 0 | 0 | 0 | 0 | 0 | 0 | 0 | 9 |
| 83712 | 5 | 3 | 0 | 0 | 0 | 0 | 0 | 0 | 0 | 8 |
| 83634 | 2 | 5 | 0 | 1 | 0 | 0 | 0 | 0 | 0 | 8 |
| 83274 | 0 | 8 | 0 | 0 | 0 | 0 | 0 | 0 | 0 | 8 |
| 83221 | 4 | 3 | 0 | 0 | 0 | 0 | 0 | 0 | 0 | 7 |
| 83648 | 5 | 0 | 0 | 1 | 0 | 0 | 0 | 0 | 0 | 6 |
| Zip Code | Ron Paul | Mitt Romney | Gary Johnson | Rick Santorum | Virgil Goode | Buddy Roemer | Newt Gingrich | Barack Obama | Other | Total |
| 83858 | 5 | 0 | 0 | 0 | 0 | 0 | 0 | 0 | 0 | 5 |
| 83716 | 3 | 2 | 0 | 0 | 0 | 0 | 0 | 0 | 0 | 5 |
| 83501 | 4 | 0 | 0 | 0 | 0 | 0 | 0 | 0 | 0 | 4 |
| 83544 | 4 | 0 | 0 | 0 | 0 | 0 | 0 | 0 | 0 | 4 |
| 83701 | 4 | 0 | 0 | 0 | 0 | 0 | 3 | 0 | 0 | 4 |
| 83801 | 4 | 0 | 0 | 0 | 0 | 0 | 0 | 0 | 0 | 4 |
| 83861 | 4 | 0 | 0 | 0 | 0 | 0 | 0 | 0 | 0 | 4 |
| 83435 | 3 | 1 | 0 | 0 | 0 | 0 | 0 | 0 | 0 | 4 |
| 83200 | 2 | 0 | 0 | 0 | 0 | 2 | 0 | 0 | 0 | 4 |
| 83655 | 2 | 0 | 0 | 1 | 0 | 0 | 1 | 0 | 0 | 4 |
| 83669 | 1 | 3 | 0 | 0 | 0 | 0 | 0 | 0 | 0 | 4 |
| 83254 | 0 | 4 | 0 | 0 | 0 | 0 | 0 | 0 | 0 | 4 |
| 83263 | 3 | 0 | 0 | 0 | 0 | 0 | 0 | 0 | 0 | 3 |
| 83316 | 3 | 0 | 0 | 0 | 0 | 0 | 0 | 0 | 0 | 3 |
| 83338 | 3 | 0 | 0 | 0 | 0 | 0 | 0 | 0 | 0 | 3 |
| 83434 | 3 | 0 | 0 | 0 | 0 | 0 | 0 | 0 | 0 | 3 |
| 83638 | 3 | 0 | 0 | 0 | 0 | 0 | 0 | 0 | 0 | 3 |
| 83639 | 3 | 0 | 0 | 0 | 0 | 0 | 0 | 0 | 0 | 3 |
| 83876 | 3 | 0 | 0 | 0 | 0 | 0 | 0 | 0 | 0 | 3 |
| 83226 | 2 | 0 | 1 | 0 | 0 | 0 | 0 | 0 | 0 | 3 |
| Zip Code | Ron Paul | Mitt Romney | Gary Johnson | Rick Santorum | Virgil Goode | Buddy Roemer | Newt Gingrich | Barack Obama | Other | Total |
| 83837 | 2 | 0 | 0 | 0 | 0 | 0 | 0 | 1 | 0 | 3 |
| 83220 | 1 | 2 | 0 | 0 | 0 | 0 | 0 | 0 | 0 | 3 |
| 83442 | 1 | 2 | 0 | 0 | 0 | 0 | 0 | 0 | 0 | 3 |
| 83241 | 0 | 3 | 0 | 0 | 0 | 0 | 0 | 0 | 0 | 3 |
| 83451 | 0 | 3 | 0 | 0 | 0 | 0 | 0 | 0 | 0 | 3 |
| 83619 | 0 | 3 | 0 | 0 | 0 | 0 | 0 | 0 | 0 | 3 |
| 83210 | 2 | 0 | 0 | 0 | 0 | 0 | 0 | 0 | 0 | 2 |
| 83229 | 2 | 0 | 0 | 0 | 0 | 0 | 0 | 0 | 0 | 2 |
| 83237 | 2 | 0 | 0 | 0 | 0 | 0 | 0 | 0 | 0 | 2 |
| 83278 | 2 | 0 | 0 | 0 | 0 | 0 | 0 | 0 | 0 | 2 |
| 83420 | 2 | 0 | 0 | 0 | 0 | 0 | 0 | 0 | 0 | 2 |
| 83546 | 2 | 0 | 0 | 0 | 0 | 0 | 0 | 0 | 0 | 2 |
| 83647 | 2 | 0 | 0 | 0 | 0 | 0 | 0 | 0 | 0 | 2 |
| 83846 | 2 | 0 | 0 | 0 | 0 | 0 | 0 | 0 | 0 | 2 |
| 83854 | 2 | 0 | 0 | 0 | 0 | 0 | 0 | 0 | 0 | 2 |
| 83864 | 2 | 0 | 0 | 0 | 0 | 0 | 0 | 0 | 0 | 2 |
| 83873 | 2 | 0 | 0 | 0 | 0 | 0 | 0 | 0 | 0 | 2 |
| 83211 | 1 | 1 | 0 | 0 | 0 | 0 | 0 | 0 | 0 | 2 |
| 83617 | 1 | 1 | 0 | 0 | 0 | 0 | 0 | 0 | 0 | 2 |
| 83223 | 0 | 2 | 0 | 0 | 0 | 0 | 0 | 0 | 0 | 2 |
| Zip Code | Ron Paul | Mitt Romney | Gary Johnson | Rick Santorum | Virgil Goode | Buddy Roemer | Newt Gingrich | Barack Obama | Other | Total |
| 83336 | 0 | 2 | 0 | 0 | 0 | 0 | 0 | 0 | 0 | 2 |
| 83213 | 1 | 0 | 0 | 0 | 0 | 0 | 0 | 0 | 0 | 1 |
| 83234 | 1 | 0 | 0 | 0 | 0 | 0 | 0 | 0 | 0 | 1 |
| 83261 | 1 | 0 | 0 | 0 | 0 | 0 | 0 | 0 | 0 | 1 |
| 83262 | 1 | 0 | 0 | 0 | 0 | 0 | 0 | 0 | 0 | 1 |
| 83281 | 1 | 0 | 0 | 0 | 0 | 0 | 0 | 0 | 0 | 1 |
| 83340 | 1 | 0 | 0 | 0 | 0 | 0 | 0 | 0 | 0 | 1 |
| 83452 | 1 | 0 | 0 | 0 | 0 | 0 | 0 | 0 | 0 | 1 |
| 83455 | 1 | 0 | 0 | 0 | 0 | 0 | 0 | 0 | 0 | 1 |
| 83460 | 1 | 0 | 0 | 0 | 0 | 0 | 0 | 0 | 0 | 1 |
| 83530 | 1 | 0 | 0 | 0 | 0 | 0 | 0 | 0 | 0 | 1 |
| 83549 | 1 | 0 | 0 | 0 | 0 | 0 | 0 | 0 | 0 | 1 |
| 83604 | 1 | 0 | 0 | 0 | 0 | 0 | 0 | 0 | 0 | 1 |
| 83611 | 1 | 0 | 0 | 0 | 0 | 0 | 0 | 0 | 0 | 1 |
| 83612 | 1 | 0 | 0 | 0 | 0 | 0 | 0 | 0 | 0 | 1 |
| 83628 | 1 | 0 | 0 | 0 | 0 | 0 | 0 | 0 | 0 | 1 |
| 83629 | 1 | 0 | 0 | 0 | 0 | 0 | 0 | 0 | 0 | 1 |
| 83631 | 1 | 0 | 0 | 0 | 0 | 0 | 0 | 0 | 0 | 1 |
| 83660 | 1 | 0 | 0 | 0 | 0 | 0 | 0 | 0 | 0 | 1 |
| 83676 | 1 | 0 | 0 | 0 | 0 | 0 | 0 | 0 | 0 | 1 |
| Zip Code | Ron Paul | Mitt Romney | Gary Johnson | Rick Santorum | Virgil Goode | Buddy Roemer | Newt Gingrich | Barack Obama | Other | Total |
| 83680 | 1 | 0 | 0 | 0 | 0 | 0 | 0 | 0 | 0 | 1 |
| 83707 | 1 | 0 | 0 | 0 | 0 | 0 | 0 | 0 | 0 | 1 |
| 83850 | 1 | 0 | 0 | 0 | 0 | 0 | 0 | 0 | 0 | 1 |
| 83857 | 1 | 0 | 0 | 0 | 0 | 0 | 0 | 0 | 0 | 1 |
| 83869 | 1 | 0 | 0 | 0 | 0 | 0 | 0 | 0 | 0 | 1 |
| 83870 | 1 | 0 | 0 | 0 | 0 | 0 | 0 | 0 | 0 | 1 |
| 83877 | 1 | 0 | 0 | 0 | 0 | 0 | 0 | 0 | 0 | 1 |
| 83335 | 0 | 0 | 0 | 1 | 0 | 0 | 0 | 0 | 0 | 1 |
| 83346 | 0 | 1 | 0 | 0 | 0 | 0 | 0 | 0 | 0 | 1 |
| 83427 | 0 | 1 | 0 | 0 | 0 | 0 | 0 | 0 | 0 | 1 |
| 83448 | 0 | 1 | 0 | 0 | 0 | 0 | 0 | 0 | 0 | 1 |
| 83462 | 0 | 1 | 0 | 0 | 0 | 0 | 0 | 0 | 0 | 1 |
| 83632 | 0 | 1 | 0 | 0 | 0 | 0 | 0 | 0 | 0 | 1 |
| Totals | 525 | 358 | 40 | 33 | 29 | 20 | 10 | 5 | 2 | 1022 |
City Totals
| City | Ron Paul | Mitt Romney | Gary Johnson | Rick Santorum | Virgil Goode | Buddy Roemer | Newt Gingrich | Barack Obama | Other | Total |
|---|---|---|---|---|---|---|---|---|---|---|
| 0 | 0 | 0 | 0 | 0 | 0 | 0 | 0 | 0 | 0 | 0 |
| 0 | 0 | 0 | 0 | 0 | 0 | 0 | 0 | 0 | 0 | 0 |
| 0 | 0 | 0 | 0 | 0 | 0 | 0 | 0 | 0 | 0 | 0 |
See also
- Republican Party (United States) presidential primaries, 2012
- Statewide opinion polling for the Republican Party (United States) presidential primaries, 2012
- Nationwide opinion polling for the United States presidential election, 2012
- Nationwide opinion polling for the Republican Party 2012 presidential primaries
- Statewide opinion polling for the United States presidential election, 2012
External links
References
- "2012 Republican Delegates". Real Clear Politics. Retrieved April 29, 2012.
- "Republican Convention". The Green Papers. Retrieved May 8, 2012.
- "Results: WMUR, ABC News, NH GOP 2012 Straw Poll". Politicalscoop.wmur.com. 2011-01-22. Archived from the original on 2012-08-25. Retrieved 2011-03-28.
- "PAC 2011 Straw Poll" (PDF). Retrieved 2011-09-25.
- Mapes, Jeff (March 6, 2011). "Indiana Gov. Mitch Daniels wins GOP presidential straw poll in Oregon". The Oregonian.
- "Political Cornflakes: Romney tops local officials poll | Out of Context | The Salt Lake Tribune". Sltrib.com. Retrieved 2011-03-28.
- "California straw poll" (PDF).
- "SC straw poll". CNN.
- "Barbour nabs straw poll victory in South Carolina". CNN.
- "Cain, Gingrich win west Ga. GOP straw poll".
- http://www.slate.com/blogs/weigel/2011/05/07/santorum_wins_straw_poll_huntsmania_comes_to_columbia_although_not_to_where_the_republicans_are.html
- Connelly, Joel (May 9, 2011). "Herman Cain wins GOP straw poll in Washington state". Seattle Post-Intelligencer.
- http://www.hawaiifreepress.com/ArticlesMain/tabid/56/articleType/ArticleView/articleId/4307/RESULTS-Cain-tops-Hawaii-GOP-Presidential-Straw-Poll.aspx
- Republican Leadership Conference Blog (June 18, 2011). "RLC 2011 Straw Poll Results". Retrieved 2011-09-25.
- http://www.politico.com/news/stories/0711/59456.html
- "Romney wins, Perry strong write-in at Ohio GOP straw poll". July 22, 2011. Retrieved 2011-09-25.
- "Herman Cain wins Western Conservative Summit Straw Poll; Rick Perry Second".
- http://www.delawarepolitics.net/bachmann-wins-delaware-gop-straw-poll/
- Bachmann wins Ames straw poll Archived 2011-11-13 at the Wayback Machine
- "Archived copy". Archived from the original on 2011-11-04. Retrieved 2011-09-19.CS1 maint: archived copy as title (link)
- Horowitz, Alana (2011-08-14). "Tim Pawlenty Quits: Former Governor Drops Out Of Presidential Race". Huffington Post. Retrieved 2011-08-14.
- Parker, Ashley (2011-08-13). "Promising Better Direction, Perry Enters Race". The New York Times. Retrieved 2011-08-14.
- "Romney to skip Iowa GOP, Florida straw polls". CBS News. 2011-06-09. Retrieved 2011-06-09.
- http://milwaukee.wisgop.info/2011/08/15/state-fair-straw-poll-results-entire-fair/
- Stucker, Kyle. "N.H. Primary Elections: Ron Paul Wins NH Straw Poll". Hampton - Northhampton Patch.
- Burns, Alexander (2011-08-27). "Georgia GOP votes for native son Herman Cain". Politico.
- "MDGOP Announces State Fair Presidential Straw Poll Results". Republican Party of Maryland. 2011-09-09. Retrieved 2011-11-06.
- http://www.wcpo.com/dpp/news/region_east_cincinnati/symmes_township/local-tea-party-featured-in-gop-debate
- http://www.politico.com/news/stories/0911/63730.html
- "Ron Paul wins California straw poll". September 17, 2011.
- Kevin Derby's blog (2011-03-08). "GOP 2012 Candidates Will Take Part in Florida Straw Poll". Sunshine State News. Retrieved 2011-03-28.CS1 maint: multiple names: authors list (link)
- "Herman Cain Wins Florida Straw Poll, Should Not Be Underestimated". Human Events. Retrieved 2011-09-27.
- Siegel, Elyse (September 24, 2011). "Herman Cain Wins Florida Straw Poll Ahead Of 2012". Huffington Post.
- "Michigan native Romney wins state GOP straw poll".
- Bohn, Kevin (25 September 2011). "Romney captures Michigan straw poll". CNN.
- "Cain Wins GOP Women Straw Poll". My Fox New York. 2 October 2011. Archived from the original on 3 October 2011.
- The Palladian View. "Straw Poll" (PDF). National Federation of Republican Women. Archived from the original (PDF) on 19 June 2013.
- "Herman Cain Wins TeaCon Midwest Straw Poll". Archived from the original on 2012-08-31.
- "Tea Party "Racists" cheer for Herman Cain".
- Sarata, Phil (13 October 2011), "Cain wins GOP straw poll at Orangeburg fair", The T&D
- Weigel, David, Ron Paul Wins Values Voter Straw Poll, Cain Takes Second, The Atlantic
- Herman Cain Tops Republican Presidential Straw Poll at Midwest Leadership Conference
- Acosta, Jim (15 October 2011), "Cain wins big in South Carolina tea party straw poll", CNN
- http://plainsdaily.com/entry/herman-cain-bette-grande-rick-berg-and-jack-dalrymple-win-nd-tea-party-straw-poll/
- Results of the Straw Poll
- Hill, Jarrod (7 November 2011), "YAL at Mississippi College Conducts Straw Poll", Young Americans for Liberty, archived from the original on 4 March 2016
- McLaughlin, Seth (21 October 2011), "Cain tops field again in Nevada GOP straw poll", Washington Times
- Lederman, Josh (21 October 2011), "Herman Cain wins straw poll in Nevada", The Hill
- Evans, Lauren (22 October 2011), "Ohio GOP Straw Poll Gives Ron Paul A Majority", NBC 4i, archived from the original on 24 June 2012
- Moseley, Alex (25 October 2011). "Herman Cain Wins Republican Presidential Straw Poll with 59%". Anderson County Republican Party. Archived from the original on 10 August 2012.
- "Ron Paul wins both tallies at GOP straw poll in Iowa – CNN Political Ticker". CNN.
- Pow, Chris (29 October 2011). "Herman Cain wins West Alabama Straw Poll after appearance in Tuscaloosa". AL.com.
- Pearson, Rick (5 November 2011). "Illinois GOP fundraising straw poll goes to Ron Paul". Chicago Tribune.
- Herman Cain Wins South Dakota Straw Poll; SDGOP Wants to Raise Your Taxes?
- Herman Cain wins South Dakota Straw Poll
- http://www.allvoices.com/contributed-news/10873364-ron-paul-wins-san-diego-straw-poll
- http://www.fultonsun.com/news/2011/nov/20/cain-wins-state-poll-tea-party-members/
- http://www.thecarolinapatriot.com/
- http://countygop.posterous.com/straw-poll-results
- http://www.thonline.com/news/tri-state/article_84983910-1c90-11e1-93d9-001a4bcf6878.html
- http://okgop.com/oklahoma-straw-poll-results/
- http://www.nooga.com/25951_newt-gingrich-wins-hamilton-county-young-republicans-straw-poll/
- "Drake University Straw Poll Results; Oskaloosa News". oskynews.org. Retrieved 2011-12-11.
- "Drake University Straw Poll Results; Drake Student Senate". facebook.com. Retrieved 2011-12-11.
- http://www2.tbo.com/news/pasco-news/2011/dec/14/menewso3-fervent-followers-lift-paul-to-straw-poll-ar-334587/
- http://ankeny.patch.com/articles/wins-cedar-falls-tea-party-straw-poll
- http://www.idahostrawpoll.com/poll/graph1.html
- http://www.kivitv.com/news/local/136861878.html
- http://www.allvoices.com/contributed-news/11299471-ron-paul-wins-2-texas-straw-polls-one-by-over-50
- http://www.ctgop.org/2012/01/romney-wins-ct-gop-straw-poll/
- http://strawpoll.azgop.org/results/results-january-28-2012/
- http://www.idahostrawpoll.com/poll/graph2.html
- http://cpac2012.conservative.org/romney-wins-cpac-straw-poll/1200/
- "Romney wins CPAC presidential straw poll". Fox News. February 11, 2012.
- http://www.washingtontimes.com/news/2012/feb/11/romney-wins-washington-timescpac-straw-poll/
- http://www.ricksantorum.com/pressrelease/icymi-santorum-wins-suburban-atlanta-straw-poll-advance-georgia-visit
- http://www.idahostrawpoll.com/poll/graph3.html