Venelles
Venelles (French pronunciation: [vənɛl]; Occitan: Venèla) is a commune in the Bouches-du-Rhône department in southern France near Aix-en-Provence.
Venelles | |
|---|---|
.JPG.webp) The bell tower of the church of Venelles | |
.svg.png.webp) Coat of arms | |
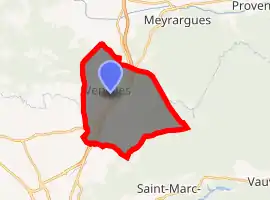
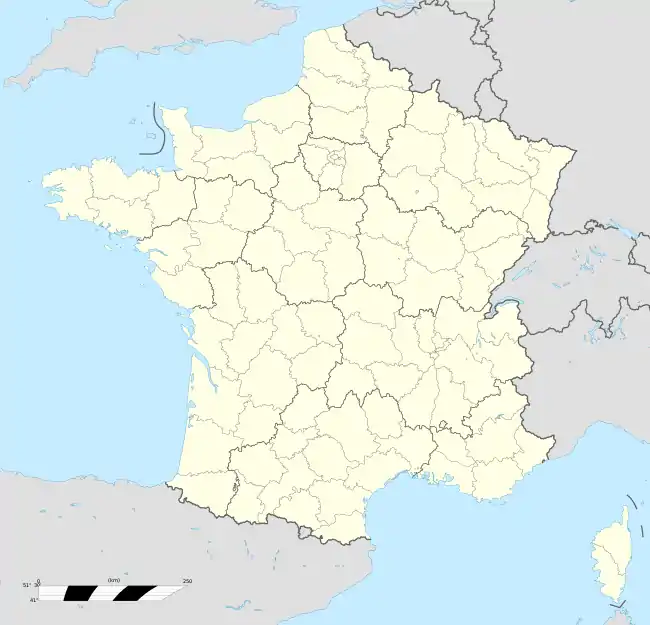
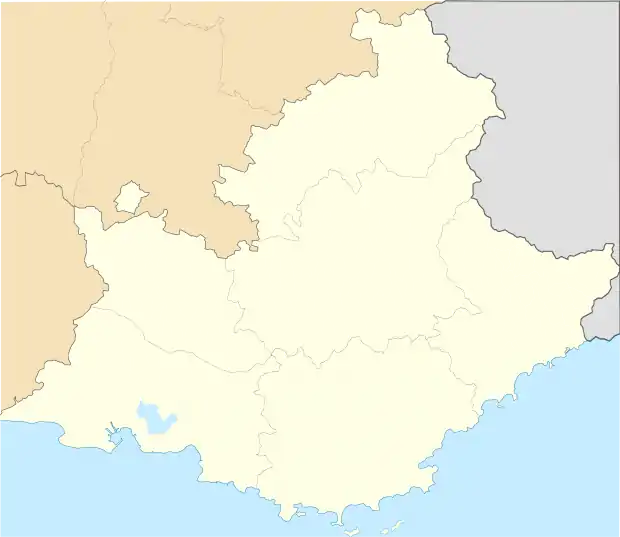
Location of Venelles 
| |
 Venelles  Venelles | |
| Coordinates: 43°35′57″N 5°29′00″E | |
| Country | France |
| Region | Provence-Alpes-Côte d'Azur |
| Department | Bouches-du-Rhône |
| Arrondissement | Aix-en-Provence |
| Canton | Trets |
| Intercommunality | Aix-Marseille-Provence |
| Government | |
| • Mayor (2020–2026) | Arnaud Mercier |
| Area 1 | 20.54 km2 (7.93 sq mi) |
| Population (2017-01-01)[1] | 8,383 |
| • Density | 410/km2 (1,100/sq mi) |
| Time zone | UTC+01:00 (CET) |
| • Summer (DST) | UTC+02:00 (CEST) |
| INSEE/Postal code | 13113 /13770 |
| Elevation | 254–442 m (833–1,450 ft) (avg. 409 m or 1,342 ft) |
| 1 French Land Register data, which excludes lakes, ponds, glaciers > 1 km2 (0.386 sq mi or 247 acres) and river estuaries. | |
History
In 15 BC, there was a Roman settlement there. It was then destroyed by the Lombards in 574 AD, and again in the 11th century by the Saracens.
In the 15th century, the land was finally re-settled.
In 1530 there were seven houses, by 1728 there were 30, in 1765 there were 124 and in 1820 there were 211.
In 1865 a railway was built, followed by a school in 1882.
On 11 June 1909, an earthquake destroyed many houses.
Population
| Year | Pop. | ±% |
|---|---|---|
| 1793 | 796 | — |
| 1800 | 722 | −9.3% |
| 1806 | 800 | +10.8% |
| 1821 | 833 | +4.1% |
| 1831 | 828 | −0.6% |
| 1836 | 740 | −10.6% |
| 1841 | 716 | −3.2% |
| 1846 | 659 | −8.0% |
| 1851 | 753 | +14.3% |
| 1856 | 698 | −7.3% |
| 1861 | 740 | +6.0% |
| 1866 | 709 | −4.2% |
| 1872 | 680 | −4.1% |
| 1876 | 676 | −0.6% |
| 1881 | 612 | −9.5% |
| 1886 | 600 | −2.0% |
| 1891 | 538 | −10.3% |
| 1896 | 539 | +0.2% |
| 1901 | 519 | −3.7% |
| 1906 | 506 | −2.5% |
| 1911 | 511 | +1.0% |
| 1921 | 467 | −8.6% |
| 1926 | 514 | +10.1% |
| 1931 | 512 | −0.4% |
| 1936 | 447 | −12.7% |
| 1946 | 452 | +1.1% |
| 1954 | 531 | +17.5% |
| 1962 | 623 | +17.3% |
| 1968 | 1,553 | +149.3% |
| 1975 | 2,672 | +72.1% |
| 1982 | 5,225 | +95.5% |
| 1990 | 7,046 | +34.9% |
| 1999 | 7,535 | +6.9% |
| 2008 | 8,100 | +7.5% |
References
Citations
- "Populations légales 2017". INSEE. Retrieved 6 January 2020.
This article is issued from Wikipedia. The text is licensed under Creative Commons - Attribution - Sharealike. Additional terms may apply for the media files.