1944 United States presidential election in Mississippi
The 1944 United States presidential election in Mississippi took place on November 7, 1944, as part of the 1944 United States presidential election. Mississippi voters chose nine[2] representatives, or electors, to the Electoral College, who voted for president and vice president.
| ||||||||||||||||||||||||||
All 9 Mississippi votes to the Electoral College | ||||||||||||||||||||||||||
|---|---|---|---|---|---|---|---|---|---|---|---|---|---|---|---|---|---|---|---|---|---|---|---|---|---|---|
| ||||||||||||||||||||||||||
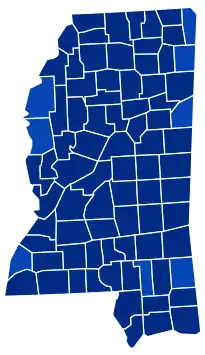 County Results
Roosevelt 80-90% 90-100%
| ||||||||||||||||||||||||||
| ||||||||||||||||||||||||||
(small).jpg.webp)
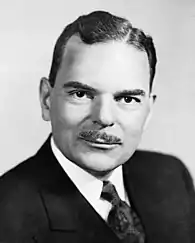
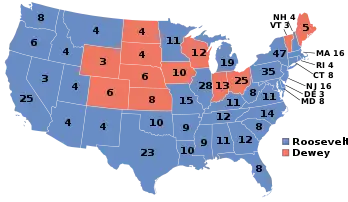
Mississippi was won by incumbent President Franklin D. Roosevelt (D–New York), running with Senator Harry S. Truman, with 93.56% of the popular vote, against Governor Thomas E. Dewey (R–New York), running with Governor John Bricker, with 6.44% of the popular vote.[3][4]
This marks the last time any candidate has received over ninety percent of the popular vote in any state.[lower-alpha 1] As of the 2020 presidential election, this is also the last occasion Forrest County has voted for a Democratic presidential candidate.[5]
Results
| Party | Candidate | Votes | % | |
|---|---|---|---|---|
| Democratic | Franklin D. Roosevelt (inc.) | 168,479 | 93.56% | |
| Republican | Thomas E. Dewey | 11,601 | 6.44% | |
| Total votes | 180,080 | 100% | ||
Results by county
| Franklin Delano Roosevelt Democratic |
Thomas Edmund Dewey Republican |
Margin | Total votes cast[6] | ||||
|---|---|---|---|---|---|---|---|
| County | # | % | # | % | # | % | # |
| Adams | 1,638 | 85.31% | 282 | 14.69% | 1,356 | 70.63% | 1,920 |
| Alcorn | 2,669 | 92.83% | 206 | 7.17% | 2,463 | 85.67% | 2,875 |
| Amite | 1,426 | 94.25% | 87 | 5.75% | 1,339 | 88.50% | 1,513 |
| Attala | 2,187 | 96.17% | 87 | 3.83% | 2,100 | 92.35% | 2,274 |
| Benton | 852 | 95.30% | 42 | 4.70% | 810 | 90.60% | 894 |
| Bolivar | 2,444 | 86.61% | 378 | 13.39% | 2,066 | 73.21% | 2,822 |
| Calhoun | 2,072 | 95.53% | 97 | 4.47% | 1,975 | 91.06% | 2,169 |
| Carroll | 1,438 | 95.48% | 68 | 4.52% | 1,370 | 90.97% | 1,506 |
| Chickasaw | 1,935 | 91.49% | 180 | 8.51% | 1,755 | 82.98% | 2,115 |
| Choctaw | 1,119 | 93.64% | 76 | 6.36% | 1,043 | 87.28% | 1,195 |
| Claiborne | 710 | 94.04% | 45 | 5.96% | 665 | 88.08% | 755 |
| Clarke | 1,694 | 94.69% | 95 | 5.31% | 1,599 | 89.38% | 1,789 |
| Clay | 1,158 | 91.40% | 109 | 8.60% | 1,049 | 82.79% | 1,267 |
| Coahoma | 2,392 | 92.61% | 191 | 7.39% | 2,201 | 85.21% | 2,583 |
| Copiah | 2,409 | 96.59% | 85 | 3.41% | 2,324 | 93.18% | 2,494 |
| Covington | 1,672 | 96.65% | 58 | 3.35% | 1,614 | 93.29% | 1,730 |
| DeSoto | 1,561 | 92.70% | 123 | 7.30% | 1,438 | 85.39% | 1,684 |
| Forrest | 3,649 | 89.33% | 436 | 10.67% | 3,213 | 78.65% | 4,085 |
| Franklin | 1,211 | 96.11% | 49 | 3.89% | 1,162 | 92.22% | 1,260 |
| George | 1,051 | 91.95% | 92 | 8.05% | 959 | 83.90% | 1,143 |
| Greene | 907 | 89.27% | 109 | 10.73% | 798 | 78.54% | 1,016 |
| Grenada | 1,373 | 92.15% | 117 | 7.85% | 1,256 | 84.30% | 1,490 |
| Hancock | 1,642 | 92.30% | 137 | 7.70% | 1,505 | 84.60% | 1,779 |
| Harrison | 5,976 | 90.57% | 622 | 9.43% | 5,354 | 81.15% | 6,598 |
| Hinds | 10,466 | 91.58% | 962 | 8.42% | 9,504 | 83.16% | 11,428 |
| Holmes | 1,954 | 94.12% | 122 | 5.88% | 1,832 | 88.25% | 2,076 |
| Humphreys | 1,150 | 97.05% | 35 | 2.95% | 1,115 | 94.09% | 1,185 |
| Issaquena | 215 | 97.73% | 5 | 2.27% | 210 | 95.45% | 220 |
| Itawamba | 1,350 | 88.06% | 183 | 11.94% | 1,167 | 76.13% | 1,533 |
| Jackson | 2,636 | 92.52% | 213 | 7.48% | 2,423 | 85.05% | 2,849 |
| Jasper | 1,667 | 97.26% | 47 | 2.74% | 1,620 | 94.52% | 1,714 |
| Jefferson | 766 | 96.84% | 25 | 3.16% | 741 | 93.68% | 791 |
| Jefferson Davis | 1,372 | 93.97% | 88 | 6.03% | 1,284 | 87.95% | 1,460 |
| Jones | 4,782 | 93.42% | 337 | 6.58% | 4,445 | 86.83% | 5,119 |
| Kemper | 1,345 | 97.32% | 37 | 2.68% | 1,308 | 94.65% | 1,382 |
| Lafayette | 2,148 | 96.11% | 87 | 3.89% | 2,061 | 92.21% | 2,235 |
| Lamar | 1,065 | 91.97% | 93 | 8.03% | 972 | 83.94% | 1,158 |
| Lauderdale | 6,036 | 94.09% | 379 | 5.91% | 5,657 | 88.18% | 6,415 |
| Lawrence | 1,535 | 97.15% | 45 | 2.85% | 1,490 | 94.30% | 1,580 |
| Leake | 2,800 | 99.15% | 24 | 0.85% | 2,776 | 98.30% | 2,824 |
| Lee | 3,509 | 93.85% | 230 | 6.15% | 3,279 | 87.70% | 3,739 |
| Leflore | 2,399 | 92.30% | 200 | 7.70% | 2,199 | 84.61% | 2,599 |
| Lincoln | 2,445 | 95.96% | 103 | 4.04% | 2,342 | 91.92% | 2,548 |
| Lowndes | 2,216 | 86.02% | 360 | 13.98% | 1,856 | 72.05% | 2,576 |
| Madison | 1,921 | 94.86% | 104 | 5.14% | 1,817 | 89.73% | 2,025 |
| Marion | 2,441 | 97.84% | 54 | 2.16% | 2,387 | 95.67% | 2,495 |
| Marshall | 1,441 | 95.81% | 63 | 4.19% | 1,378 | 91.62% | 1,504 |
| Monroe | 3,104 | 95.13% | 159 | 4.87% | 2,945 | 90.25% | 3,263 |
| Montgomery | 1,371 | 94.88% | 74 | 5.12% | 1,297 | 89.76% | 1,445 |
| Neshoba | 3,025 | 95.85% | 131 | 4.15% | 2,894 | 91.70% | 3,156 |
| Newton | 2,516 | 97.82% | 56 | 2.18% | 2,460 | 95.65% | 2,572 |
| Noxubee | 994 | 90.61% | 103 | 9.39% | 891 | 81.22% | 1,097 |
| Oktibbeha | 1,948 | 94.66% | 110 | 5.34% | 1,838 | 89.31% | 2,058 |
| Panola | 1,931 | 95.55% | 90 | 4.45% | 1,841 | 91.09% | 2,021 |
| Pearl River | 2,131 | 96.21% | 84 | 3.79% | 2,047 | 92.42% | 2,215 |
| Perry | 796 | 94.76% | 44 | 5.24% | 752 | 89.52% | 840 |
| Pike | 2,972 | 92.30% | 248 | 7.70% | 2,724 | 84.60% | 3,220 |
| Pontotoc | 1,716 | 95.17% | 87 | 4.83% | 1,629 | 90.35% | 1,803 |
| Prentiss | 1,652 | 90.42% | 175 | 9.58% | 1,477 | 80.84% | 1,827 |
| Quitman | 1,106 | 94.94% | 59 | 5.06% | 1,047 | 89.87% | 1,165 |
| Rankin | 2,374 | 96.04% | 98 | 3.96% | 2,276 | 92.07% | 2,472 |
| Scott | 2,165 | 97.30% | 60 | 2.70% | 2,105 | 94.61% | 2,225 |
| Sharkey | 698 | 96.68% | 24 | 3.32% | 674 | 93.35% | 722 |
| Simpson | 2,470 | 96.94% | 78 | 3.06% | 2,392 | 93.88% | 2,548 |
| Smith | 2,456 | 93.70% | 165 | 6.30% | 2,291 | 87.41% | 2,621 |
| Stone | 989 | 95.83% | 43 | 4.17% | 946 | 91.67% | 1,032 |
| Sunflower | 2,799 | 94.75% | 155 | 5.25% | 2,644 | 89.51% | 2,954 |
| Tallahatchie | 2,401 | 98.36% | 40 | 1.64% | 2,361 | 96.72% | 2,441 |
| Tate | 1,455 | 98.05% | 29 | 1.95% | 1,426 | 96.09% | 1,484 |
| Tippah | 2,539 | 95.27% | 126 | 4.73% | 2,413 | 90.54% | 2,665 |
| Tishomingo | 1,412 | 82.67% | 296 | 17.33% | 1,116 | 65.34% | 1,708 |
| Tunica | 721 | 95.37% | 35 | 4.63% | 686 | 90.74% | 756 |
| Union | 2,140 | 92.12% | 183 | 7.88% | 1,957 | 84.24% | 2,323 |
| Walthall | 1,230 | 94.76% | 68 | 5.24% | 1,162 | 89.52% | 1,298 |
| Warren | 3,202 | 91.33% | 304 | 8.67% | 2,898 | 82.66% | 3,506 |
| Washington | 2,012 | 81.59% | 454 | 18.41% | 1,558 | 63.18% | 2,466 |
| Wayne | 1,380 | 97.53% | 35 | 2.47% | 1,345 | 95.05% | 1,415 |
| Webster | 1,504 | 92.21% | 127 | 7.79% | 1,377 | 84.43% | 1,631 |
| Wilkinson | 863 | 91.52% | 80 | 8.48% | 783 | 83.03% | 943 |
| Winston | 1,822 | 97.28% | 51 | 2.72% | 1,771 | 94.55% | 1,873 |
| Yalobusha | 1,582 | 94.22% | 97 | 5.78% | 1,485 | 88.45% | 1,679 |
| Yazoo | 2,301 | 96.72% | 78 | 3.28% | 2,223 | 93.44% | 2,379 |
| Totals | 168,621 | 93.56% | 11,613 | 6.44% | 157,008 | 87.11% | 180,234 |
Notes
References
- "United States Presidential election of 1944 - Encyclopædia Britannica". Retrieved July 19, 2018.
- "1944 Election for the Fortieth Term (1945-49)". Retrieved July 19, 2018.
- "1944 Presidential General Election Results - Mississippi". Retrieved July 19, 2018.
- "The American Presidency Project - Election of 1944". Retrieved July 19, 2018.
- Sullivan, Robert David; ‘How the Red and Blue Map Evolved Over the Past Century’; America Magazine in The National Catholic Review; June 29, 2016
- Scammon, Richard M. (compiler); America at the Polls: A Handbook of Presidential Election Statistics 1920-1964; pp. 249-250 ISBN 0405077114
| |
|