1952 United States presidential election in New Jersey
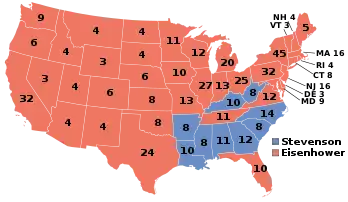
The 1952 United States presidential election in New Jersey took place on November 4, 1952. All contemporary 48 states were part of the 1952 United States presidential election. Voters chose 16 electors to the Electoral College, which selected the president and vice president.
| ||||||||||||||||||||||||||
| ||||||||||||||||||||||||||
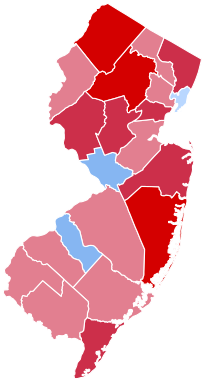 County Results
| ||||||||||||||||||||||||||
| ||||||||||||||||||||||||||
| Elections in New Jersey |
|---|
 |
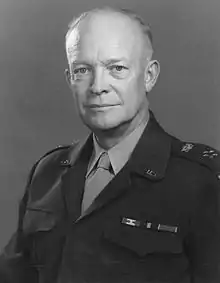
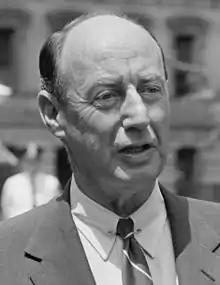
New Jersey was won by the Republican nominees, General Dwight D. Eisenhower of New York and his running mate Senator Richard Nixon of California. Eisenhower and Nixon defeated the Democratic nominees, former Governor Adlai Stevenson of Illinois and his running mate Senator John Sparkman of Alabama.
Eisenhower carried New Jersey with 56.81% of the vote to Stevenson's 41.99%, a margin of 14.83%.[2]
Eisenhower won 18 of the state's 21 counties, breaking 60% of the vote in 9 of them, and even breaking 70% in 3 of those. Stevenson for his part carried 3 urban counties; he won with majorities in Mercer County and Camden County, and won with a plurality in Hudson County.
Eisenhower ultimately won election to the White House in 1952 as a war hero, a political outsider, and a moderate Republican who pledged to protect and support popular New Deal Democratic policies, finally ending 20 years of Democratic control of the White House.
New Jersey in this era was usually a swing state with a slight Republican lean, and its results in 1952 adhered to that pattern. Democrat Franklin Roosevelt had won New Jersey in all 4 of his decisive nationwide victories in the 1930s and 1940s, but with the exception of his 1936 landslide, always by very narrow margins. In 1948, New Jersey had been narrowly won by Republican Thomas E. Dewey, even as he lost the election nationally. With Eisenhower's personal popularity propelling him to a decisive nationwide victory in 1952, New Jersey easily remained in the Republican column, its results making it about 4% more Republican than the national average.
Results
| 1952 United States presidential election in New Jersey | |||||
|---|---|---|---|---|---|
| Party | Candidate | Votes | Percentage | Electoral votes | |
| Republican | Dwight D. Eisenhower | 1,374,613 | 56.81% | 16 | |
| Democratic | Adlai Stevenson | 1,015,902 | 41.99% | 0 | |
| Socialist | Darlington Hoopes | 8,593 | 0.36% | 0 | |
| Socialist Labor | Eric Hass | 5,815 | 0.24% | 0 | |
| Progressive | Vincent Hallinan | 5,589 | 0.23% | 0 | |
| Poor Man's Party | Henry B. Krajewski | 4,203 | 0.17% | 0 | |
| Socialist Workers | Farrell Dobbs | 3,850 | 0.16% | 0 | |
| Prohibition | Stuart Hamblen | 989 | 0.04% | 0 | |
| Totals | 2,419,554 | 100.0% | 16 | ||
Results by county
| County | Dwight David Eisenhower Republican |
Adlai Stevenson II Democratic |
Various candidates Other parties |
Margin | Total votes cast[3] | ||||
|---|---|---|---|---|---|---|---|---|---|
| # | % | # | % | # | % | # | % | ||
| Atlantic | 40,259 | 58.03% | 28,953 | 41.73% | 163 | 0.23% | 11,306 | 16.30% | 69,375 |
| Bergen | 212,842 | 69.22% | 93,373 | 30.37% | 1,287 | 0.42% | 119,469 | 38.85% | 307,502 |
| Burlington | 30,202 | 54.18% | 25,482 | 45.71% | 60 | 0.11% | 4,720 | 8.47% | 55,744 |
| Camden | 72,335 | 46.81% | 81,444 | 52.70% | 762 | 0.49% | -9,109 | -5.89% | 154,541 |
| Cape May | 15,218 | 68.52% | 6,984 | 31.45% | 7 | 0.03% | 8,234 | 37.08% | 22,209 |
| Cumberland | 21,819 | 53.40% | 18,929 | 46.33% | 111 | 0.27% | 2,890 | 7.07% | 40,859 |
| Essex | 219,863 | 53.94% | 180,501 | 44.28% | 7,271 | 1.78% | 39,362 | 9.66% | 407,635 |
| Gloucester | 25,103 | 54.89% | 20,536 | 44.90% | 98 | 0.21% | 4,567 | 9.99% | 45,737 |
| Hudson | 153,583 | 47.36% | 161,469 | 49.79% | 9,228 | 2.85% | -7,886 | -2.43% | 324,280 |
| Hunterdon | 14,439 | 67.47% | 6,878 | 32.14% | 83 | 0.39% | 7,561 | 35.33% | 21,400 |
| Mercer | 50,423 | 46.40% | 57,751 | 53.15% | 488 | 0.45% | -7,328 | -6.74% | 108,662 |
| Middlesex | 73,577 | 50.32% | 70,234 | 48.03% | 2,413 | 1.65% | 3,343 | 2.29% | 146,224 |
| Monmouth | 73,228 | 66.28% | 37,006 | 33.49% | 257 | 0.23% | 36,222 | 32.78% | 110,491 |
| Morris | 62,847 | 72.55% | 23,662 | 27.31% | 120 | 0.14% | 39,185 | 45.23% | 86,629 |
| Ocean | 23,490 | 72.80% | 8,660 | 26.84% | 117 | 0.36% | 14,830 | 45.96% | 32,267 |
| Passaic | 89,083 | 54.26% | 70,727 | 43.08% | 4,380 | 2.67% | 18,356 | 11.18% | 164,190 |
| Salem | 12,026 | 51.30% | 11,362 | 48.47% | 54 | 0.23% | 664 | 2.83% | 23,442 |
| Somerset | 31,239 | 63.34% | 18,007 | 36.51% | 74 | 0.15% | 13,232 | 26.83% | 49,320 |
| Sussex | 13,415 | 74.68% | 4,534 | 25.24% | 14 | 0.08% | 8,881 | 49.44% | 17,963 |
| Union | 122,885 | 60.46% | 78,336 | 38.54% | 2,024 | 1.00% | 44,549 | 21.92% | 203,245 |
| Warren | 15,737 | 58.63% | 11,074 | 41.26% | 28 | 0.10% | 4,663 | 17.37% | 26,839 |
| Totals | 1,373,613 | 56.79% | 1,015,902 | 42.00% | 24,372 | 1.20% | 29,039 | 14.79% | 2,418,554 |
References
- "U.S. presidential election, 1952". Facts on File. Archived from the original on October 29, 2013. Retrieved October 24, 2013.
Eisenhower, born in Texas, considered a resident of New York, and headquartered at the time in Paris, finally decided to run for the Republican nomination
- "1952 Presidential General Election Results - New Jersey". Dave Leip's Atlas of U.S. Presidential Elections. Retrieved 28 November 2013.
- Scammon, Richard M. (compiler); America at the Polls: A Handbook of Presidential Election Statistics 1920-1964; p. 300 ISBN 0405077114
