2016 United States presidential election in New Jersey
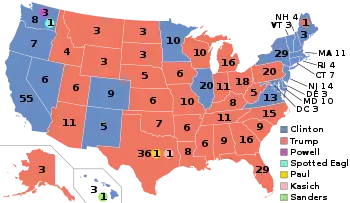
The 2016 United States presidential election in New Jersey was held on Tuesday, November 8, 2016, as part of the 2016 United States presidential election in which all 50 states plus the District of Columbia participated. New Jersey voters chose electors to represent them in the Electoral College via a popular vote, pitting the Republican Party's nominee, businessman Donald Trump, and running mate Indiana Governor Mike Pence against Democratic Party nominee, former Secretary of State Hillary Clinton, and her running mate Virginia Senator Tim Kaine. New Jersey has 14 electoral votes in the Electoral College.[1]
| ||||||||||||||||||||||||||
| Turnout | 68% | |||||||||||||||||||||||||
|---|---|---|---|---|---|---|---|---|---|---|---|---|---|---|---|---|---|---|---|---|---|---|---|---|---|---|
| ||||||||||||||||||||||||||
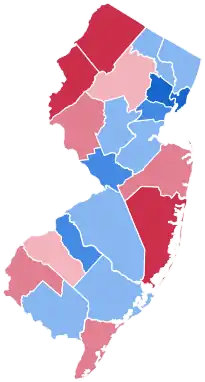 County Results
| ||||||||||||||||||||||||||
| ||||||||||||||||||||||||||

.jpg.webp)

| Elections in New Jersey |
|---|
 |
Clinton won the state with 55.5% of the vote over Trump's 41.35%, or a 14-point margin. Despite her victory in the state, Clinton's vote share was slightly poorer than the vote shares President Barack Obama got from the state in 2008 and 2012.
Primary elections
New Jersey's presidential primaries were on June 7, 2016, with the Democratic, Republican, and Libertarian parties participating.[2] Registered members of each party could only vote in their party's primary, while voters who were unaffiliated could choose any 1 primary in which to vote.
Democratic primary
Two candidates appeared on the Democratic presidential primary ballot:[3]
| New Jersey Democratic primary, June 7, 2016 | |||||
|---|---|---|---|---|---|
| Candidate | Popular vote | Estimated delegates | |||
| Count | Percentage | Pledged | Unpledged | Total | |
| Hillary Clinton | 566,247 | 63.32% | 79 | 12 | 91 |
| Bernie Sanders | 328,058 | 36.68% | 47 | 2 | 49 |
| Uncommitted | N/A | 0 | 0 | 0 | |
| Total | 894,305 | 100% | 126 | 16 | 142 |
| Source: The Green Papers, New Jersey Democratic Primary Official Results - New Jersey Department of State | |||||
Republican primary
3 candidates appeared on the Republican presidential primary ballot:[3]
- Ted Cruz (withdrawn prior to primary)
- John Kasich (withdrawn prior to primary)
- Donald Trump
| New Jersey Republican primary, June 7, 2016 | |||||
|---|---|---|---|---|---|
| Candidate | Votes | Percentage | Actual delegate count | ||
| Bound | Unbound | Total | |||
| Donald Trump | 360,212 | 80.41% | 51 | 0 | 51 |
| John Kasich (withdrawn) | 59,866 | 13.36% | 0 | 0 | 0 |
| Ted Cruz (withdrawn) | 27,874 | 6.22% | 0 | 0 | 0 |
| Unprojected delegates: | 0 | 0 | 0 | ||
| Total: | 447,952 | 100.00% | 51 | 0 | 51 |
| Source: The Green Papers | |||||
General election
Predictions
| Source | Ranking | As of |
|---|---|---|
| Los Angeles Times[4] | Safe D | November 6, 2016 |
| CNN[5] | Safe D | November 4, 2016 |
| Cook Political Report[6] | Safe D | November 7, 2016 |
| Electoral-vote.com[7] | Safe D | November 8, 2016 |
| Sabato's Crystal Ball[8] | Safe D | November 7, 2016 |
| Fox News[9] | Safe D | November 7, 2016 |
Candidate ballot access:[10]
- Hillary Clinton/Tim Kaine, Democratic
- Donald Trump/Mike Pence, Republican
- Darrell Castle/Scott Bradley, Constitution
- Rocky De La Fuente/Michael Steinberg, American Delta Party
- Gary Johnson/Bill Weld, Libertarian
- Alyson Kennedy/Osborne Hart, Socialist Workers Party
- Gloria La Riva/Eugene Puryear, Socialism and Liberation
- Monica Moorehead/Lamont Lilly, Workers World Party
- Jill Stein/Ajamu Baraka, Green Party
Results

-Blue municipalities won by Clinton
-Red municipalities won by Trump
-Purple municipality, Clinton and Trump tied (Teterboro only)
| Party | Candidate | Votes | % | ±% | |
|---|---|---|---|---|---|
| Democratic | Hillary Clinton | 2,148,278 | 55.45% | ||
| Republican | Donald Trump | 1,601,933 | 41.35% | ||
| Libertarian | Gary Johnson | 72,477 | 1.87% | ||
| Green | Jill Stein | 37,772 | 0.98% | ||
| Constitution | Darrell Castle | 6,161 | 0.16% | ||
| Socialist Workers | Alyson Kennedy | 2,156 | 0.06% | ||
| American Delta Party | Rocky De La Fuente | 1,838 | 0.05% | ||
| Workers World | Monica Moorehead | 1,749 | 0.05% | ||
| Socialism and Liberation | Gloria La Riva | 1,682 | 0.04% | ||
| Majority | 546,345 | 14.10% | |||
| Turnout | 3,874,046 | ||||
Results by county
| County | Clinton votes | Clinton % | Trump votes | Trump % | Other votes | Other % |
|---|---|---|---|---|---|---|
| Atlantic | 60,924 | 51.61% | 52,690 | 44.64% | 4,427 | 3.75% |
| Bergen | 231,211 | 54.76% | 175,529 | 41.57% | 15,473 | 3.66% |
| Burlington | 121,725 | 55.01% | 89,272 | 40.34% | 10,286 | 4.65% |
| Camden | 146,717 | 64.06% | 72,631 | 31.71% | 9,699 | 4.23% |
| Cape May | 18,750 | 38.07% | 28,446 | 57.75% | 2,061 | 4.18% |
| Cumberland | 27,771 | 51.11% | 24,453 | 45.01% | 2,107 | 3.88% |
| Essex | 240,837 | 76.97% | 63,176 | 20.19% | 8,871 | 2.84% |
| Gloucester | 66,870 | 47.34% | 67,544 | 47.82% | 6,840 | 4.84% |
| Hudson | 163,917 | 74.32% | 49,043 | 22.24% | 7,582 | 3.44% |
| Hunterdon | 28,898 | 40.33% | 38,712 | 54.02% | 4,050 | 5.65% |
| Mercer | 104,775 | 66.29% | 46,193 | 29.23% | 7,090 | 4.49% |
| Middlesex | 193,044 | 58.76% | 122,953 | 37.42% | 12,560 | 3.82% |
| Monmouth | 137,181 | 43.17% | 166,723 | 52.47% | 13,846 | 4.36% |
| Morris | 115,249 | 45.46% | 126,071 | 49.72% | 12,217 | 4.82% |
| Ocean | 87,150 | 31.49% | 179,079 | 64.71% | 10,496 | 3.79% |
| Passaic | 116,759 | 59.50% | 72,902 | 37.15% | 6,567 | 3.35% |
| Salem | 11,904 | 39.88% | 16,381 | 54.87% | 1,568 | 5.25% |
| Somerset | 85,689 | 54.08% | 65,505 | 41.34% | 7,251 | 4.58% |
| Sussex | 24,212 | 32.21% | 46,658 | 62.08% | 4,288 | 5.71% |
| Union | 147,414 | 65.94% | 68,114 | 30.47% | 8,042 | 3.60% |
| Warren | 17,281 | 34.78% | 29,858 | 60.10% | 2,097 | 5.12% |
Counties that flipped from Democratic to Republican
- Gloucester (largest municipality: Washington Township)
- Salem (largest city: Salem)
By congressional district
Clinton won 7 of 12 congressional districts.[13]
| District | Clinton | Trump | Representative |
|---|---|---|---|
| 1st | 60.6% | 36.1% | Donald Norcross |
| 2nd | 46.0% | 50.6% | Frank LoBiondo |
| 3rd | 45.2% | 51.4% | Tom MacArthur |
| 4th | 41.0% | 55.8% | Chris Smith |
| 5th | 47.7% | 48.8% | Scott Garrett |
| Josh Gottheimer | |||
| 6th | 56.2% | 40.6% | Frank Pallone, Jr. |
| 7th | 48.6% | 47.5% | Leonard Lance |
| 8th | 75.7% | 21.5% | Albio Sires |
| 9th | 64.3% | 33.1% | Bill Pascrell |
| 10th | 85.2% | 12.8% | Donald M. Payne Jr. |
| 11th | 47.9% | 48.8% | Rodney Frelinghuysen |
| 12th | 65.0% | 31.8% | Bonnie Watson Coleman |
Analysis
Hillary Clinton's 55.5% of the vote was 2.9% less than Barack Obama's win in the state in 2012. This was the first time since 1976 that New Jersey did not vote for the same candidate as neighboring Pennsylvania. Donald Trump became the first Republican to win Gloucester County since George H. W. Bush in 1988.
Overall, the trend from 2012 to 2016 was that suburban areas of central and northern New Jersey voted more Democratic, while the shore and southern New Jersey voted more Republican.
Clinton's most notable improvements over Obama in 2012 were seen in Union, Somerset, and Morris County. In Morris, Clinton came within 5% of winning the county, which has not voted for a Democratic presidential candidate since 1964. Clinton's stronger performance in the suburban towns of north-central New Jersey, such as Summit, Westfield, and Bridgewater, helped her narrowly win the 7th congressional district.
On the other hand, southern New Jersey, especially Cumberland County and Salem County, voted significantly more Republican than they had in 2012. For example, even though Cumberland County voted Democratic in both 2012 and 2016, Clinton won it by just 6%, whereas Obama had won it by nearly 24% in 2012. Additionally, the four shore counties (Monmouth, Ocean, Atlantic, and Cape May) all voted more Republican than they had in 2012. While Romney had won these four counties collectively by around 6% in 2012, Trump won them by 17% in 2016.
See also
References
- "Distribution of Electoral Votes". National Archives and Records Administration. Retrieved December 14, 2020.
- Green papers for 2016 primaries (D) (R). Retrieved 2016-04-05.
- "Official List / Candidates for President / For PRIMARY ELECTION 06/07/2016 Election" (PDF). NJ.gov. April 14, 2016. Retrieved 2017-11-04.
- "Our final map has Clinton winning with 352 electoral votes. Compare your picks with ours". Los Angeles Times. 2016-11-06. Retrieved 2016-11-13.
- Chalian, David (November 4, 2016). "Road to 270: CNN's new election map". CNN. Retrieved March 3, 2019.
- "2016 Electoral Scorecard". The Cook Political Report. November 7, 2016. Retrieved March 3, 2019.
- "2016 Electoral Map Prediction". Electoral-vote.com. November 8, 2016. Retrieved March 3, 2019.
- Sabato, Larry J. (November 7, 2016). "2016 President". University of Virginia Center for Politics. Retrieved March 3, 2019.
- "Electoral Scorecard: Map shifts again in Trump's favor, as Clinton holds edge". Fox News. 2016-11-07. Retrieved 2016-11-13.
- "Official List Candidates for President For GENERAL ELECTION 11/08/2016 Election" (PDF). New Jersey Secretary of State - Division of Elections. August 12, 2016. Retrieved November 9, 2016.
- "Official List Candidates for President For GENERAL ELECTION 11/08/2016 Election" (PDF). New Jersey Secretary of State - Division of Elections. December 6, 2016. Archived from the original (PDF) on January 7, 2017. Retrieved December 6, 2016.
- Bump, Philip. "The counties that flipped parties to swing the 2016 election". Washington Post. ISSN 0190-8286. Retrieved 2020-09-01.
- "Presidential Results by Congressional District, 2000-2008 – Swing State Project". www.swingstateproject.com. Retrieved 7 April 2018.