1976 United States presidential election in New Jersey
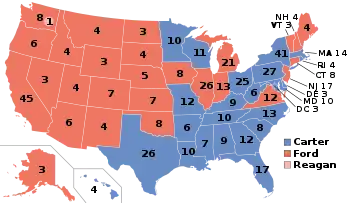
The 1976 United States presidential election in New Jersey took place on November 2, 1976. All 50 states and the District of Columbia, were part of the 1976 United States presidential election. Voters chose 17 electors to the Electoral College, which selected the president and vice president.
| ||||||||||||||||||||||||||
| ||||||||||||||||||||||||||
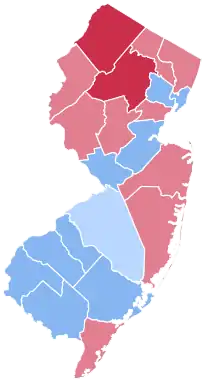
 County Results
| ||||||||||||||||||||||||||
| ||||||||||||||||||||||||||
| Elections in New Jersey |
|---|
 |
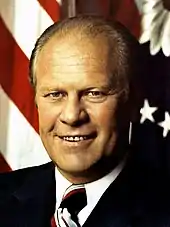
New Jersey was won by the Republican nominees, incumbent President Gerald Ford of Michigan and his running mate Senator Bob Dole of Kansas. Ford and Dole defeated the Democratic nominees, Governor Jimmy Carter of Georgia and his running mate Senator Walter Mondale of Minnesota.
Ford narrowly carried New Jersey with 50.08% of the vote to Carter's 47.92%, a victory margin of 2.16%.[1]
Anti-war former Democratic Senator Eugene McCarthy of Minnesota, running as an Independent presidential candidate, came in a distant third, with 1.09%.
Reflecting the closeness of the statewide result, Ford and Carter virtually split New Jersey's 21 counties: Ford won 11 counties to Carter's 10.
The native Southerner Jimmy Carter performed unusually well among rural voters in South Jersey, winning 6 out of 7 of the southernmost counties in the state. Carter's strongest county by vote share was rural Cumberland County in the far south of the state by the Delaware border, where he won 58-41. However his comfortable victories in more populous traditional Democratic base counties are what made him competitive statewide: in Essex County, he won 55-42, in Hudson County, he won 55-44, and in Mercer County, he won 53-45. He also won heavily populated Middlesex County, but by a narrow 51-47 margin.
The Northern moderate Ford, however, edged out Carter statewide with comfortable victories in heavily populated suburban counties which were dominated by moderate Republicans. In most presidential elections in this era, the most Republican county in the state would usually be rural, sparsely populated Sussex County. While Ford did win Sussex County decisively by a 60-38 margin, Ford's strongest county by vote share was actually suburban Morris County, where he beat Carter 61-37. In suburban Monmouth County, Ford won 54-44. Other important victories for Ford were in fairly populated Ocean County, which he won 57-41, and Passaic County, which he won 51-46. However Ford's biggest prize was very heavily populated Bergen County, which went decisively to Ford by a 56-43 margin.
New Jersey weighed in for this election as about 4% more Republican than the national average.
New Jersey in this era was a swing state with a slight Republican lean, and Gerald Ford, a moderate Republican, held enough appeal among New Jersey's many moderate suburban voters to carry the state 50-48 even as Jimmy Carter narrowly won nationally by a 50-48 margin.
This marked the last time a Democrat won the presidency without carrying New Jersey.
Results
| 1976 United States presidential election in New Jersey | |||||
|---|---|---|---|---|---|
| Party | Candidate | Votes | Percentage | Electoral votes | |
| Republican | Gerald Ford | 1,509,688 | 50.08% | 17 | |
| Democratic | Jimmy Carter | 1,444,653 | 47.92% | 0 | |
| Independent | Eugene McCarthy | 32,717 | 1.09% | 0 | |
| Libertarian | Roger MacBride | 9,449 | 0.31% | 0 | |
| American Independent | Lester Maddox | 7,716 | 0.26% | 0 | |
| Socialist Labor | Julius Levin | 3,686 | 0.12% | 0 | |
| Communist | Gus Hall | 1,662 | 0.06% | 0 | |
| U.S. Labor | Lyndon LaRouche | 1,650 | 0.05% | 0 | |
| Socialist Workers | Peter Camejo | 1,184 | 0.04% | 0 | |
| People's | Margaret Wright | 1,044 | 0.03% | 0 | |
| Prohibition | Ben Bubar | 554 | 0.02% | 0 | |
| Socialist | Frank Zeidler | 469 | 0.02% | 0 | |
| Totals | 3,014,472 | 100.0% | 17 | ||
| Voter Turnout (Voting age/Registered) | 58%/80% | ||||
Results by county
| County | Gerald Rudolph Ford Republican |
James Earl Carter Democratic |
Various candidates Other parties |
Margin | Total votes cast | ||||
|---|---|---|---|---|---|---|---|---|---|
| # | % | # | % | # | % | # | % | ||
| Atlantic | 36,733 | 45.56% | 41,965 | 52.05% | 1,932 | 2.40% | -5,232 | -6.49% | 80,630 |
| Bergen | 237,331 | 55.86% | 180,738 | 42.54% | 6,784 | 1.60% | 56,593 | 13.32% | 424,853 |
| Burlington | 60,960 | 48.07% | 63,309 | 49.92% | 2,551 | 2.01% | -2,349 | -1.85% | 126,820 |
| Camden | 82,801 | 42.33% | 108,854 | 55.65% | 3,956 | 2.02% | -26,053 | -13.32% | 195,611 |
| Cape May | 19,498 | 53.18% | 16,489 | 44.97% | 680 | 1.85% | 3,009 | 8.21% | 36,667 |
| Cumberland | 20,535 | 40.84% | 29,165 | 58.00% | 587 | 1.17% | -8,630 | -17.16% | 50,287 |
| Essex | 133,911 | 42.40% | 174,434 | 55.23% | 7,467 | 2.36% | -40,523 | -12.83% | 315,812 |
| Gloucester | 34,888 | 46.33% | 38,726 | 51.43% | 1,688 | 2.24% | -3,838 | -5.10% | 75,302 |
| Hudson | 92,636 | 43.55% | 116,241 | 54.64% | 3,853 | 1.81% | -23,605 | -11.10% | 212,730 |
| Hunterdon | 19,616 | 59.50% | 12,592 | 38.20% | 758 | 2.30% | 7,024 | 21.31% | 32,966 |
| Mercer | 58,453 | 44.67% | 69,621 | 53.20% | 2,782 | 2.13% | -11,168 | -8.53% | 130,856 |
| Middlesex | 113,539 | 47.14% | 122,859 | 51.01% | 4,466 | 1.85% | -9,320 | -3.87% | 240,864 |
| Monmouth | 110,104 | 54.29% | 88,956 | 43.87% | 3,730 | 1.84% | 21,148 | 10.43% | 202,790 |
| Morris | 105,921 | 61.45% | 63,749 | 36.98% | 2,703 | 1.57% | 42,172 | 24.47% | 172,373 |
| Ocean | 77,875 | 56.93% | 56,413 | 41.24% | 2,493 | 1.82% | 21,462 | 15.69% | 136,781 |
| Passaic | 85,102 | 51.20% | 76,194 | 45.84% | 4,930 | 2.97% | 8,908 | 5.36% | 166,226 |
| Salem | 11,639 | 46.60% | 12,826 | 51.35% | 512 | 2.05% | -1,187 | -4.75% | 24,977 |
| Somerset | 51,260 | 57.15% | 36,258 | 40.43% | 2,173 | 2.42% | 15,002 | 16.73% | 89,691 |
| Sussex | 23,613 | 60.19% | 14,759 | 37.62% | 857 | 2.18% | 8,854 | 22.57% | 39,229 |
| Union | 118,019 | 51.56% | 106,267 | 46.42% | 4,616 | 2.02% | 11,752 | 5.13% | 228,902 |
| Warren | 15,254 | 50.67% | 14,238 | 47.29% | 613 | 2.04% | 1,016 | 3.37% | 30,105 |
| Totals | 1,509,688 | 50.08% | 1,444,653 | 47.92% | 60,131 | 1.99% | 65,035 | 2.16% | 3,014,472 |
References
- "1976 Presidential General Election Results - New Jersey". Dave Leip's Atlas of U.S. Presidential Elections. Retrieved 16 November 2013.

.jpg.webp)
