2012 United States presidential election in New Jersey
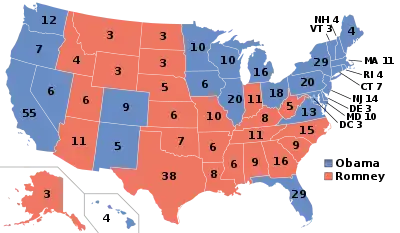
The 2012 United States presidential election in New Jersey took place on November 6, 2012, as part of the 2012 United States presidential election in which all 50 states plus the District of Columbia participated. Voters in the state chose 14 electors to represent them in the Electoral College via a popular vote pitting incumbent Democratic President Barack Obama and his running mate, Vice President Joe Biden, against Republican challenger and former Massachusetts Governor Mitt Romney and his running mate, Congressman Paul Ryan.
| ||||||||||||||||||||||||||
| ||||||||||||||||||||||||||
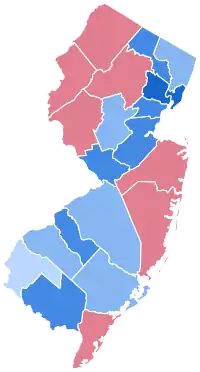 County Results
| ||||||||||||||||||||||||||
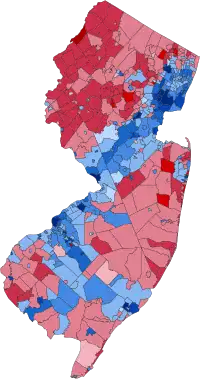 Municipality Results | ||||||||||||||||||||||||||
| ||||||||||||||||||||||||||

| Elections in New Jersey |
|---|
 |
Due to the difficulty of getting to polling places because of the damage caused by Hurricane Sandy, voters who were displaced were allowed to vote electronically. Officials were not prepared for the 15 minutes that it took to validate each request, and were deluged by voters who were not displaced asking to vote electronically, so voting was extended until Friday, November 9, at 8 PM. Requests had to be submitted by 5 PM.[1] It's likely that Obama's response to the hurricane, approved by 77% of Obama voters (with 8% disapproving and 15% unsure) and 44% (with 21% disapproving and 35% unsure) of Romney's voters, boosted his performance in New Jersey, which was hit hard by the superstorm.[2]
New Jersey was won by President Obama with 58.38% of the vote to Romney's 40.59%, a 17.79% margin of victory, an increase from 15.53% in 2008.[3] New Jersey was 1 of just 6 states to swing in President Obama's favor between 2008 and 2012, giving him the largest vote share for a Democratic presidential nominee in the state since Lyndon Johnson's 1964. Obama won over many municipalities in northeastern New Jersey that voted Republican in 2008.
In 2012, New Jersey voted 13.93% to the left of the nation as a whole.
As of the 2020 presidential election, this is the last time a Democrat has won Salem County.
Democratic primary
Incumbent Barack Obama ran unopposed[4] in the Democratic primary held on June 5, 2012. He received 283,673 votes[5] according to the Secretary of State, though county clerks' websites report write-in votes as well. The state's 172 delegates voted unanimously for Obama at the 2012 Democratic National Convention in Charlotte, North Carolina.[6]
Republican primary
| ||||||||||||||||||||||
| ||||||||||||||||||||||

The Republican primary occurred on June 5, 2012.[7][8]
New Jersey sent 50 delegates to the Republican National Convention on August 5, 2012. All 50 delegates were awarded by a winner-take-all statewide vote. New Jersey Republican Party rules obligate and require the delegates to cast their vote for the winner of the primary on the first 3 ballots at the convention.[9]
| New Jersey Republican primary, 2012[5] | |||
|---|---|---|---|
| Candidate | Votes | Percentage | Delegates |
| 188,121 | 81.3% | 50 | |
| Ron Paul | 24,017 | 10.4% | 0 |
| Rick Santorum | 12,115 | 5.2% | 0 |
| Newt Gingrich | 7,212 | 3.1% | 0 |
| Pledged leaders: | 3 | ||
| Total: | 231,465 | 100.0% | 50 |
| Key: | Withdrew prior to contest |
General election
Candidate Ballot Access:[10]
- Barack Obama/Joseph Biden, Democratic
- Mitt Romney/Paul Ryan, Republican
- Merlin Miller/Harry Bertram, American Third Position
- Virgil Goode/Jim Clymer, Constitution
- Jill Stein/Cheri Honkala, Green
- Gary Johnson/James P. Gray, Libertarian
- Rocky Anderson/Luis J. Rodriguez, Justice
- Jeff Boss/Bob Pasternak, NSA Did 911
- Peta Lindsay/Yari Osorio, Socialism and Liberation
- James Harris/Maura Deluca, Socialist Workers
Results
| 2012 United States presidential election in New Jersey[3] | ||||||
|---|---|---|---|---|---|---|
| Party | Candidate | Running mate | Votes | Percentage | Electoral votes | |
| Democratic | Barack Obama | Joe Biden | 2,125,101 | 58.38% | 14 | |
| Republican | Mitt Romney | Paul Ryan | 1,477,568 | 40.59% | 0 | |
| Libertarian | Gary Johnson | Jim Gray | 21,045 | 0.58% | 0 | |
| Green | Jill Stein | Cheri Honkala | 9,888 | 0.27% | 0 | |
| Constitution | Virgil Goode | Jim Clymer | 2,064 | 0.06% | 0 | |
| Justice | Rocky Anderson | Luis J. Rodriguez | 1,724 | 0.05% | 0 | |
| NSA Did 911 | Jeff Boss | Bob Pasternak | 1,007 | 0.03% | 0 | |
| Socialist Workers | James Harris | Maura Deluca | 710 | 0.02% | 0 | |
| American Third Position | Merlin Miller | Harry Bertram | 664 | 0.02% | 0 | |
| Socialism and Liberation | Peta Lindsay | Yari Osorio | 521 | 0.01% | 0 | |
| Totals | 3,640,292 | 100.00% | 14 | |||
| Voter Turnout (Registered) | 66.4% | |||||
By county
| County | Obama% | Obama# | Romney% | Romney# | Johnson% | Johnson# | Stein% | Stein# | Others% | Others# | Total |
|---|---|---|---|---|---|---|---|---|---|---|---|
| Atlantic | 57.96% | 65,600 | 41.10% | 46,522 | 0.51% | 579 | 0.18% | 203 | 0.24% | 275 | 113,179 |
| Bergen | 55.20% | 212,754 | 43.87% | 169,070 | 0.45% | 1,752 | 0.33% | 1,270 | 0.15% | 561 | 385,407 |
| Burlington | 58.53% | 126,377 | 40.48% | 87,401 | 0.63% | 1,367 | 0.24% | 528 | 0.12% | 263 | 215,936 |
| Camden | 68.17% | 153,682 | 30.82% | 69,476 | 0.55% | 1,250 | 0.31% | 697 | 0.14% | 323 | 225,428 |
| Cape May | 45.18% | 21,657 | 53.79% | 25,781 | 0.53% | 253 | 0.23% | 112 | 0.27% | 128 | 47,932 |
| Cumberland | 61.59% | 34,055 | 37.36% | 20,658 | 0.51% | 283 | 0.21% | 117 | 0.32% | 179 | 55,292 |
| Essex | 78.09% | 236,618 | 21.25% | 64,406 | 0.32% | 962 | 0.20% | 602 | 0.14% | 431 | 303,019 |
| Gloucester | 54.74% | 74,013 | 43.98% | 59,456 | 0.77% | 1,040 | 0.40% | 539 | 0.11% | 155 | 135,203 |
| Hudson | 77.52% | 153,108 | 21.45% | 42,369 | 0.51% | 1,002 | 0.34% | 674 | 0.18% | 351 | 197,504 |
| Hunterdon | 40.42% | 26,876 | 58.18% | 38,687 | 0.83% | 549 | 0.36% | 238 | 0.22% | 144 | 66,495 |
| Mercer | 67.99% | 104,377 | 30.85% | 47,355 | 0.60% | 915 | 0.35% | 530 | 0.22% | 334 | 153,511 |
| Middlesex | 63.24% | 190,555 | 35.61% | 107,310 | 0.61% | 1,851 | 0.28% | 852 | 0.25% | 747 | 301,315 |
| Monmouth | 46.89% | 133,145 | 51.95% | 147,513 | 0.78% | 2,228 | 0.25% | 708 | 0.14% | 384 | 283,979 |
| Morris | 44.04% | 100,146 | 54.95% | 124,947 | 0.60% | 1,375 | 0.21% | 485 | 0.19% | 439 | 227,393 |
| Ocean | 40.71% | 102,300 | 58.29% | 146,474 | 0.58% | 1,467 | 0.20% | 507 | 0.21% | 525 | 251,274 |
| Passaic | 63.70% | 115,926 | 35.45% | 64,523 | 0.39% | 717 | 0.28% | 515 | 0.17% | 307 | 181,988 |
| Salem | 49.89% | 14,719 | 48.59% | 14,334 | 0.83% | 248 | 0.40% | 121 | 0.26% | 79 | 29,502 |
| Somerset | 52.19% | 74,592 | 46.60% | 66,603 | 0.76% | 1,088 | 0.25% | 358 | 0.20% | 280 | 142,921 |
| Sussex | 38.43% | 26,104 | 59.80% | 40,625 | 1.11% | 757 | 0.38% | 255 | 0.28% | 192 | 67,934 |
| Union | 66.60% | 139,752 | 32.56% | 68,314 | 0.45% | 952 | 0.20% | 410 | 0.19% | 403 | 209,831 |
| Warren | 41.41% | 18,745 | 56.87% | 25,744 | 0.91% | 410 | 0.37% | 167 | 0.45% | 204 | 45,271 |
| Totals | 58.38% | 2,125,101 | 40.59% | 1,477,568 | 0.58% | 21,045 | 0.27% | 9,888 | 0.18% | 6,704 | 3,640,292 |
By congressional district
Obama won 8 of 12 congressional districts.[11]
| District | Obama | Romney | Representative |
|---|---|---|---|
| 1st | 65% | 34% | Rob Andrews |
| 2nd | 54% | 45% | Frank LoBiondo |
| 3rd | 52% | 47% | Jon Runyan |
| 4th | 45% | 54% | Chris Smith |
| 5th | 49% | 51% | Scott Garrett |
| 6th | 61% | 37% | Frank Pallone, Jr. |
| 7th | 46% | 53% | Leonard Lance |
| 8th | 78% | 21% | Albio Sires |
| 9th | 68% | 31% | Bill Pascrell |
| 10th | 88% | 12% | Donald M. Payne Jr. |
| 11th | 47% | 52% | Rodney Frelinghuysen |
| 12th | 67% | 32% | Rush Holt, Jr. |
Analysis
New Jersey was one of just six states that voted more Democratic in 2012 than it had in 2008. In 2008, Obama won the state by roughly 602,000 votes, whereas in 2012, this margin increased to about 648,000 votes. Obama's increased statewide margin owed itself to larger Democratic margins in several central and northern counties. In Middlesex, Hudson, Passaic, and Union Counties collectively, Obama netted nearly 45,000 additional votes compared to 2008. Outside of these four counties, most others in the state had comparable margins to 2008.
Turnout patterns relative to 2008 arguably helped Obama increase his statewide margin. Every county cast fewer votes in 2012 than in 2008, but not uniformly so. Perhaps due to the effects of Hurricane Sandy, conservative Monmouth County saw the largest percentage decrease in votes cast from 2008, with Ocean County also witnessing a substantial decline in votes cast. In the northwestern part of the state, strongly Republican Sussex and Warren County experienced moderately lower turnout. In terms of raw votes cast, Passaic County, which is strongly Democratic, came closest to its 2008 figures, with just 5,000 fewer votes cast in 2012 than in 2008.
Obama's improved performance was quite unusual as his performance worsened in most other areas of the nation (particularly the Midwest and Rust Belt). It's likely this was due to his widely approved response to Hurricane Sandy, which had a devastating effect on the state, causing two million households to lose power, destroying 346,000 homes, [12] and causing blockades on bridges and roads for up to two weeks. [13] Obama's response to the so-called superstorm also likely contributed to his improved performance. According to a poll conducted by ABC News and The Washington Post, not only did 77% of Obama's voters approve of his handling of the storm (with 8% disapproving and 15% unsure), he also received a plurality amongst Romney voters, with 44% approving of his handling, 21% disapproving, and 35% unsure.[14] Another poll by the Pew Research Center found that 67% of registered voters approved of Obama's response with only 15% disapproving.[15] Chris Christie, the state's Republican governor called Obama's response to the hurricane "outstanding" and praised him for his frequent coordination with the New Jersey government, potentially boosted his popularity amongst Republican voters.[16]
2012 U.S. presidential election | |
|---|---|
| Democratic Party | |
| Republican Party | |
| Related races | |
| |
References
- "New Jersey's email voting suffers major glitches, deadline extended to Friday". Retrieved 2012-11-09.
- Clement, Jon Cohen, Peyton M. Craighill and Scott (2012-10-31). "WaPo-ABC tracking poll: High marks for President Obama on Hurricane Sandy response". Washington Post. ISSN 0190-8286. Retrieved 2020-09-03.
- "New Jersey Division of Elections Official General Election Results" (PDF). Archived from the original (PDF) on 9 May 2013. Retrieved 7 December 2012.
- "Official List Candidates for president For PRIMARY ELECTION 06/05/2012 Election" (PDF). New Jersey Department of State - Division of Elections. April 12, 2012. Retrieved December 11, 2012.
- "Official List Candidates for president For PRIMARY ELECTION 06/05/2012 Election" (PDF). New Jersey Department of State - Division of Elections. July 23, 2012. Retrieved December 11, 2012.
- "New Jersey Democratic Delegation 2012". The Green Papers. November 17, 2012. Retrieved December 11, 2012.
- "Primary and Caucus Printable Calendar". CNN. Retrieved January 11, 2012.
- "Presidential Primary Dates" (PDF). Federal Election Commission. Retrieved January 23, 2012.
- "2012 Presidential Primaries, Caucuses, and Conventions". The Green Papers. Retrieved March 4, 2012.
- "Official List Candidates for president For GENERAL ELECTION 11/06/2012 Election" (PDF). New Jersey Secretary of State - Division of Elections. September 13, 2012. Retrieved December 11, 2012.
- "Daily Kos Elections' statewide election results by congressional and legislative districts". Daily Kos. Retrieved 11 August 2020.
- Chris Smith (New Jersey politician) (January 2, 2013). "Floor statement on Sandy supplemental" (PDF). United States House of Representatives.
- Star-Ledger, Mike Frassinelli/The (2012-11-02). "N.J. to get $10M in emergency relief to repair roads, bridges in wake of Sandy". nj. Retrieved 2020-09-03.
- Clement, Jon Cohen, Peyton M. Craighill and Scott (2012-10-31). "WaPo-ABC tracking poll: High marks for President Obama on Hurricane Sandy response". Washington Post. ISSN 0190-8286. Retrieved 2020-09-03.
- Cassidy, John. "How Much Did Hurricane Sandy Help Obama?". The New Yorker. Retrieved 2020-09-03.
- Robillard, Kevin. "Christie heaps praise on Obama". POLITICO. Retrieved 2020-09-03.
External links
- The Green Papers: for New Jersey
- The Green Papers: Major state elections in chronological order