1985 Clare County Council election
An election to Clare County Council took place on 20 June 1985 as part of that year's Irish local elections. 32 councillors were elected from six electoral divisions by PR-STV voting for a six-year term of office.
| |||||||||||||||||||||||||||||||||
All 32 seats to Clare County Council | |||||||||||||||||||||||||||||||||
|---|---|---|---|---|---|---|---|---|---|---|---|---|---|---|---|---|---|---|---|---|---|---|---|---|---|---|---|---|---|---|---|---|---|
| |||||||||||||||||||||||||||||||||
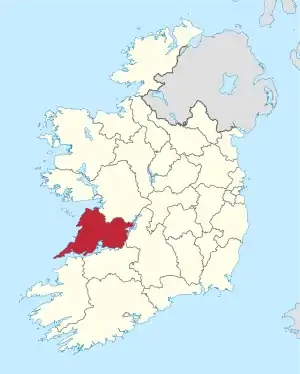 Map showing the area of Clare County Council | |||||||||||||||||||||||||||||||||
| |||||||||||||||||||||||||||||||||
Results by party
| Party | Seats | ± | First Pref. votes | FPv% | ±% | |
|---|---|---|---|---|---|---|
| Fianna Fáil | 17 | - | 23,382 | 53.52% | ||
| Fine Gael | 8 | -1 | 10,232 | 23.42% | ||
| Labour | 2 | - | 2,256 | 5.16% | ||
| Independent | 5 | +2 | 7,629 | 17.46% | ||
| Totals | 32 | +1 | 43,393 | 100% | — | |
Results by Electoral Area
Ennis
| Party | Candidate | FPv% | Count | ||||||
|---|---|---|---|---|---|---|---|---|---|
| 1 | 2 | 3 | 4 | 5 | 6 | ||||
| Independent | Tommy Brennan | 1,007 | |||||||
| Fianna Fáil | Frank Barrett | 827 | 845 | 864 | 892 | 917 | |||
| Fianna Fáil | Bobby Burke | 673 | 693 | 716 | 741 | 777 | 825 | ||
| Fine Gael | Michael Howard* | 627 | 648 | 679 | 772 | 1,044 | |||
| Fianna Fáil | Peter Considine | 606 | 627 | 642 | 661 | 691 | 742 | ||
| Fine Gael | Angela Coughlan | 334 | 345 | 368 | 422 | ||||
| Labour | Flan Honan | 228 | 238 | 280 | |||||
| Workers' Party | Dermot Hayes | 186 | 194 | ||||||
| Electorate: 8,261 Valid: 4,488 (55.11%) Spoilt: 65 Quota: 898 Turnout: 4,553 | |||||||||
Ennistymon
| Party | Candidate | FPv% | Count | |||||||
|---|---|---|---|---|---|---|---|---|---|---|
| 1 | 2 | 3 | 4 | 5 | 6 | 7 | ||||
| Fianna Fáil | Tony Killeen | 1,284 | ||||||||
| Fine Gael | Frank Henchy* | 1,120 | 1,127 | 1,134 | 1,472 | |||||
| Fianna Fáil | Enda Mulkere | 1,029 | 1,052 | 1,060 | 1,081 | 1,128 | 1,135 | 1,440 | ||
| Labour | Martin Lafferty* | 1,027 | 1,036 | 1,043 | 1,216 | |||||
| Fianna Fáil | Jimmy Nagle* | 932 | 951 | 955 | 1,009 | 1,057 | 1,086 | 1,730 | ||
| Fianna Fáil | Jack Lynch* | 887 | 946 | 956 | 994 | 1,044 | 1,062 | |||
| Fine Gael | Bill Slattery | 645 | 649 | 652 | ||||||
| Independent | Joseph Meehan | 47 | 48 | |||||||
| Electorate: 9,782 Valid: 6,971 (71.72%) Spoilt: 45 Quota: 1,162 Turnout: 7,016 | ||||||||||
Killaloe
| Party | Candidate | FPv% | Count | |||||
|---|---|---|---|---|---|---|---|---|
| 1 | 2 | 3 | 4 | 5 | ||||
| Independent | John Minogue* | 1,545 | ||||||
| Fianna Fáil | Colm Wiley* | 1,385 | ||||||
| Fianna Fáil | Joe Gorman | 1,295 | 1,360 | |||||
| Fine Gael | Patrick Bugler* | 1,208 | 1,266 | 1,497 | ||||
| Fine Gael | Tony McMahon* | 1,197 | 1,221 | 1,248 | 1,278 | 1,286 | ||
| Fianna Fáil | Michael Begley | 1,038 | 1,044 | 1,131 | 1,150 | 1,201 | ||
| Fianna Fáil | Harry Brannn* | 885 | 900 | 1,251 | 1,361 | |||
| Fianna Fáil | Eoin Maloney | 726 | 777 | |||||
| Electorate: 13,372 Valid: 9,279 (69.89%) Spoilt: 367 Quota: 1,326 Turnout: 9,346 | ||||||||
Kilrush
| Party | Candidate | FPv% | Count | |||||||||
|---|---|---|---|---|---|---|---|---|---|---|---|---|
| 1 | 2 | 3 | 4 | 5 | 6 | 7 | 8 | 9 | ||||
| Fianna Fáil | P.J. Kelly | 1,099 | 1,106 | 1,203 | 1,219 | 1,220 | 1,275 | |||||
| Fianna Fáil | Bill Chambers | 1,084 | 1,108 | 1,234 | 1,280 | |||||||
| Fine Gael | Madeleine Taylor-QuinnTD* | 955 | 1,079 | 1,091 | 1,213 | 1,217 | 1,301 | |||||
| Fine Gael | Jackie Keane* | 872 | 923 | 1,039 | 1,059 | 1,061 | 1,081 | 1,085 | 1,452 | |||
| Fianna Fáil | Seán Keating* | 820 | 846 | 877 | 998 | 1,006 | 1,135 | 1,143 | 1,249 | |||
| Independent | William O'Looney | 756 | 771 | 772 | 803 | 804 | 991 | 1,021 | 1,090 | 1,157 | ||
| Fianna Fáil | Michael Flynn | 562 | 584 | 625 | 660 | 666 | ||||||
| Fianna Fáil | Martin Foran* | 556 | 585 | 594 | 693 | 700 | 816 | 819 | 866 | 901 | ||
| Independent | Sean Maloney | 551 | 585 | 589 | ||||||||
| Fine Gael | Sean Ryan | 547 | 607 | 682 | 726 | 730 | 771 | |||||
| Fianna Fáil | Timmy McMahon | 514 | 519 | |||||||||
| Fine Gael | Annette Burke | 410 | ||||||||||
| Electorate: 11,784 Valid: 8,726 (74.54%) Spoilt: 58 Quota: 1,247 Turnout: 8,784 | ||||||||||||
Miltown-Malbay
| Party | Candidate | FPv% | Count | ||||||
|---|---|---|---|---|---|---|---|---|---|
| 1 | 2 | 3 | 4 | 5 | 6 | ||||
| Independent | P.J. Burke* | 1,408 | |||||||
| Independent | Christy Curtin* | 1,249 | |||||||
| Fianna Fáil | James Breen | 1,038 | 1,082 | 1,102 | 1,128 | 1,147 | 1,320 | ||
| Fianna Fáil | Flan Garvey | 974 | 1,010 | 1,024 | 1,044 | 1,053 | 1,133 | ||
| Fine Gael | Donal CareyTD* | 883 | 908 | 929 | 1,175 | ||||
| Fianna Fáil | Haulie Daly | 756 | 767 | 788 | 794 | 798 | 830 | ||
| Fianna Fáil | Michael Hillery | 617 | 668 | 672 | 752 | 792 | 1,165 | ||
| Fianna Fáil | Timothy Sexton | 603 | 657 | 659 | 707 | 736 | |||
| Fine Gael | P.J. Meade | 404 | 436 | 447 | |||||
| Independent | Basil Minihane | 65 | 69 | ||||||
| Independent | Frank McTigue | 36 | 39 | ||||||
| Electorate: 11,177 Valid: 8,033 (72.42%) Spoilt: 61 Quota: 1,148 Turnout: 8,094 | |||||||||
Shannon
| Party | Candidate | FPv% | Count | |||||||||
|---|---|---|---|---|---|---|---|---|---|---|---|---|
| 1 | 2 | 3 | 4 | 5 | 6 | 7 | 8 | 9 | ||||
| Fianna Fáil | Pat McMahon* | 1,103 | ||||||||||
| Labour | Patricia McCarthy* | 1,001 | 1,006 | 1,026 | 1,074 | |||||||
| Fianna Fáil | Sean Driscoll | 977 | 991 | 1,002 | 1,015 | 1,103 | ||||||
| Fianna Fáil | PJ Cunningham | 568 | 586 | 631 | 632 | 648 | 662 | 705 | 769 | |||
| Fianna Fáil | Seán Hillery | 544 | 561 | 577 | 593 | 636 | 666 | 702 | 863 | 1,267 | ||
| Fine Gael | Sonny Scanlon | 419 | 421 | 446 | 519 | 526 | 528 | 790 | 868 | 1,050 | ||
| Independent | John Murray | 404 | 407 | 427 | 427 | 540 | 554 | 594 | ||||
| Fine Gael | Mary Donnelly | 382 | 390 | 409 | 440 | 454 | 457 | |||||
| Independent | Brigid Makowski | 372 | 372 | 380 | 382 | |||||||
| Fine Gael | Joan Reddan | 229 | 231 | 237 | ||||||||
| Independent | JJ McCabe | 189 | 191 | |||||||||
| Electorate: 9,767 Valid: 6,188 (63.36%) Quota: 1,032 Turnout: | ||||||||||||
External links
- Official website
- irishelectionliterature
- Department of the Environment, Ireland (28 January 2010). "Local elections, 1985 : election results and transfer of votes in respect of each county, and county borough council : and election statistics relating to all local authorities" (PDF). Department of the Environment. Retrieved 28 October 2019.
| Preceded by 1979 Clare County Council election |
Clare County Council elections | Succeeded by 1991 Clare County Council election |
This article is issued from Wikipedia. The text is licensed under Creative Commons - Attribution - Sharealike. Additional terms may apply for the media files.