1985 Laois County Council election
An election to Laois County Council took place on 20 June 1985 as part of that year's Irish local elections. 25 councillors were elected from five electoral divisions by PR-STV voting for a six-year term of office.
| |||||||||||||||||||||||||||||||||
All 25 seats to Laois County Council | |||||||||||||||||||||||||||||||||
|---|---|---|---|---|---|---|---|---|---|---|---|---|---|---|---|---|---|---|---|---|---|---|---|---|---|---|---|---|---|---|---|---|---|
| |||||||||||||||||||||||||||||||||
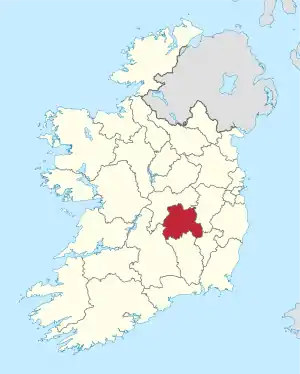 Map showing the area of Laois County Council | |||||||||||||||||||||||||||||||||
| |||||||||||||||||||||||||||||||||
Results by party
| Party | Seats | ± | First Pref. votes | FPv% | ±% | |
|---|---|---|---|---|---|---|
| Fianna Fáil | 14 | +3 | 11,989 | 50.33% | ||
| Fine Gael | 9 | -3 | 8,513 | 35.74% | ||
| Labour | 1 | -1 | 1,446 | 6.07% | ||
| Independent | 1 | +1 | 1,873 | 7.86% | ||
| Totals | 25 | - | 23,219 | 100% | — | |
Results by Electoral Area
Borris-in-Ossory
| Party | Candidate | FPv% | Count | ||||||||||
|---|---|---|---|---|---|---|---|---|---|---|---|---|---|
| 1 | 2 | 3 | 4 | 5 | 6 | 7 | 8 | 9 | 10 | ||||
| Fianna Fáil | Liam HylandTD* | 1,479 | |||||||||||
| Independent | Jimmy Kelly* | 837 | 873 | ||||||||||
| Fine Gael | William Mansfield* | 712 | 744 | 745 | 800 | 845 | 850 | 854 | |||||
| Fine Gael | Sean Jacob* | 589 | 654 | 655 | 657 | 749 | 751 | 835 | 914 | ||||
| Fine Gael | Jim Phelan* | 508 | 528 | 529 | 530 | 571 | 572 | 582 | 664 | 785 | 829 | ||
| Fianna Fáil | Fintan Phelan | 390 | 460 | 466 | 493 | 536 | 537 | 569 | 641 | 735 | 737 | ||
| Labour | Larry Kavanagh | 377 | 395 | 402 | 405 | 500 | 501 | 511 | |||||
| Fianna Fáil | Paddy Phelan* | 369 | 446 | 447 | 527 | 528 | 531 | 651 | 665 | 723 | 725 | ||
| Fianna Fáil | Thomas Fennelly | 356 | 421 | 423 | 441 | 446 | 447 | 533 | 552 | ||||
| Fine Gael | Brendan Dunne | 349 | 362 | 368 | 373 | ||||||||
| Fianna Fáil | Eddie Kirwan | 326 | 386 | 387 | 435 | 465 | 470 | 530 | 649 | 821 | 824 | ||
| Fianna Fáil | Eamon Rafter* | 313 | 411 | 412 | 428 | 433 | 433 | ||||||
| Fianna Fáil | Martin Keane | 193 | 260 | 262 | |||||||||
| Independent | Brendan Clear | 31 | 35 | ||||||||||
| Electorate: 9,808 Valid: 6,829 (70.01%) Spoilt: 38 Quota: 854 Turnout: 6,867 | |||||||||||||
Emo
| Party | Candidate | FPv% | Count | |||||
|---|---|---|---|---|---|---|---|---|
| 1 | 2 | 3 | 4 | 5 | ||||
| Fianna Fáil | Ray Cribbin | 691 | 700 | 729 | 903 | |||
| Fianna Fáil | Michael Nerney* | 684 | 716 | 741 | 852 | |||
| Fine Gael | Jim Buggie* | 553 | 624 | 711 | 718 | 725 | ||
| Labour | Ned Kelly* | 456 | 593 | 626 | 698 | 747 | ||
| Fianna Fáil | Don Cunningham | 377 | 383 | 394 | ||||
| Fine Gael | Mary Lewis | 369 | 387 | 495 | 513 | 521 | ||
| Fine Gael | John O'Reilly* | 296 | 298 | |||||
| Labour | Frank Byrne | 279 | ||||||
| Electorate: 6,146 Valid: 3,705 (60.93%) Spoilt: 40 Quota: 742 Turnout: 3,745 | ||||||||
Luggacurren
| Party | Candidate | FPv% | Count | |||||||
|---|---|---|---|---|---|---|---|---|---|---|
| 1 | 2 | 3 | 4 | 5 | 6 | 7 | ||||
| Fianna Fáil | Martin Rohan* | 668 | 674 | 681 | 681 | 712 | 775 | 785 | ||
| Fianna Fáil | James Cooney* | 649 | 679 | 695 | 708 | 927 | ||||
| Fianna Fáil | Mary Wheatley | 556 | 572 | 593 | 610 | 718 | 760 | 862 | ||
| Fianna Fáil | Liam Doran | 369 | 373 | 386 | 439 | |||||
| Independent | William Fleming* | 366 | 408 | 436 | 450 | 455 | 458 | |||
| Independent | John Daly* | 363 | 403 | 443 | 458 | 489 | 496 | 683 | ||
| Fine Gael | Senator Charles McDonald* | 338 | 357 | 432 | 649 | 674 | 680 | 755 | ||
| Fine Gael | John Gaffney | 267 | 282 | 347 | ||||||
| Fine Gael | John Moran | 240 | 271 | |||||||
| Labour | Tony O'Brien | 211 | ||||||||
| Electorate: 5,915 Valid: 4,027 (63.13%) Spoilt: 41 Quota: 806 Turnout: 4,068 | ||||||||||
Portlaoise
| Party | Candidate | FPv% | Count | ||||||
|---|---|---|---|---|---|---|---|---|---|
| 1 | 2 | 3 | 4 | 5 | 6 | ||||
| Fianna Fáil | Joe Dunne* | 907 | |||||||
| Fine Gael | Tom Keenan* | 750 | |||||||
| Fianna Fáil | Jerry Lodge* | 564 | 639 | 669 | 678 | 813 | |||
| Fine Gael | William Aird | 549 | 563 | 581 | 654 | 690 | 763 | ||
| Fianna Fáil | John Hosey* | 471 | 483 | 490 | 568 | 621 | 674 | ||
| Fine Gael | Joe Carroll* | 395 | 401 | 413 | 439 | 457 | 552 | ||
| Independent | Joe McCormack | 256 | 267 | 312 | 329 | 359 | |||
| Fianna Fáil | Tom Jacob | 228 | 269 | 278 | 280 | ||||
| Fine Gael | Michael Dea | 196 | 197 | 213 | |||||
| Labour | Tom Phelan | 123 | 125 | ||||||
| Independent | Patrick Larkin | 20 | 21 | ||||||
| Electorate: 7,056 Valid: 4,459 (63.79%) Spoilt: 42 Quota: 744 Turnout: 4,501 | |||||||||
Tinnahinch
| Party | Candidate | FPv% | Count | ||||||||
|---|---|---|---|---|---|---|---|---|---|---|---|
| 1 | 2 | 3 | 4 | 5 | 6 | 7 | 8 | ||||
| Fianna Fáil | John Moloney | 1,279 | |||||||||
| Fine Gael | Oliver J. FlanaganTD* | 728 | 779 | 918 | |||||||
| Fine Gael | David Goodwin* | 485 | 508 | 562 | 624 | 645 | 650 | 898 | |||
| Fine Gael | Michael Lalor* | 478 | 491 | 506 | 522 | 545 | 555 | 658 | 739 | ||
| Fianna Fáil | Seamus McDonald | 473 | 660 | 685 | 698 | 928 | |||||
| Fine Gael | Denis Feighery | 440 | 449 | 488 | 499 | 516 | 522 | ||||
| Fianna Fáil | Joe Digan | 378 | 425 | 447 | 453 | 510 | 616 | 727 | 743 | ||
| Fine Gael | Noel Deffew | 271 | 330 | ||||||||
| Fianna Fáil | Donal McCormack | 269 | 358 | 367 | 372 | ||||||
| Electorate: 6,332 Valid: 4,801 (76.58%) Spoilt: 48 Quota: 801 Turnout: 4,849 | |||||||||||
External links
- Department of the Environment, Ireland (28 January 2010). "Local elections, 1985 : election results and transfer of votes in respect of each county, and county borough council : and election statistics relating to all local authorities" (PDF). Department of the Environment. Retrieved 28 October 2019.
- Official website
- irishelectionliterature
| Preceded by 1979 Laois County Council election |
Laois County Council elections | Succeeded by 1985 Laois County Council election |
This article is issued from Wikipedia. The text is licensed under Creative Commons - Attribution - Sharealike. Additional terms may apply for the media files.