1985 Dublin County Council election
An election to Dublin County Council took place on 20 June 1985 as part of that year's Irish local elections. councillors were elected from electoral divisions by PR-STV voting for a six-year term of office. This was the penultimate election to Dublin County Council.
| |||||||||||||||||||||||
All 26 seats to Dublin County Council | |||||||||||||||||||||||
|---|---|---|---|---|---|---|---|---|---|---|---|---|---|---|---|---|---|---|---|---|---|---|---|
| |||||||||||||||||||||||
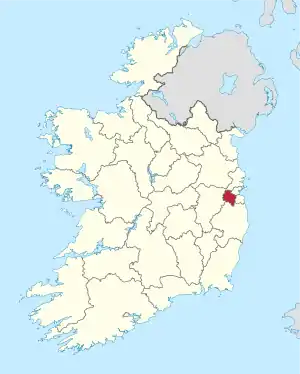 Map showing the area of Dublin County Council | |||||||||||||||||||||||
| |||||||||||||||||||||||
Results by party
| Party | Seats | ± | First Pref. votes | FPv% | ±% | |
|---|---|---|---|---|---|---|
| Fianna Fáil | ||||||
| Fine Gael | ||||||
| Labour | ||||||
| Workers' Party | ||||||
| Independent | ||||||
| Totals | - | 100% | — | |||
Results by Electoral Area
Balbriggan
| Party | Candidate | FPv% | Count | |||||||||
|---|---|---|---|---|---|---|---|---|---|---|---|---|
| 1 | 2 | 3 | 4 | 5 | 6 | 7 | 8 | 9 | ||||
| Fianna Fáil | Jack Larkin | 1,386 | 1,405 | 1,450 | 1,646 | |||||||
| Fine Gael | Cathal Boland* | 1,245 | 1,272 | 1,285 | 1,298 | 1,300 | 1,593 | |||||
| Fianna Fáil | Sean Gilbride | 1,082 | 1,102 | 1,142 | 1,230 | 1,300 | 1,336 | 1,337 | 1,430 | 1,493 | ||
| Fianna Fáil | Jim Geraghty | 971 | 979 | 992 | 1,105 | 1,133 | 1,146 | 1,147 | 1,177 | 1,405 | ||
| Labour | Ken Farrell | 942 | 968 | 998 | 1,008 | 1,008 | 1,019 | 1,021 | 1,365 | 1,596 | ||
| Independent | Catherine Cusack | 640 | 705 | 748 | 763 | 763 | 794 | 796 | 840 | |||
| Fine Gael | Bill Reynolds* | 636 | 644 | 653 | 742 | 748 | 854 | 899 | 959 | 1,070 | ||
| Fine Gael | Patricia Gallen | 588 | 614 | 633 | 646 | 648 | ||||||
| Fianna Fáil | John Maxwell | 540 | 547 | 570 | ||||||||
| Labour | Joe Davis | 536 | 563 | 649 | 661 | 664 | 779 | 786 | ||||
| Sinn Féin | Briege Tuite | 363 | 394 | |||||||||
| Green Alliance | Trevor Sargent | 227 | ||||||||||
| Independent | Kay Hanratty | 50 | ||||||||||
| Electorate: 17,776 Valid: 9,206 (52.6%) Spoilt: 149 Quota: 1,535 Turnout: 9,351 | ||||||||||||
Castleknock
| Party | Candidate | FPv% | Count | |||||||||
|---|---|---|---|---|---|---|---|---|---|---|---|---|
| 1 | 2 | 3 | 4 | 5 | 6 | 7 | 8 | 9 | ||||
| Fine Gael | Jim Fay* | 922 | 928 | 944 | 987 | 1,016 | 1,163 | |||||
| Fianna Fáil | Ned Ryan | 882 | 884 | 886 | 890 | 898 | 909 | 909 | 1,247 | |||
| Fianna Fáil | Tom Boland | 834 | 838 | 841 | 847 | 870 | 880 | 880 | 1,187 | |||
| Fianna Fáil | Teresa Watters | 752 | 754 | 760 | 772 | 794 | 825 | 826 | ||||
| Independent | Seán Lyons | 714 | 718 | 761 | 794 | 916 | 935 | 939 | 1,015 | 1,098 | ||
| Fine Gael | Tom Samfey | 561 | 564 | 568 | 593 | 615 | 834 | 865 | 925 | 962 | ||
| Fine Gael | Jennifer Payne | 361 | 364 | 379 | 425 | 452 | ||||||
| Workers' Party | Eamonn Lynskey | 219 | 226 | 249 | 304 | |||||||
| Labour | Ita Kavanagh | 175 | 210 | 234 | ||||||||
| Green Alliance | John Garvey | 141 | 143 | |||||||||
| Labour | Bill Hughes | 69 | ||||||||||
| Electorate: 11,887 Valid: 5,630 (47.79%) Spoilt: 51 Quota: 1,127 Turnout: 5,681 | ||||||||||||
Howth
| Party | Candidate | FPv% | Count | |||||||||
|---|---|---|---|---|---|---|---|---|---|---|---|---|
| 1 | 2 | 3 | 4 | 5 | 6 | 7 | 8 | 9 | ||||
| Fine Gael | Michael Joe CosgraveTD* | 1,536 | ||||||||||
| Fianna Fáil | Liam Creaven | 912 | 920 | 927 | 941 | 990 | 1,129 | 1,177 | 1,528 | |||
| Independent | Noel Peers | 759 | 770 | 812 | 909 | 1,148 | 1,218 | 1,265 | 1,303 | 1,309 | ||
| Fianna Fáil | Eilis Rickard | 663 | 673 | 680 | 698 | 737 | 919 | 939 | 1,224 | 1,351 | ||
| Fianna Fáil | Tom Kavanagh | 651 | 655 | 659 | 675 | 701 | 775 | 783 | ||||
| Fine Gael | Joan Maher | 608 | 679 | 741 | 780 | 812 | 840 | 1,240 | 1,314 | 1,322 | ||
| Fianna Fáil | Eugene Rudden | 479 | 484 | 488 | 497 | 527 | ||||||
| Fine Gael | Muriel O Tiarnaigh | 467 | 490 | 511 | 521 | 541 | 553 | |||||
| Independent | Paul Arnold | 364 | 373 | 397 | 476 | |||||||
| Workers' Party | Eugene O'Leary | 263 | 266 | 322 | ||||||||
| Labour | Tony Dermody | 230 | 235 | |||||||||
| Electorate: 14,314 Valid: 6,932 (48.9%) Spoilt: 68 Quota: 1,387 Turnout: 7,000 | ||||||||||||
Malahide
| Party | Candidate | FPv% | Count | |||||||
|---|---|---|---|---|---|---|---|---|---|---|
| 1 | 2 | 3 | 4 | 5 | 6 | 7 | ||||
| Fianna Fáil | G.V. Wright | 1,724 | ||||||||
| Labour | Bernie Malone* | 1,091 | 1,123 | 1,222 | 1,245 | 1,385 | 1,690 | |||
| Fine Gael | Nora OwenTD* | 905 | 931 | 953 | 980 | 1,394 | ||||
| Fianna Fáil | Vincent Hughes | 760 | 792 | 827 | 910 | 1,002 | 1,060 | 1,127 | ||
| Fine Gael | Tom Houlihan | 678 | 681 | 702 | 707 | |||||
| Fianna Fáil | Pat Dunne* | 674 | 800 | 823 | 974 | 993 | 1,133 | 1,218 | ||
| Independent | Michael Howard | 557 | 592 | 679 | 712 | 743 | ||||
| Fianna Fáil | Linda Rafferty | 253 | 325 | 337 | ||||||
| Green Alliance | Colm O Caomhanaigh | 161 | 165 | |||||||
| Independent | Joe McDermott | 147 | 150 | |||||||
| Electorate: 12,671 Valid: 6,950 (55.12%) Spoilt: 35 Quota: 1,391 Turnout: 6,985 | ||||||||||
Mulhuddart
| Party | Candidate | FPv% | Count | |||||||
|---|---|---|---|---|---|---|---|---|---|---|
| 1 | 2 | 3 | 4 | 5 | 6 | 7 | ||||
| Fianna Fáil | Jim Fahey | 1,203 | ||||||||
| Fianna Fáil | Marian McGennis | 755 | 767 | 788 | 841 | 1,027 | 1,082 | 1,129 | ||
| Workers' Party | Ollie Lunney | 693 | 740 | 764 | 813 | 990 | 1,039 | 1,043 | ||
| Fine Gael | Marian Sheehan | 582 | 604 | 779 | 1,098 | 1,293 | ||||
| Independent | Seán Lyons | 521 | 540 | 576 | 626 | |||||
| Fine Gael | Tom Reynolds | 414 | 425 | 483 | ||||||
| Fine Gael | Liam Skelly | 303 | 322 | |||||||
| Labour | Michael Martin | 135 | ||||||||
| Electorate: 10,480 Valid: 4,606 (44.35%) Spoilt: 42 Quota: 1,152 Turnout: 4,648 | ||||||||||
Swords
| Party | Candidate | FPv% | Count | ||||
|---|---|---|---|---|---|---|---|
| 1 | 2 | 3 | 4 | ||||
| Fianna Fáil | Ray BurkeTD | 2,335 | |||||
| Labour | Seán Ryan* | 1,308 | |||||
| Fianna Fáil | Cyril Gallagher* | 739 | 1,229 | 1,316 | |||
| Fine Gael | Anne Devitt | 652 | 701 | 788 | 1,258 | ||
| Fine Gael | Paddy Donovan | 504 | 532 | 592 | |||
| Workers' Party | Shane McManus | 416 | 449 | ||||
| Fianna Fáil | Oliver Dennis | 727 | 849 | 950 | 1,014 | ||
| Electorate: 13,877 Valid: 6,336 (46.26%) Spoilt: 83 Quota: 1,268 Turnout: 6,419 | |||||||
Clondalkin
| Party | Candidate | FPv% | Count | |||||||||
|---|---|---|---|---|---|---|---|---|---|---|---|---|
| 1 | 2 | 3 | 4 | 5 | 6 | 7 | 8 | 9 | ||||
| Fianna Fáil | Mary HarneyTD* | 2,098 | ||||||||||
| Fianna Fáil | Colm McGrath | 1,111 | 1,210 | 1,227 | 1,232 | 1,304 | 1,332 | 1,375 | 1,420 | 1,560 | ||
| Fine Gael | Therese Ridge | 631 | 646 | 660 | 695 | 751 | 846 | 901 | 1,541 | 1,660 | ||
| Fianna Fáil | Noel Hayes | 618 | 768 | 780 | 789 | 823 | 882 | 974 | 994 | 1,204 | ||
| Fine Gael | Leon Hennessy | 597 | 613 | 626 | 635 | 667 | 730 | 773 | ||||
| Sinn Féin | Hugh Boyle | 573 | 582 | 593 | 604 | 640 | 687 | 932 | 946 | |||
| Workers' Party | Anne Finnegan | 481 | 487 | 499 | 532 | 579 | 681 | |||||
| Independent | Paul Price | 296 | 305 | 322 | 334 | |||||||
| Labour | Eugene Fitzsimons | 289 | 294 | 360 | 501 | 522 | ||||||
| Labour | Robert Dowds | 219 | 223 | 263 | ||||||||
| Labour | Declan O Broin | 197 | 204 | |||||||||
| Electorate: 15,983 Valid: 7,110 (44.97%) Spoilt: 78 Quota: 1,778 Turnout: 7,188 | ||||||||||||
Greenhills
| Party | Candidate | FPv% | Count | |||||||
|---|---|---|---|---|---|---|---|---|---|---|
| 1 | 2 | 3 | 4 | 5 | 6 | 7 | ||||
| Fianna Fáil | Chris Flood | 2,183 | ||||||||
| Fine Gael | Senator Larry McMahon* | 768 | 822 | 862 | 880 | 993 | 1,030 | 1,465 | ||
| Workers' Party | Terry Delaney | 742 | 782 | 852 | 864 | 994 | 1,190 | 1,262 | ||
| Independent | Gerry Jago | 588 | 726 | 781 | 793 | 851 | 917 | 952 | ||
| Fine Gael | Therese McGarry | 516 | 543 | 558 | 564 | 654 | 659 | |||
| Sinn Féin | Cliona Nic Mhurchu | 489 | 501 | 527 | 532 | 555 | ||||
| Fianna Fáil | Padraig Lynch | 443 | 841 | 877 | 1,179 | 1,225 | 1,314 | 1,370 | ||
| Labour | Kevin Forsyth | 429 | 450 | 494 | 512 | |||||
| Fianna Fáil | Richard Raymond | 227 | 362 | 386 | ||||||
| Independent | Sammy Macken | 220 | 233 | |||||||
| Green Alliance | Patricia Greene | 100 | 103 | |||||||
| Electorate: 14,967 Valid: 6,705 (45.41%) Spoilt: 94 Quota: 1,342 Turnout: 6,797 | ||||||||||
Lucan
| Party | Candidate | FPv% | Count | |||||||
|---|---|---|---|---|---|---|---|---|---|---|
| 1 | 2 | 3 | 4 | 5 | 6 | 7 | ||||
| Fianna Fáil | Liam LawlorTD* | 1,827 | ||||||||
| Fianna Fáil | Finbarr Hanrahan | 1,091 | 1,126 | 1,145 | 1,182 | 1,643 | 1,715 | 1,937 | ||
| Fine Gael | Brian Fleming* | 1,067 | 1,071 | 1,087 | 1,243 | 1,322 | 1,593 | 1,714 | ||
| Fine Gael | Peter Brady | 991 | 996 | 1,008 | 1,029 | 1,034 | 1,169 | 1,294 | ||
| Workers' Party | Michael Finnegan | 992 | 905 | 981 | 1,038 | 1,058 | 1,129 | |||
| Labour | Michael Gannon* | 887 | 894 | 929 | 1,129 | 1,155 | 1,223 | 1,578 | ||
| Fine Gael | Tommy Morris | 601 | 603 | 609 | 653 | 673 | ||||
| Fianna Fáil | Dave McSweeney | 562 | 589 | 602 | 644 | |||||
| Labour | Michael Brennan | 556 | 557 | 579 | ||||||
| Green Alliance | Joseph Harden | 147 | 148 | |||||||
| Communist Party | Jean Roche | 77 | 77 | |||||||
| Electorate: 17,496 Valid: 8,708 (50.29%) Spoilt: 90 Quota: 1,742 Turnout: 8,798 | ||||||||||
Rathfarnam
| Party | Candidate | FPv% | Count | ||||||||
|---|---|---|---|---|---|---|---|---|---|---|---|
| 1 | 2 | 3 | 4 | 5 | 6 | 7 | 8 | ||||
| Fianna Fáil | Seamus BrennanTD | 1,957 | |||||||||
| Fine Gael | Alan ShatterTD* | 1,611 | |||||||||
| Fine Gael | Mary Muldoon | 867 | 899 | 920 | 1,038 | 1,133 | 1,759 | ||||
| Fianna Fáil | Ann Ormonde | 741 | 964 | 965 | 1,002 | 1,041 | 1,060 | 1,108 | 1,756 | ||
| Fianna Fáil | Stephen Riney | 668 | 756 | 757 | 780 | 819 | 833 | 858 | |||
| Independent | Tom Sharkey | 541 | 557 | 559 | 641 | 873 | 915 | 1,037 | 1,150 | ||
| Fine Gael | Anne D'Alton | 506 | 519 | 536 | 619 | 725 | |||||
| Green Alliance | Fiona Garland | 465 | 475 | 476 | 582 | ||||||
| Labour | Marie Woods | 460 | 471 | 475 | |||||||
| Electorate: 16,535 Valid: 7,816 (47.55%) Spoilt: 46 Quota: 1,564 Turnout: 7,862 | |||||||||||
Tallaght-Oldbawn
| Party | Candidate | FPv% | Count | ||||||||||||
|---|---|---|---|---|---|---|---|---|---|---|---|---|---|---|---|
| 1 | 2 | 3 | 4 | 5 | 6 | 7 | 8 | 9 | 10 | 11 | 12 | ||||
| Fianna Fáil | John Hannon | 1,146 | 1,150 | 1,160 | 1,179 | 1,199 | 1,231 | 1,278 | 1,308 | 1,383 | 1,781 | ||||
| Fianna Fáil | Jim Barry | 848 | 851 | 863 | 890 | 899 | 913 | 951 | 1,016 | 1,263 | 1,633 | ||||
| Fianna Fáil | Sean Basquille | 782 | 785 | 791 | 803 | 824 | 881 | 893 | 923 | 978 | |||||
| Sinn Féin | Stan Clarke | 608 | 615 | 620 | 650 | 656 | 668 | 698 | 870 | ||||||
| Fine Gael | Breda Cass | 582 | 593 | 608 | 624 | 741 | 837 | 904 | 947 | 990 | 1,082 | 1,162 | 1,184 | ||
| Fine Gael | Jim Higgins | 504 | 511 | 525 | 556 | 714 | 783 | 895 | 980 | 1,070 | 1,112 | 1,144 | 1,157 | ||
| Workers' Party | Brian McCabe | 381 | 401 | 414 | 494 | 501 | 560 | 632 | |||||||
| Fine Gael | Seamus Murphy | 348 | 361 | 370 | 382 | ||||||||||
| Democratic Socialist | Eamonn Maloney | 308 | 323 | 331 | |||||||||||
| Independent | Mary Kearney | 306 | 329 | 337 | 395 | 411 | 437 | ||||||||
| Labour | Tony Deegan | 255 | 262 | 362 | 390 | 404 | |||||||||
| Labour | Anne Kinsella | 189 | 202 | ||||||||||||
| Green Alliance | Freda O'Neill | 131 | |||||||||||||
| Electorate: 14,687 Valid: 6,388 (44.1%) Spoilt: 89 Quota: 1,598 Turnout: 6,477 | |||||||||||||||
Tallaght-Rathcoole
| Party | Candidate | FPv% | Count | |||||||||
|---|---|---|---|---|---|---|---|---|---|---|---|---|
| 1 | 2 | 3 | 4 | 5 | 6 | 7 | 8 | 9 | ||||
| Fianna Fáil | Seán WalshTD* | 1,139 | 1,141 | 1,156 | 1,163 | 1,256 | 1,293 | 1,374 | 1,434 | 1,533 | ||
| Labour | Mervyn TaylorTD* | 944 | 960 | 996 | 1,030 | 1,054 | 1,348 | 1,726 | ||||
| Workers' Party | Pat Rabbitte | 917 | 925 | 991 | 1,003 | 1,039 | 1,065 | 1,087 | 1,135 | 1,547 | ||
| Sinn Féin | John Noonan | 794 | 796 | 837 | 852 | 882 | 922 | 948 | 961 | |||
| Fianna Fáil | Charlie O'Connor | 722 | 727 | 738 | 746 | 937 | 954 | 990 | 1,017 | 1,141 | ||
| Labour | Austin Nolan | 473 | 480 | 489 | 492 | 501 | ||||||
| Fine Gael | Brid Hayes | 439 | 445 | 448 | 605 | 610 | 674 | |||||
| Fianna Fáil | Mary Morton | 361 | 364 | 396 | 399 | |||||||
| Fine Gael | Frank Farrell | 238 | 240 | 242 | ||||||||
| Independent | Stephen Mahon | 225 | 229 | |||||||||
| Green Alliance | Kate O'Brien | 57 | ||||||||||
| Electorate: 12,980 Valid: 6,309 (49.18%) Spoilt: 74 Quota: 1,578 Turnout: 6,383 | ||||||||||||
Terenure
| Party | Candidate | FPv% | Count | |||||||||||
|---|---|---|---|---|---|---|---|---|---|---|---|---|---|---|
| 1 | 2 | 3 | 4 | 5 | 6 | 7 | 8 | 9 | 10 | 11 | ||||
| Fine Gael | Stanley Laing* | 2,017 | ||||||||||||
| Fianna Fáil | Sean Ardagh | 1,356 | 1,362 | 1,371 | 1,417 | 1,440 | 1,466 | 1,495 | 1,513 | 1,789 | ||||
| Fianna Fáil | Seamus McGowan | 1,120 | 1,128 | 1,133 | 1,195 | 1,230 | 1,253 | 1,305 | 1,325 | 1,639 | 2,372 | |||
| Fianna Fáil | Gerry Mullally | 858 | 866 | 871 | 906 | 916 | 925 | 937 | 965 | 1,074 | ||||
| Independent | Seamus Ashe | 760 | 765 | 809 | 871 | 885 | 1,048 | 1,127 | 1,149 | 1,202 | 1,256 | 1,395 | ||
| Fianna Fáil | Sonny Knowles | 724 | 728 | 735 | 766 | 772 | 789 | 854 | 872 | |||||
| Fine Gael | Martin Lynch | 708 | 824 | 853 | 865 | 909 | 929 | 978 | 1,627 | 1,662 | 1,770 | |||
| Fine Gael | Declan Ryan* | 612 | 676 | 694 | 704 | 771 | 787 | 851 | ||||||
| Labour | Eamonn Walsh | 583 | 589 | 600 | 614 | 720 | 802 | 1,172 | 1,220 | 1,252 | 1,281 | 1,335 | ||
| Labour | Tom Murtagh | 549 | 554 | 562 | 576 | 679 | 760 | |||||||
| Workers' Party | Shay Kelly | 388 | 390 | 437 | 453 | 475 | ||||||||
| Labour | Katherine Maguire | 385 | 402 | 425 | 442 | |||||||||
| Independent | Michael J. Stokes | 310 | 315 | 335 | ||||||||||
| Green Alliance | Denis Deasy | 228 | 232 | |||||||||||
| Electorate: 23,022 Valid: 10,598 (46.46%) Spoilt: 93 Quota: 1,767 Turnout: 10,695 | ||||||||||||||
Ballybrack
| Party | Candidate | FPv% | Count | |||||||||||||
|---|---|---|---|---|---|---|---|---|---|---|---|---|---|---|---|---|
| 1 | 2 | 3 | 4 | 5 | 6 | 7 | 8 | 9 | 10 | 11 | 12 | 13 | ||||
| Fine Gael | Donal Marren | 1,226 | 1,245 | 1,269 | 1,276 | 1,293 | 1,383 | 1,435 | 1,791 | |||||||
| Fianna Fáil | Richard Conroy | 1,191 | 1,194 | 1,204 | 1,316 | 1,348 | 1,362 | 1,403 | 1,415 | 1,419 | 1,671 | |||||
| Fianna Fáil | Owen Hammond | 859 | 861 | 864 | 960 | 1,014 | 1,024 | 1,062 | 1,090 | 1,096 | 1,393 | 1,540 | 1,641 | |||
| Workers' Party | Eamon Gilmore | 848 | 866 | 899 | 902 | 1,043 | 1,057 | 1,100 | 1,108 | 1,111 | 1,170 | 1,297 | 1,301 | 1,314 | ||
| Labour | Frank Smyth | 763 | 859 | 892 | 897 | 935 | 964 | 997 | 1,043 | 1,061 | 1,102 | 1,267 | 1,270 | 1,279 | ||
| Fianna Fáil | David Kane | 607 | 612 | 620 | 690 | 713 | 723 | 749 | 756 | 758 | ||||||
| Fine Gael | Steve Nalty | 605 | 610 | 618 | 624 | 628 | 653 | 727 | ||||||||
| Independent | Pat O'Reilly | 561 | 567 | 609 | 617 | 663 | 671 | 851 | 911 | 923 | 954 | |||||
| Fine Gael | Barbara Culleton | 554 | 558 | 580 | 590 | 592 | 865 | 937 | 1,123 | 1,306 | 1,332 | 1,566 | ||||
| Independent | Joan Callaghan | 483 | 497 | 531 | 539 | 560 | 585 | |||||||||
| Fine Gael | Jim Ansbro | 469 | 479 | 491 | 492 | 501 | ||||||||||
| Sinn Féin | Mick O'Brien | 454 | 456 | 461 | 465 | |||||||||||
| Fianna Fáil | Mary Gray | 322 | 324 | 331 | ||||||||||||
| Green Alliance | Philip Kearney | 245 | 248 | |||||||||||||
| Labour | Tim Wilson | 165 | ||||||||||||||
| Independent | Victor Boyhan | 25 | ||||||||||||||
| Electorate: 20,774 Valid: 9,377 (45.46%) Spoilt: 66 Quota: 1,563 Turnout: 9,443 | ||||||||||||||||
Blackrock
| Party | Candidate | FPv% | Count | ||||||
|---|---|---|---|---|---|---|---|---|---|
| 1 | 2 | 3 | 4 | 5 | 6 | ||||
| Fine Gael | John H. Dockrell* | 1,328 | 1,340 | 1,379 | 1,456 | 1,475 | 1,705 | ||
| Fianna Fáil | Paddy Madigan | 1,121 | 1,149 | 1,185 | 1,233 | 1,435 | 1,526 | ||
| Fine Gael | Aine Elliot* | 1,119 | 1,127 | 1,213 | 1,288 | 1,316 | 1,632 | ||
| Fianna Fáil | Anne Brady* | 1,113 | 1,130 | 1,185 | 1,220 | 1,661 | |||
| Fianna Fáil | Michael Cotter | 693 | 715 | 745 | 767 | ||||
| Fine Gael | William O'Grady | 663 | 688 | 734 | 774 | 789 | |||
| Labour | Niamh Bhreathnach | 577 | 618 | 757 | 1,080 | 1,111 | 1,190 | ||
| Labour | Kevin Cronin | 548 | 589 | 651 | |||||
| Green Alliance | Betty Reeves | 476 | 564 | ||||||
| Workers' Party | Eamonn Daly | 312 | |||||||
| Electorate: 18,849 Valid: 7,950 (42.59%) Spoilt: 77 Quota: 1,591 Turnout: 8,027 | |||||||||
Clonskeagh
| Party | Candidate | FPv% | Count | |||||||
|---|---|---|---|---|---|---|---|---|---|---|
| 1 | 2 | 3 | 4 | 5 | 6 | 7 | ||||
| Fine Gael | Tom Hand* | 1,784 | ||||||||
| Fianna Fáil | Seamus Brock | 1,165 | 1,179 | 1,197 | 1,253 | 1,282 | 1,330 | 1,599 | ||
| Fine Gael | Gina Menzies | 888 | 1,037 | 1,055 | 1,073 | 1,200 | 1,510 | 1,573 | ||
| Fianna Fáil | Pól MacMurchú | 800 | 806 | 812 | 820 | 839 | 871 | 1,254 | ||
| Fianna Fáil | Paul McNulty | 662 | 672 | 677 | 690 | 732 | 765 | |||
| Green Alliance | Ingrid Masterson | 370 | 375 | 377 | 433 | |||||
| Workers' Party | Gerry Nolan | 249 | 254 | 267 | ||||||
| Labour | Peter Nolan | 246 | 254 | 346 | 440 | 578 | ||||
| Labour | Willie Byrne | 149 | 157 | |||||||
| Electorate: 14,231 Valid: 6,313 (44.85%) Spoilt: 70 Quota: 1,579 Turnout: 6,383 | ||||||||||
Dundrum
| Party | Candidate | FPv% | Count | ||||||||
|---|---|---|---|---|---|---|---|---|---|---|---|
| 1 | 2 | 3 | 4 | 5 | 6 | 7 | 8 | ||||
| Fianna Fáil | Tom Kitt* | 2,509 | |||||||||
| Fianna Fáil | Tony Fox | 782 | 1,205 | 1,219 | 1,302 | 1,374 | 1,393 | 2,058 | |||
| Labour | Frank Buckley* | 730 | 786 | 853 | 898 | 1,130 | 1,213 | 1,264 | 1,358 | ||
| Fine Gael | Mary Elliott | 662 | 707 | 744 | 749 | 815 | 1,109 | 1,211 | 1,290 | ||
| Fine Gael | Austin Corcoran | 642 | 699 | 724 | 735 | 760 | 985 | 1,051 | 1,113 | ||
| Fine Gael | Myles Tierney* | 564 | 616 | 631 | 634 | 672 | |||||
| Fianna Fáil | Trevor Matthews | 505 | 845 | 859 | 883 | 932 | 962 | ||||
| Workers' Party | Eamonn O Liadhain | 435 | 460 | 520 | 615 | ||||||
| Sinn Féin | Don Begley | 313 | 331 | 342 | |||||||
| Green Alliance | Murrough Lacy | 201 | 207 | ||||||||
| Independent | Gabriel McGovern | 59 | 65 | ||||||||
| Electorate: 15,568 Valid: 7,402 (47.9%) Spoilt: 53 Quota: 1,481 Turnout: 7,457 | |||||||||||
Dún Laoghaire
| Party | Candidate | FPv% | Count | |||||||||||||||
|---|---|---|---|---|---|---|---|---|---|---|---|---|---|---|---|---|---|---|
| 1 | 2 | 3 | 4 | 5 | 6 | 7 | 8 | 9 | 10 | 11 | 12 | 13 | 14 | 15 | ||||
| Fine Gael | Liam T. CosgraveTD | 2,456 | ||||||||||||||||
| Fianna Fáil | Betty Coffey | 1,110 | 1,119 | 1,125 | 1,132 | 1,151 | 1,160 | 1,198 | 1,211 | 1,362 | 1,387 | 1,403 | 1,424 | 1,435 | 1,791 | 1,873 | ||
| Sinn Féin | Kevin Fitzpatrick | 1,063 | 1,070 | 1,077 | 1,080 | 1,086 | 1,098 | 1,112 | 1,235 | 1,266 | 1,307 | 1,321 | 1,342 | 1,345 | 1,387 | 1,483 | ||
| Fianna Fáil | Bill Harvey* | 1,057 | 1,061 | 1,066 | 1,074 | 1,080 | 1,093 | 1,097 | 1,134 | 1,249 | 1,306 | 1,331 | 1,345 | 1,353 | 1,887 | 1,993 | ||
| Fine Gael | Brendan Henderson* | 857 | 951 | 958 | 966 | 984 | 998 | 1,023 | 1,037 | 1,057 | 1,160 | 1,503 | 2,243 | |||||
| Fianna Fáil | Adrian Hardiman | 854 | 859 | 865 | 867 | 870 | 877 | 887 | 905 | 1,052 | 1,074 | 1,080 | 1,098 | 1,111 | ||||
| Labour | Jane Dillon-Byrne* | 700 | 715 | 727 | 760 | 787 | 837 | 932 | 994 | 1,007 | 1,179 | 1,238 | 1,310 | 1,408 | 1,471 | 2,041 | ||
| Labour | Eric Doyle* | 663 | 679 | 684 | 701 | 707 | 723 | 755 | 814 | 831 | 974 | 1,001 | 1,052 | 1,133 | 1,169 | |||
| Fine Gael | John O'Sullivan | 575 | 623 | 623 | 636 | 648 | 661 | 685 | 696 | 699 | 735 | |||||||
| Labour | Jack Loughran* | 524 | 531 | 534 | 564 | 566 | 584 | 600 | 670 | 683 | ||||||||
| Fine Gael | Elizabeth Gregan | 503 | 508 | 510 | 510 | 515 | 518 | 529 | 552 | |||||||||
| Fine Gael | Mark Crimmins | 435 | 642 | 646 | 650 | 679 | 687 | 725 | 741 | 766 | 784 | 998 | ||||||
| Workers' Party | Aidan Kendrick | 406 | 409 | 415 | 416 | 423 | 471 | 520 | ||||||||||
| Green Alliance | Theresa Butterfield | 287 | 289 | 305 | 310 | 357 | 401 | |||||||||||
| Democratic Socialist | Christy Hudson | 241 | 242 | 250 | 254 | 263 | ||||||||||||
| Independent | Victor Boyhan | 202 | 202 | 212 | 212 | |||||||||||||
| Labour | Philip Murphy | 134 | 136 | 136 | ||||||||||||||
| Independent | Ubi Dwyer | 101 | 102 | |||||||||||||||
| Electorate: 27,482 Valid: 12,168 (44.72%) Spoilt: 123 Quota: 2,029 Turnout: 12,291 | ||||||||||||||||||
Glencullen
| Party | Candidate | FPv% | Count | ||||||||
|---|---|---|---|---|---|---|---|---|---|---|---|
| 1 | 2 | 3 | 4 | 5 | 6 | 7 | 8 | ||||
| Fianna Fáil | Edward McDonald | 1,271 | 1,275 | 1,290 | 1,351 | 1,499 | 1,516 | 2,036 | |||
| Fianna Fáil | Jimmy Murphy | 1,042 | 1,040 | 1,066 | 1,072 | 1,117 | 1,159 | 1,407 | 1,742 | ||
| Fine Gael | Sam Carroll* | 881 | 888 | 931 | 1,009 | 1,066 | 1,423 | 1,551 | 1,563 | ||
| Fianna Fáil | Larry Butler | 855 | 856 | 877 | 891 | 932 | 962 | ||||
| Fine Gael | Jim Gildea | 827 | 834 | 867 | 974 | 1,037 | 1,401 | 1,432 | 1,436 | ||
| Fine Gael | Joseph Curry | 684 | 686 | 731 | 794 | 840 | |||||
| Workers' Party | Denis O'Callaghan | 419 | 423 | 485 | 581 | ||||||
| Labour | Justin Kilcullen | 357 | 430 | 478 | |||||||
| Green Alliance | Alison Badrian | 296 | 298 | ||||||||
| Labour | Roger Cole | 105 | |||||||||
| Electorate: 14,499 Valid: 6,737 (46.83%) Spoilt: 53 Quota: 1,685 Turnout: 6,790 | |||||||||||
Stillorgan
| Party | Candidate | FPv% | Count | ||||||
|---|---|---|---|---|---|---|---|---|---|
| 1 | 2 | 3 | 4 | 5 | 6 | ||||
| Labour | Eithne Fitzgerald* | 1,328 | 1,352 | 1,411 | 1,464 | 1,513 | 1,735 | ||
| Fianna Fáil | Paddy Hickey* | 1,228 | 1,243 | 1,266 | 1,268 | 1,458 | 1,505 | ||
| Fianna Fáil | Don Lydon | 1,211 | 1,234 | 1,276 | 1,293 | 1,557 | 1,638 | ||
| Fine Gael | Olivia Mitchell | 1,013 | 1,035 | 1,073 | 1,356 | 1,393 | 1,489 | ||
| Fine Gael | Donal Lowry | 942 | 957 | 1,002 | 1,190 | 1,210 | 1,266 | ||
| Fianna Fáil | Carmel Ryan | 546 | 558 | 591 | 598 | ||||
| Fine Gael | Chris O'Malley | 537 | 543 | 571 | |||||
| Green Alliance | Joseph Thornton | 429 | 472 | 607 | 617 | 638 | |||
| Independent | Fred O'Brien | 391 | 442 | ||||||
| Independent | M. MacFeorais | 219 | |||||||
| Electorate: 17,976 Valid: 7,844 (43.91%) Spoilt: 50 Quota: 1,569 Turnout: 7,894 | |||||||||
External links
This article is issued from Wikipedia. The text is licensed under Creative Commons - Attribution - Sharealike. Additional terms may apply for the media files.