1985 Kerry County Council election
An election to Kerry County Council took place on 20 June 1985 as part of that year's Irish local elections. 27 councillors were elected from five electoral divisions by PR-STV voting.
| |||||||||||||||||||||||||||||||||
All 27 seats to Kerry County Council | |||||||||||||||||||||||||||||||||
|---|---|---|---|---|---|---|---|---|---|---|---|---|---|---|---|---|---|---|---|---|---|---|---|---|---|---|---|---|---|---|---|---|---|
| |||||||||||||||||||||||||||||||||
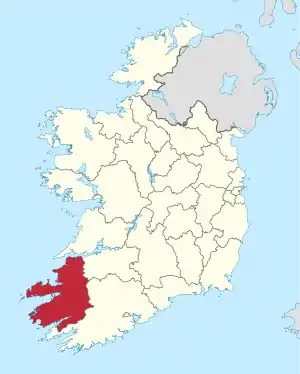 Map showing the area of Kerry County Council | |||||||||||||||||||||||||||||||||
| |||||||||||||||||||||||||||||||||
Results by party
| Party | Seats | ± | First Pref. votes | FPv% | ±% | |
|---|---|---|---|---|---|---|
| Fianna Fáil | 13 | 30,011 | 46.72% | |||
| Fine Gael | 7 | 15,401 | 23.98% | |||
| Labour | 3 | 7,095 | 11.05% | |||
| Sinn Féin | 0 | 3,381 | 5.26% | |||
| Workers' Party | 0 | 1,569 | 2.44% | |||
| Independent | 4 | 6,776 | 10.55% | |||
| Totals | 27 | 64,233 | 100% | |||
Results by Electoral Area
Killarney
| Party | Candidate | FPv% | Count | ||||||||
|---|---|---|---|---|---|---|---|---|---|---|---|
| 1 | 2 | 3 | 4 | 5 | 6 | 7 | 8 | ||||
| Fianna Fáil | John O'Leary TD | 16.64% | 2,504 | ||||||||
| Fianna Fáil | Tom Fleming* | 15.80% | 2,377 | ||||||||
| Fianna Fáil | Jackie Healy-Rae* | 14.71% | 2,213 | ||||||||
| Labour | Michael Gleeson* | 11.49% | 1,729 | 1,756 | 1,773 | 1,780 | 1,887 | 2,021 | 2,159 | ||
| Fianna Fáil | P.J. Cronin* | 8.39% | 1,262 | 1,462 | 1,582 | 1,609 | 1,647 | 1,676 | 1,802 | 2,057 | |
| Fine Gael | Thomas Dennehy | 7.11% | 1,070 | 1,083 | 1,123 | 1,125 | 1,231 | 1,416 | 1,472 | 1,574 | |
| Fine Gael | Christy McSweeney* | 6.77% | 1,018 | 1,035 | 1,055 | 1,059 | 1,233 | 1,474 | 1,557 | 1,805 | |
| Workers' Party | Sean O'Grady | 6.56% | 987 | 1,029 | 1,037 | 1,044 | 1,105 | 1,139 | 1,343 | ||
| Independent | Redmond Sullivan | 4.45% | 670 | 699 | 714 | 719 | 741 | 779 | |||
| Fine Gael | Tom Randles | 4.15% | 625 | 635 | 638 | 647 | 712 | ||||
| Fine Gael | Paudie O'Connor* | 3.94% | 593 | 609 | 613 | 615 | |||||
| Electorate: 19,651 Valid: 15,048 (76.58%) Spoilt: 178 (1.17%) Quota: 2,150 Turnout: 15,226 (77.48%) | |||||||||||
Killorglin
| Party | Candidate | FPv% | Count | ||||||||||
|---|---|---|---|---|---|---|---|---|---|---|---|---|---|
| 1 | 2 | 3 | 4 | 5 | 6 | 7 | 8 | 9 | 10 | ||||
| Fianna Fáil | John O'Donoghue* | 17.00% | 2,215 | ||||||||||
| Fine Gael | Michael Connor-Scarteen* | 11.81% | 1,539 | 1,542 | 1,543 | 1,547 | 1,566 | 1,637 | 1,964 | ||||
| Fianna Fáil | Thomas Cahill* | 10.27% | 1,338 | 1,403 | 1,425 | 1,448 | 1,487 | 1,530 | 1,895 | ||||
| Fine Gael | Danny Kissane* | 9.93% | 1,293 | 1,296 | 1,319 | 1,347 | 1,365 | 1,505 | 1,513 | 1,521 | 1,577 | 1,627 | |
| Fine Gael | Dan Barry | 9.45% | 1,231 | 1,304 | 1,306 | 1,308 | 1,346 | 1,512 | 1,525 | 1,532 | 2,012 | ||
| Independent | Michael Ahern | 8.61% | 1,122 | 1,135 | 1,154 | 1,206 | 1,267 | 1,395 | 1,411 | 1,419 | 1,657 | 1,738 | |
| Fianna Fáil | Teddy O'Connor* | 7.60% | 990 | 1,051 | 1,063 | 1,076 | 1,118 | 1,168 | 1,310 | 1,354 | 1,468 | 1,488 | |
| Independent | Michael O'Connell* | 7.10% | 925 | 979 | 989 | 1,000 | 1,113 | 1,219 | 1,241 | 1,277 | |||
| Fianna Fáil | Jackie Cahill | 6.83% | 890 | 931 | 938 | 939 | 961 | 981 | |||||
| Labour | Michael Doyle | 5.50% | 717 | 740 | 748 | 764 | 801 | ||||||
| Sinn Féin | Dave O'Shea Sinn Féin | 1.96% | 255 | 259 | 261 | 270 | |||||||
| Sinn Féin | Derek McKenna | 1.67% | 217 | 228 | 230 | 231 | |||||||
| Workers' Party | Paddy Callaghan | 1.30% | 169 | 170 | 177 | ||||||||
| Independent | Dan O'Connor | 0.96% | 125 | 127 | |||||||||
| Electorate: 17,751 Valid: 13,026 (73.38%) Spoilt: 165 (1.25%) Quota: 1,861 Turnout: 13,191 (74.31%) | |||||||||||||
Listowel
| Party | Candidate | FPv% | Count | |||||
|---|---|---|---|---|---|---|---|---|
| 1 | 2 | 3 | 4 | 5 | ||||
| Fine Gael | Senator Jimmy Deenihan | 20.27% | 3,123 | |||||
| Fianna Fáil | Dan Kiely* | 15.99% | 2,463 | |||||
| Fianna Fáil | Eamonn Walsh* | 12.23% | 1,884 | 2,008 | 2,127 | 2,195 | 2,553 | |
| Fianna Fáil | Noel Brassil* | 12.00% | 1,849 | 1,872 | 1,910 | 1,916 | 2,154 | |
| Fine Gael | Eamonn Barry | 11.24% | 1,731 | 2,216 | ||||
| Labour | John Joe O'Sullivan | 11.00% | 1,694 | 1,764 | 1,777 | 2,055 | 2,130 | |
| Sinn Féin | Jerry Walsh* | 9.56% | 1,473 | 1,562 | 1,588 | 1,673 | 1,747 | |
| Fianna Fáil | Jack Stack | 4.73% | 728 | 795 | 849 | 868 | ||
| Labour | Con Scanlon | 3.00% | 462 | 525 | 536 | |||
| Electorate: 20,984 Valid: 15,407 (73.42%) Spoilt: 166 (1.07%) Quota: 2,202 Turnout: 15,573 (74.21%) | ||||||||
Mid-Kerry
| Party | Candidate | FPv% | Count | |||||||
|---|---|---|---|---|---|---|---|---|---|---|
| 1 | 2 | 3 | 4 | 5 | 6 | 7 | ||||
| Fianna Fáil | Tom McEllistrim, Jnr TD | 19.89% | 2,239 | |||||||
| Independent | James Courtney* | 15.57% | 1,753 | 1,779 | 1,912 | |||||
| Fine Gael | Michael Begley TD* | 12.75% | 1,436 | 1,439 | 1,463 | 1,660 | 1,665 | 2,369 | ||
| Independent | Breandán Mac Gearailt* | 11.80% | 1,329 | 1,335 | 1,401 | 1,467 | 1,484 | 1,547 | 1,666 | |
| Fianna Fáil | Thomas Fitzgerald* | 11.08% | 1,248 | 1,313 | 1,358 | 1,408 | 1,414 | 1,439 | 1,483 | |
| Fianna Fáil | Michael Long* | 8.54% | 961 | 1,150 | 1,237 | 1,342 | 1,346 | 1,638 | 1,764 | |
| Fine Gael | Bobby O'Connell | 8.46% | 953 | 977 | 1,012 | 1,310 | 1,313 | |||
| Labour | Michael Moynihan TD | 6.96% | 784 | 805 | 873 | |||||
| Sinn Féin | Matt Lee | 4.94% | 556 | 584 | ||||||
| Electorate: 15,376 Valid: 11,259 (73.22%) Spoilt: 106 (0.93%) Quota: 1,877 Turnout: 11,365 (73.91%) | ||||||||||
Tralee
| Party | Candidate | FPv% | Count | ||||||
|---|---|---|---|---|---|---|---|---|---|
| 1 | 2 | 3 | 4 | 5 | 6 | ||||
| Fianna Fáil | Denis Foley TD* | 32.67% | 3,101 | ||||||
| Labour | Meave Spring | 18.00% | 1,709 | 1,872 | 1,964 | ||||
| Fianna Fáil | Ted Fitzgerald | 12.03% | 1,142 | 1,575 | 1,670 | 1,680 | 1,808 | 2,379 | |
| Sinn Féin | Sean O'Callaghan | 9.27% | 880 | 971 | 1,060 | 1,071 | 1,101 | 1,175 | |
| Independent | John Blennerhassett* | 8.98% | 852 | 974 | 1,059 | 1,081 | 1,519 | 1,686 | |
| Fine Gael | Sean Shanahan | 8.31% | 789 | 827 | 852 | 863 | |||
| Fianna Fáil | Pauline Fuller* | 6.39% | 607 | 879 | 904 | 914 | 995 | ||
| Workers' Party | Donal Tobin | 4.35% | 413 | 496 | |||||
| Electorate: 14,535 Valid: 9,493 (65.31%) Spoilt: 124 (1.29%) Quota: 1,899 Turnout: 9,617 (66.16%) | |||||||||
External links
- Department of the Environment, Ireland (2010-01-28). "Local elections, 1985 : election results and transfer of votes in respect of each county, and county borough council : and election statistics relating to all local authorities" (PDF). Department of the Environment. Retrieved 2019-10-28.
- "Old Local Election Results". Irish Election Literature. Retrieved 2019-10-28.
This article is issued from Wikipedia. The text is licensed under Creative Commons - Attribution - Sharealike. Additional terms may apply for the media files.