1985 Mayo County Council election
An election to Mayo County Council took place on 20 June 1985 as part of that year's Irish local elections. 31 councillors were elected from seven electoral divisions by PR-STV voting for a five-year term of office.
| |||||||||||||||||
All 31 seats to Mayo County Council | |||||||||||||||||
|---|---|---|---|---|---|---|---|---|---|---|---|---|---|---|---|---|---|
| |||||||||||||||||
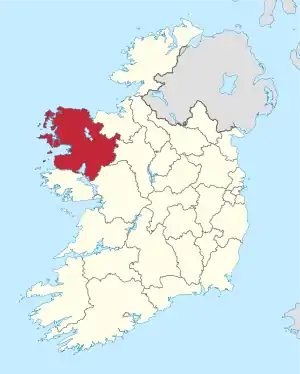 Map showing the area of Mayo County Council | |||||||||||||||||
| |||||||||||||||||
Results by party
| Party | Seats | ± | First Pref. votes | FPv% | ±% | |
|---|---|---|---|---|---|---|
| Fianna Fáil | 15 | - | 31,615 | 52.61% | ||
| Fine Gael | 14 | -2 | 23,402 | 38.94% | ||
| Independent | 2 | +2 | 3,814 | 6.35% | ||
| Totals | 31 | - | 60,097 | 100% | — | |
Results by Electoral Area
Ballina
| Party | Candidate | FPv% | Count | ||||||
|---|---|---|---|---|---|---|---|---|---|
| 1 | 2 | 3 | 4 | 5 | 6 | ||||
| Fianna Fáil | Sean CallearyTD* | 2,240 | |||||||
| Fianna Fáil | Padraic Bourke* | 1,605 | |||||||
| Fine Gael | Eddie Staunton* | 1,386 | 1,450 | 1,740 | |||||
| Fine Gael | Frank Devaney* | 1,351 | 1,385 | 1,612 | |||||
| Fianna Fáil | Stephen Molloy | 1,192 | 1,328 | 1,348 | 1,355 | 1,374 | 1,393 | ||
| Fine Gael | John Kelly* | 1,089 | 1,144 | 1,387 | 1,568 | ||||
| Fianna Fáil | Bridie Greavey* | 1,046 | 1,366 | 1,416 | 1,423 | 1,466 | 1,518 | ||
| Fine Gael | Ernie Caffrey | 827 | 924 | ||||||
| Electorate: 15,882 Valid: 10,736 (68.01%) Spoilt: 65 Quota: 1,534 Turnout: 10,801 | |||||||||
Castlebar
| Party | Candidate | FPv% | Count | ||||||||
|---|---|---|---|---|---|---|---|---|---|---|---|
| 1 | 2 | 3 | 4 | 5 | 6 | 7 | 8 | ||||
| Independent | Frank Durcan* | 2,053 | |||||||||
| Fianna Fáil | Padraig FlynnTD* | 1,790 | |||||||||
| Fine Gael | Enda KennyTD* | 1,480 | 1,563 | 1,574 | 1,594 | 1,753 | |||||
| Fine Gael | Paddy Burke* | 1,242 | 1,276 | 1,286 | 1,345 | 1,382 | 1,384 | 1,897 | |||
| Fianna Fáil | Richard Morrin* | 991 | 1,045 | 1,066 | 1,103 | 1,212 | 1,239 | 1,284 | 1,490 | ||
| Fianna Fáil | Kevin O'Toole | 863 | 869 | 870 | 938 | 955 | 957 | 969 | 1,330 | ||
| Fine Gael | Henry Kenny | 640 | 687 | 694 | 699 | 745 | 748 | ||||
| Fianna Fáil | Al McDonnell | 598 | 606 | 611 | 737 | 750 | 756 | 769 | |||
| Labour | Johnny Mee | 389 | 439 | 491 | 510 | ||||||
| Fianna Fáil | David Kelly | 338 | 350 | 351 | |||||||
| Labour | Michael Kilcoyne | 112 | 121 | ||||||||
| Electorate: 14,250 Valid: 10,496 (74.21%) Spoilt: 79 Quota: 1,750 Turnout: 10,575 | |||||||||||
Claremorris
| Party | Candidate | FPv% | Count | |||||||||
|---|---|---|---|---|---|---|---|---|---|---|---|---|
| 1 | 2 | 3 | 4 | 5 | 6 | 7 | 8 | 9 | ||||
| Fianna Fáil | P.J. MorleyTD* | 1,783 | ||||||||||
| Independent | Martin Finn* | 1,725 | 1,765 | |||||||||
| Fine Gael | Jim HigginsTD* | 1,717 | 1,799 | |||||||||
| Fine Gael | Michael Raftery* | 1,423 | 1,428 | 1,428 | 1,428 | 1,428 | 1,440 | 1,444 | 1,496 | 1,604 | ||
| Fianna Fáil | Jack Heneghan* | 1,406 | 1,413 | 1,413 | 1,415 | 1,415 | 1,421 | 1,448 | 1,641 | 1,667 | ||
| Fianna Fáil | Sean Fitzpatrick* | 1,074 | 1,081 | 1,083 | 1,097 | 1,100 | 1,184 | 1,509 | 1,745 | |||
| Fianna Fáil | Pat McHugh | 962 | 1,012 | 1,020 | 1,033 | 1,049 | 1,073 | 1,125 | 1,257 | 1,319 | ||
| Fine Gael | Jim Mannion | 892 | 949 | 967 | 968 | 975 | 1,132 | 1,134 | 1,255 | 1,648 | ||
| Fianna Fáil | Michael Mellett | 749 | 753 | 755 | 760 | 761 | 777 | 814 | ||||
| Fianna Fáil | Thomas Charlton | 674 | 676 | 677 | 692 | 692 | 700 | |||||
| Fine Gael | Madeline Maloney | 636 | 648 | 660 | 662 | 663 | 850 | 1,006 | 1,025 | |||
| Fine Gael | Pa Connolly | 467 | 521 | 547 | 548 | 551 | ||||||
| Fine Gael | Edward T. Griffith | 294 | ||||||||||
| Fine Gael | Patrick Griffith | 36 | ||||||||||
| Electorate: 18,829 Valid: 13,838 (69.41%) Spoilt: 107 Quota: 1,730 Turnout: 13,945 | ||||||||||||
Killala
| Party | Candidate | FPv% | Count | |||
|---|---|---|---|---|---|---|
| 1 | 2 | 3 | ||||
| Fianna Fáil | Tim Quinn* | 1,490 | ||||
| Fianna Fáil | Padraig Cosgrove | 1,269 | 1,453 | |||
| Fine Gael | John Noel Carey* | 1,182 | 1,671 | |||
| Fianna Fáil | David O'Connor* | 1,085 | 1,103 | 1,111 | ||
| Fine Gael | Vinnie Munnelly* | 982 | 1,055 | 1,349 | ||
| Fine Gael | Patrick Lavelle | 834 | ||||
| Electorate: 9,434 Valid: 6,842 (73.22%) Spoilt: 66 Quota: 1,369 Turnout: 6,908 | ||||||
Swinford
| Party | Candidate | FPv% | Count | |||||
|---|---|---|---|---|---|---|---|---|
| 1 | 2 | 3 | 4 | 5 | ||||
| Fianna Fáil | Padraig Gavin* | 1,967 | ||||||
| Fianna Fáil | Patsy Dunne* | 1,289 | 1,486 | |||||
| Fine Gael | John Flannery* | 1,153 | 1,176 | 1,221 | 1,394 | 1,399 | ||
| Fianna Fáil | Oliver Flannery | 1,019 | 1,153 | 1,319 | 1,389 | 1,390 | ||
| Fine Gael | Sean McEvoy* | 910 | 972 | 1,023 | 1,491 | |||
| Fine Gael | John McNicholas | 698 | 750 | 789 | ||||
| Sinn Féin | Joe McHale | 388 | 402 | |||||
| Electorate: 10,977 Valid: 7,424 (65.23%) Spoilt: 104 Quota: 1,485 Turnout: 7,528 | ||||||||
Westport
| Party | Candidate | FPv% | Count | ||||||
|---|---|---|---|---|---|---|---|---|---|
| 1 | 2 | 3 | 4 | 5 | 6 | ||||
| Fianna Fáil | Senator Martin J. O'Toole* | 2,191 | |||||||
| Fianna Fáil | Frank Chambers* | 1,538 | 1,637 | 1,663 | 1,731 | 1,816 | |||
| Fine Gael | Patrick Durcan | 1,492 | 1,540 | 1,679 | 1,740 | 2,367 | |||
| Fine Gael | Pat Kilbane* | 1,407 | 1,411 | 1,424 | 1,425 | 1,564 | 1,896 | ||
| Fianna Fáil | Pat Conway* | 1,309 | 1,325 | 1,327 | 1,444 | 1,460 | 1,465 | ||
| Fianna Fáil | Seamus Hughes | 1,124 | 1,261 | 1,304 | 1,399 | 1,551 | 1,642 | ||
| Fine Gael | Ted McHale* | 1,011 | 1,044 | 1,127 | 1,148 | ||||
| Sinn Féin | Mary McGing | 377 | 392 | 407 | |||||
| Fine Gael | John Morahan | 285 | 357 | ||||||
| Electorate: 13,881 Valid: 10,761 (78.28%) Spoilt: 105 Quota: 1,794 Turnout: 10,866 | |||||||||
External links
- Official website
- Irishelectionliterature
- Department of the Environment, Ireland (2010-01-28). "Local elections, 1985 : election results and transfer of votes in respect of each county, and county borough council : and election statistics relating to all local authorities" (PDF). Department of the Environment. Retrieved 2019-10-28.
| Preceded by 1979 Mayo County Council election |
Mayo County Council elections | Succeeded by 1991 Mayo County Council election |
This article is issued from Wikipedia. The text is licensed under Creative Commons - Attribution - Sharealike. Additional terms may apply for the media files.