1985 Waterford City Council election
An election to Waterford City Council took place on 20 June 1985 as part of that year's Irish local elections. 15 councillors were elected from three electoral divisions by PR-STV voting for a six-year term of office.
| |||||||||||||||||||||||||||||||||
All 15 seats to Waterford City Council | |||||||||||||||||||||||||||||||||
|---|---|---|---|---|---|---|---|---|---|---|---|---|---|---|---|---|---|---|---|---|---|---|---|---|---|---|---|---|---|---|---|---|---|
| |||||||||||||||||||||||||||||||||
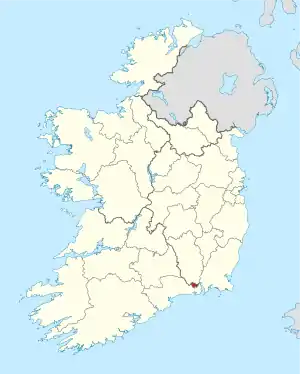 Map showing the area of Waterford City Council | |||||||||||||||||||||||||||||||||
| |||||||||||||||||||||||||||||||||
Results by party
| Party | Seats | ± | First Pref. votes | FPv% | ±% | |
|---|---|---|---|---|---|---|
| Fianna Fáil | 5 | - | 4,347 | 30.18% | ||
| Fine Gael | 4 | - | 3,309 | 22.97% | ||
| Workers' Party | 2 | - | 1,488 | 10.33% | ||
| Labour | 2 | - | 1,346 | 9.35% | ||
| Independent | 2 | - | 3,674 | 25.51% | ||
| Totals | 15 | - | 14,403 | 100% | — | |
Results by Electoral Area
Waterford No.1
| Waterford No.1 - 5 seats | ||||||||||||||
|---|---|---|---|---|---|---|---|---|---|---|---|---|---|---|
| Party | Candidate | FPv% | Count 1 | Count 2 | Count 3 | Count 4 | Count 5 | Count 6 | Count 7 | Count 8 | Count 9 | Count 10 | ||
| Fianna Fáil | Patrick Power* | 776 | 785 | 795 | 815 | 904 | ||||||||
| Fine Gael | Hilary Quinlan | 727 | 794 | 801 | 823 | 845 | ||||||||
| Fine Gael | James Brett | 612 | 665 | 668 | 679 | 688 | 690 | 702 | 765 | 768 | 802 | |||
| Workers' Party | Davy Walsh* | 455 | 459 | 605 | 660 | 668 | 675 | 756 | 826 | 829 | 848 | |||
| Independent | Martin Cullen | 350 | 364 | 376 | 411 | 432 | 435 | 475 | 546 | 547 | 598 | |||
| Fianna Fáil | Tony Roche | 335 | 344 | 350 | 362 | 410 | 438 | 471 | 506 | 511 | 773 | |||
| Fianna Fáil | Larry Dower | 315 | 323 | 325 | 334 | 336 | 392 | 412 | 443 | 444 | ||||
| Labour | George Wadding | 275 | 287 | 295 | 313 | 333 | 337 | 353 | ||||||
| Sinn Féin | Noel Ryan | 273 | 273 | 278 | 292 | 296 | 298 | |||||||
| Fianna Fáil | Ann O'Rourke | 236 | 243 | 251 | 271 | |||||||||
| Independent | Mick Dunphy† | 222 | 227 | 236 | ||||||||||
| Workers' Party | Billy McCarthy | 217 | 219 | |||||||||||
| Fine Gael | Ann Raleigh | 193 | ||||||||||||
| Electorate: 8,788 Valid: 4,986 (57.31%) Spoilt: 50 Quota: 832 Turnout: 5,036 | ||||||||||||||
Waterford No.2
| Waterford No.2 - 5 seats | |||||||||||||
|---|---|---|---|---|---|---|---|---|---|---|---|---|---|
| Party | Candidate | FPv% | Count 1 | Count 2 | Count 3 | Count 4 | Count 5 | Count 6 | Count 7 | Count 8 | Count 9 | ||
| Independent | Davy Daniels* | 937 | |||||||||||
| Fine Gael | Senator Katharine Bulbulia | 658 | 664 | 677 | 701 | 730 | 778 | 866 | |||||
| Labour | Liam Curham* | 634 | 663 | 681 | 749 | 789 | 826 | 899 | |||||
| Fianna Fáil | Brendan Kenneally | 547 | 555 | 569 | 594 | 706 | 754 | 801 | 820 | 826 | |||
| Fine Gael | Stephen Rogers* | 518 | 524 | 535 | 560 | 579 | 644 | 725 | 742 | 759 | |||
| Fianna Fáil | Donal OrmondeTD | 498 | 504 | 511 | 540 | 609 | 663 | 720 | 734 | 737 | |||
| Independent | Richard Jones* | 297 | 307 | 323 | 345 | 363 | 416 | ||||||
| Independent | Joe Falvey† | 294 | 305 | 318 | |||||||||
| Fine Gael | Mary Griffin | 290 | 300 | 305 | 323 | ||||||||
| Independent | Frank King | 286 | 293 | 300 | 328 | 340 | |||||||
| Workers' Party | Dick McGrath | 116 | |||||||||||
| Electorate: 8,368 Valid: 5,035 (60.4%) Spoilt: 19 Quota: 840 Turnout: 5,054 | |||||||||||||
Waterford No.3
| Waterford No.3 - 5 seats | ||||||||||||||
|---|---|---|---|---|---|---|---|---|---|---|---|---|---|---|
| Party | Candidate | FPv% | Count 1 | Count 2 | Count 3 | Count 4 | Count 5 | Count 6 | Count 7 | Count 8 | Count 9 | Count 10 | ||
| Independent | Martin O'Regan*† | 889 | ||||||||||||
| Fianna Fáil | Tom Browne* | 653 | 665 | 672 | 678 | 698 | 705 | 731 | ||||||
| Workers' Party | Paddy Gallagher* | 546 | 594 | 604 | 610 | 622 | 739 | |||||||
| Fianna Fáil | Brian Swift* | 471 | 499 | 508 | 513 | 519 | 527 | 552 | 595 | 772 | ||||
| Labour | Brian O'Shea | 437 | 450 | 453 | 460 | 477 | 485 | 506 | 585 | 610 | 625 | |||
| Fine Gael | Maurice Cummins* | 398 | 407 | 408 | 440 | 510 | 512 | 540 | 570 | 594 | 614 | |||
| Fianna Fáil | Paddy Kenneally | 226 | 230 | 232 | 234 | 241 | 242 | 267 | 276 | |||||
| Independent | Paudie Burke | 188 | 202 | 211 | 215 | 220 | 230 | 257 | ||||||
| Independent | William Jones | 164 | 169 | 175 | 178 | 182 | 188 | |||||||
| Workers' Party | Martin Kennedy | 154 | 162 | 167 | 168 | 171 | ||||||||
| Fine Gael | Gerry O'Mahoney | 110 | 113 | 116 | 144 | |||||||||
| Fine Gael | Mary O'Halloran | 93 | 96 | 96 | ||||||||||
| Independent | John Lanigan | 43 | 58 | |||||||||||
| Independent | Paud Sweeney | 4 | 6 | |||||||||||
| Electorate: 8,263 Valid: 4,382 (53.41%) Spoilt: 31 Quota: 731 Turnout: 4,413 | ||||||||||||||
- † Candidates stood under the banner of the Waterford People's Party, a localised split in the Workers Party branch.
External links
- Irishelectionliterature
- Department of the Environment, Ireland (28 January 2010). "Local elections, 1985 : election results and transfer of votes in respect of each county, and county borough council : and election statistics relating to all local authorities" (PDF). Department of the Environment. Retrieved 28 October 2019.
| Preceded by 1979 Waterford City Council election |
Waterford City Council elections | Succeeded by 1991 Waterford City Council election |
This article is issued from Wikipedia. The text is licensed under Creative Commons - Attribution - Sharealike. Additional terms may apply for the media files.