1992 United States presidential election in Maryland
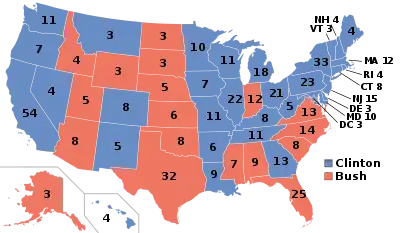
The 1992 United States presidential election in Maryland took place on November 3, 1992, as part of the 1992 United States presidential election. Voters chose 10 representatives, or electors to the Electoral College, who voted for president and vice president.
| |||||||||||||||||||||||||||||||||
| |||||||||||||||||||||||||||||||||
 County Results
| |||||||||||||||||||||||||||||||||
| |||||||||||||||||||||||||||||||||
| Elections in Maryland |
|---|
.svg.png.webp) |
|
|
Maryland was won by Governor Bill Clinton (D-Arkansas) with 49.80%of the popular vote over incumbent President George H. W. Bush (R-Texas) with 35.62%. Businessman Ross Perot (I-Texas) finished in third, with 14.18% of the popular vote.[1] Clinton ultimately won the national vote, defeating incumbent President Bush.[2] Maryland would be one of only three states, along with Washington DC, where if Bush’s and Perot’s vote had been combined, Clinton would still come out on top (albeit by an incredibly slim margin of 63 votes). The other two states are New York and Arkansas.
Results
| 1992 United States presidential election in Maryland[1] | |||||
|---|---|---|---|---|---|
| Party | Candidate | Votes | Percentage | Electoral votes | |
| Democratic | Bill Clinton | 988,571 | 49.80% | 10 | |
| Republican | George H. W. Bush (Incumbent) | 707,094 | 35.62% | 0 | |
| Independent | Ross Perot | 281,414 | 14.18% | 0 | |
| Libertarian | Andre Marrou | 4,715 | 0.24% | 0 | |
| New Alliance | Lenora Fulani | 2,786 | 0.14% | 0 | |
| N/A | Write-ins | 466 | 0.02% | 0 | |
| Totals | 1,985,046 | 100.0% | 10 | ||
Results by county
| County | William Jefferson Clinton Democratic |
George Herbert Walker Bush Republican |
Henry Ross Perot Independent |
Various candidates Other parties |
Margin | Total votes cast | |||||
|---|---|---|---|---|---|---|---|---|---|---|---|
| # | % | # | % | # | % | # | % | # | % | ||
| Allegany | 11,501 | 37.59% | 13,862 | 45.31% | 5,081 | 16.61% | 151 | 0.49% | -2,361 | -7.72% | 30,595 |
| Anne Arundel | 68,629 | 36.97% | 81,467 | 43.89% | 35,191 | 18.96% | 347 | 0.19% | -12,838 | -6.92% | 185,634 |
| Baltimore County | 143,498 | 44.40% | 126,728 | 39.21% | 51,757 | 16.01% | 1,237 | 0.38% | 16,770 | 5.19% | 323,220 |
| Baltimore City | 185,753 | 75.79% | 40,725 | 16.62% | 17,381 | 7.09% | 1,228 | 0.50% | 145,028 | 59.17% | 245,087 |
| Calvert | 8,619 | 37.07% | 10,026 | 43.12% | 4,499 | 19.35% | 105 | 0.45% | -1,407 | -6.05% | 23,249 |
| Caroline | 2,822 | 33.36% | 3,856 | 45.58% | 1,729 | 20.44% | 53 | 0.63% | -1,034 | -12.22% | 8,460 |
| Carroll | 15,447 | 28.12% | 28,405 | 51.71% | 10,965 | 19.96% | 112 | 0.20% | -12,958 | -23.59% | 54,929 |
| Cecil | 10,232 | 37.45% | 10,784 | 39.47% | 6,115 | 22.38% | 188 | 0.69% | -552 | -2.02% | 27,319 |
| Charles | 14,498 | 37.70% | 17,293 | 44.97% | 6,501 | 16.91% | 162 | 0.42% | -2,795 | -7.27% | 38,454 |
| Dorchester | 3,933 | 35.89% | 4,934 | 45.03% | 2,010 | 18.34% | 80 | 0.73% | -1,001 | -9.14% | 10,957 |
| Frederick | 21,848 | 33.77% | 31,290 | 48.37% | 11,373 | 17.58% | 180 | 0.28% | -9,442 | -14.60% | 64,691 |
| Garrett | 2,856 | 26.99% | 5,714 | 54.01% | 1,987 | 18.78% | 23 | 0.22% | -2,858 | -27.01% | 10,580 |
| Harford | 27,164 | 33.67% | 36,350 | 45.05% | 17,002 | 21.07% | 171 | 0.21% | -9,186 | -11.38% | 80,687 |
| Howard | 44,763 | 44.85% | 38,594 | 38.67% | 16,182 | 16.21% | 259 | 0.26% | 6,169 | 6.18% | 99,798 |
| Kent | 3,093 | 40.55% | 3,094 | 40.56% | 1,411 | 18.50% | 30 | 0.39% | -1 | -0.01% | 7,628 |
| Montgomery | 199,757 | 55.09% | 119,705 | 33.01% | 41,971 | 11.57% | 1,180 | 0.33% | 80,052 | 22.08% | 362,613 |
| Prince George's | 168,691 | 65.67% | 62,955 | 24.51% | 23,355 | 9.09% | 1,858 | 0.72% | 105,736 | 41.16% | 256,859 |
| Queen Anne's | 4,668 | 32.16% | 6,829 | 47.05% | 2,958 | 20.38% | 59 | 0.41% | -2,161 | -14.89% | 14,514 |
| Somerset | 3,210 | 40.45% | 3,450 | 43.47% | 1,230 | 15.50% | 46 | 0.58% | -240 | -3.02% | 7,936 |
| St. Mary's | 8,931 | 35.60% | 11,485 | 45.78% | 4,550 | 18.14% | 119 | 0.47% | -2,554 | -10.18% | 25,085 |
| Talbot | 4,642 | 33.86% | 6,774 | 49.42% | 2,233 | 16.29% | 59 | 0.43% | -2,132 | -15.55% | 13,708 |
| Washington | 16,495 | 35.70% | 21,977 | 47.56% | 7,537 | 16.31% | 199 | 0.43% | -5,482 | -11.86% | 46,208 |
| Wicomico | 11,481 | 37.93% | 13,560 | 44.79% | 5,140 | 16.98% | 91 | 0.30% | -2,079 | -6.87% | 30,272 |
| Worcester | 6,040 | 36.48% | 7,237 | 43.70% | 3,256 | 19.66% | 26 | 0.16% | -1,197 | -7.23% | 16,559 |
| Totals | 988,571 | 49.80% | 707,094 | 35.62% | 281,414 | 14.18% | 7,963 | 0.40% | 281,477 | 14.18% | 1,985,042 |
References
- "1992 Presidential Election". Maryland State Board of Elections. Retrieved May 12, 2019.
- "1992 Presidential General Election Results". U.S. Election Atlas. Retrieved 8 June 2012.

.jpg.webp)

