1992 United States presidential election in Wyoming
The 1992 United States presidential election in Wyoming took place on November 3, 1992, as part of the 1992 United States presidential election. Voters chose three representatives, or electors to the Electoral College, who voted for president and vice president.
| |||||||||||||||||||||||||||||||||
| |||||||||||||||||||||||||||||||||
 County Results
| |||||||||||||||||||||||||||||||||
| |||||||||||||||||||||||||||||||||
.jpg.webp)
| Elections in Wyoming |
|---|
 |
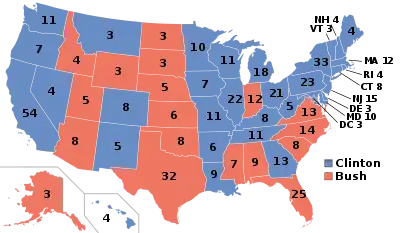
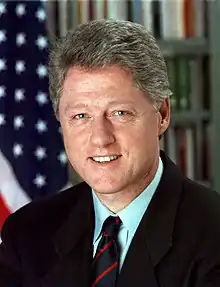
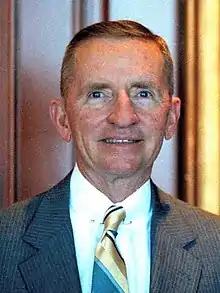
Wyoming was won by incumbent President George H. W. Bush (R-Texas) with 39.70 percent of the popular vote over Governor Bill Clinton (D-Arkansas) with 34.10 percent. Businessman Ross Perot (I-Texas) finished in third, with 25.65 percent of the popular vote.[1] Clinton ultimately won the national vote, defeating incumbent President Bush. This election was the closest result Wyoming had had in presidential election history, since 1948, when it narrowly voted for Harry S. Truman over Thomas E. Dewey.[2]
As of the 2020 presidential election, this is the last election in which Natrona County and Carbon County voted for the Democratic candidate.[3] It was also the first time any Wyoming county had voted for a Democrat since Jimmy Carter won Sweetwater County in 1976, and the first time Teton County voted for a Democratic presidential candidate since it voted for Franklin D. Roosevelt over Wendell Willkie in 1940.[4]
Results
| 1992 United States presidential election in Wyoming[1] | |||||
|---|---|---|---|---|---|
| Party | Candidate | Votes | Percentage | Electoral votes | |
| Republican | George H. W. Bush | 79,347 | 39.70% | 3 | |
| Democratic | Bill Clinton | 68,160 | 34.10% | 0 | |
| Independent | Ross Perot | 51,263 | 25.65% | 0 | |
| Libertarian | Andre Marrou | 844 | 0.42% | 0 | |
| Independent | Lenora Fulani | 270 | 0.14% | 0 | |
| Totals | 199,884 | 100.00% | 3 | ||
Results by county
| County | George H. W. Bush Republican |
William Jefferson Clinton Democratic |
Henry Ross Perot Independent |
Andre Verne Marrou[5] Libertarian |
Leonora Branch Fulani[5] Independent |
Margin | Total votes cast | ||||||
|---|---|---|---|---|---|---|---|---|---|---|---|---|---|
| # | % | # | % | # | % | # | % | # | % | # | % | ||
| Albany | 4,176 | 32.75% | 5,713 | 44.80% | 2,862 | 22.45% | 61 | 0.48% | 27 | 0.21% | -1,537 | -11.97% | 12,751 |
| Big Horn | 2,216 | 47.47% | 1,216 | 26.05% | 1,236 | 26.48% | 16 | 0.34% | 7 | 0.15% | 980[lower-alpha 1] | 20.99% | 4,668 |
| Campbell | 5,315 | 47.64% | 2,709 | 24.28% | 3,133 | 28.08% | 38 | 0.34% | 13 | 0.12% | 2,182[lower-alpha 1] | 19.56% | 11,157 |
| Carbon | 2,320 | 34.96% | 2,737 | 41.24% | 1,579 | 23.79% | 22 | 0.33% | 16 | 0.24% | -417 | -6.28% | 6,636 |
| Converse | 2,159 | 45.68% | 1,307 | 27.66% | 1,260 | 26.66% | 12 | 0.25% | 9 | 0.19% | 852 | 18.03% | 4,726 |
| Crook | 1,377 | 51.71% | 568 | 21.33% | 718 | 26.96% | 14 | 0.53% | 3 | 0.11% | 659[lower-alpha 1] | 24.75% | 2,663 |
| Fremont | 5,387 | 39.19% | 4,765 | 34.66% | 3,594 | 26.15% | 58 | 0.42% | 22 | 0.16% | 622 | 4.52% | 13,746 |
| Goshen | 2,395 | 45.25% | 1,754 | 33.14% | 1,144 | 21.61% | 11 | 0.21% | 9 | 0.17% | 641 | 12.11% | 5,293 |
| Hot Springs | 978 | 41.27% | 740 | 31.22% | 652 | 27.51% | 16 | 0.68% | 4 | 0.17% | 238 | 10.04% | 2,370 |
| Johnson | 1,614 | 51.83% | 656 | 21.07% | 844 | 27.10% | 23 | 0.74% | 8 | 0.26% | 770[lower-alpha 1] | 24.73% | 3,114 |
| Laramie | 12,890 | 40.70% | 12,177 | 38.44% | 6,607 | 20.86% | 126 | 0.40% | 34 | 0.11% | 713 | 2.25% | 31,674 |
| Lincoln | 2,595 | 47.01% | 1,430 | 25.91% | 1,495 | 27.08% | 24 | 0.43% | 6 | 0.11% | 1,100 | 19.93% | 5,520 |
| Natrona | 9,717 | 35.75% | 9,817 | 36.12% | 7,647 | 28.13% | 134 | 0.49% | 31 | 0.11% | -100 | -0.37% | 27,181 |
| Niobrara | 635 | 49.30% | 298 | 23.14% | 355 | 27.56% | 5 | 0.39% | 3 | 0.23% | 280[lower-alpha 1] | 21.74% | 1,288 |
| Park | 5,218 | 46.87% | 2,771 | 24.89% | 3,145 | 28.25% | 40 | 0.36% | 10 | 0.09% | 2,073[lower-alpha 1] | 18.62% | 11,134 |
| Platte | 1,668 | 41.47% | 1,398 | 34.76% | 956 | 23.77% | 23 | 0.57% | 5 | 0.12% | 270 | 6.71% | 4,022 |
| Sheridan | 4,303 | 37.49% | 4,139 | 36.06% | 3,035 | 26.44% | 50 | 0.44% | 24 | 0.21% | 164 | 1.43% | 11,477 |
| Sublette | 1,168 | 46.13% | 536 | 21.17% | 828 | 32.70% | 18 | 0.71% | 2 | 0.08% | 340[lower-alpha 1] | 13.43% | 2,532 |
| Sweetwater | 4,476 | 30.30% | 6,417 | 43.44% | 3,879 | 26.26% | 49 | 0.33% | 13 | 0.09% | -1,941 | -13.14% | 14,772 |
| Teton | 2,854 | 34.33% | 3,120 | 37.53% | 2,340 | 28.15% | 28 | 0.34% | 5 | 0.06% | -266 | -3.20% | 8,314 |
| Uinta | 2,701 | 39.78% | 2,047 | 30.15% | 2,041 | 30.06% | 28 | 0.41% | 11 | 0.16% | 654 | 9.63% | 6,789 |
| Washakie | 1,720 | 43.86% | 1,118 | 28.51% | 1,084 | 27.64% | 46 | 1.17% | 6 | 0.15% | 602 | 15.35% | 3,922 |
| Weston | 1,465 | 48.49% | 727 | 24.06% | 829 | 27.44% | 2 | 0.07% | 2 | 0.07% | 636[lower-alpha 1] | 21.05% | 3,021 |
| Totals | 79,347 | 39.92% | 68,160 | 34.29% | 51,263 | 25.79% | 844 | 0.42% | 270 | 0.14% | 11,187 | 5.63% | 198,770 |
Notes
- In this county where Clinton ran third behind Bush and Perot, margin given is Bush vote minus Perot vote and eprcentage margin Bush percentage minus Perot percentage.
References
- "1992 Presidential General Election Results – Wyoming". U.S. Election Atlas. Retrieved 11 June 2012.
- "1992 Presidential General Election Results". U.S. Election Atlas. Retrieved 11 June 2012.
- Sullivan, Robert David; ‘How the Red and Blue Map Evolved Over the Past Century’; America Magazine in The National Catholic Review; June 29, 2016
- Menendez, Albert J.; The Geography of Presidential Elections in the United States, 1868-2004, pp. 342-343 ISBN 0786422173
- Our Campaigns; WY US President Race, November 03, 1992