1992 United States presidential election in Arkansas
The 1992 United States presidential election in Arkansas took place on November 3, 1992, as part of the 1992 United States presidential election. Voters chose six representatives, or electors to the Electoral College, who voted for president and vice president.
| |||||||||||||||||||||||||||||||||
| |||||||||||||||||||||||||||||||||
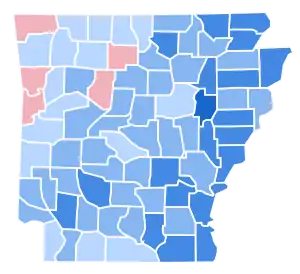
 County Results
| |||||||||||||||||||||||||||||||||
| |||||||||||||||||||||||||||||||||
| Elections in Arkansas |
|---|
 |
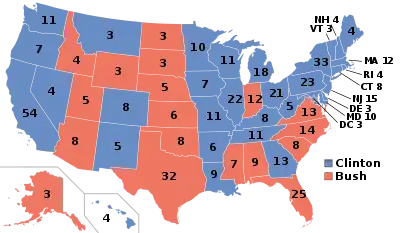
Arkansas was won by the state's governor Bill Clinton (D) with 53.21% of the popular vote over incumbent President George H. W. Bush (R-Texas) with 35.48%. Businessman Ross Perot (I-Texas) finished in third, with 10.43% of the popular vote.[1] Clinton ultimately won the national vote, defeating incumbent President Bush. Clinton was Governor of Arkansas at the time, and as he was popular within the state, he easily won by a margin of 17.73%, making it the first time that Arkansas had voted Democratic since 1976 when it voted for Jimmy Carter. Arkansas and Washington, D.C. were the only contests in which Clinton, or any candidate, received over fifty percent of the popular vote. Clinton carried all but five counties (Benton, Crawford, Pope, Searcy and Sebastian). This is, and remains, the high-water mark for any Democrat in the state since 1948, where the Dixiecrats took three counties and the GOP two against Harry Truman.
After the 1996 election, Arkansas would return to being solidly Republican.[2] As of the 2020 presidential election, this is the last election in which Baxter County, Carroll County, Newton County, Boone County, and Polk County voted for a Democratic presidential candidate.[3]
Arkansas would be one of only three states, along with the District of Columbia, where if Bush’s and Perot’s vote had been combined, Clinton would still come out on top, the others being New York and Maryland.
Results
| 1992 United States presidential election in Arkansas[1] | |||||
|---|---|---|---|---|---|
| Party | Candidate | Votes | Percentage | Electoral votes | |
| Democratic | Bill Clinton | 505,823 | 53.21% | 6 | |
| Republican | George H. W. Bush | 337,324 | 35.48% | 0 | |
| Independent | Ross Perot | 99,132 | 10.43% | 0 | |
| Taxpayers’ | Howard Phillips | 1,437 | 0.15% | 0 | |
| Libertarian | Andre Marrou | 1,261 | 0.13% | 0 | |
| New Alliance Party | Lenora Fulani | 1,022 | 0.11% | 0 | |
| Independent | Jim Boren | 956 | 0.10% | 0 | |
| America First | James "Bo" Gritz | 819 | 0.09% | 0 | |
| Natural Law | Dr. John Hagelin | 764 | 0.08% | 0 | |
| Democrats for Economic Recovery | Lyndon LaRouche | 762 | 0.08% | 0 | |
| Independent | John Yiamouyiannis | 554 | 0.06% | 0 | |
| Prohibition | Earl Dodge | 472 | 0.05% | 0 | |
| Independent | Isabell Masters | 327 | 0.03% | 0 | |
| Totals | 950,683 | 100.0% | 6 | ||
Results by county
| County | William Jefferson Clinton Democratic |
George Herbert Walker Bush Republican |
Henry Ross Perot Independent |
Various candidates Other parties |
Margin | Total votes cast | |||||
|---|---|---|---|---|---|---|---|---|---|---|---|
| # | % | # | % | # | % | # | % | # | % | ||
| Arkansas | 4,709 | 59.01% | 2,594 | 32.51% | 639 | 8.01% | 38 | 0.48% | 2,115 | 26.50% | 7,980 |
| Ashley | 5,876 | 61.42% | 2,686 | 28.08% | 931 | 9.73% | 74 | 0.77% | 3,190 | 33.34% | 9,567 |
| Baxter | 6,991 | 44.44% | 5,640 | 35.85% | 2,938 | 18.68% | 163 | 1.04% | 1,351 | 8.59% | 15,732 |
| Benton | 15,774 | 36.45% | 21,126 | 48.81% | 6,128 | 14.16% | 251 | 0.58% | -5,352 | -12.37% | 43,279 |
| Boone | 6,128 | 42.45% | 6,094 | 42.21% | 2,079 | 14.40% | 136 | 0.94% | 34 | 0.24% | 14,437 |
| Bradley | 2,954 | 61.07% | 1,482 | 30.64% | 391 | 8.08% | 10 | 0.21% | 1,472 | 30.43% | 4,837 |
| Calhoun | 1,389 | 51.41% | 1,047 | 38.75% | 257 | 9.51% | 9 | 0.33% | 342 | 12.66% | 2,702 |
| Carroll | 3,769 | 42.55% | 3,535 | 39.91% | 1,500 | 16.94% | 53 | 0.60% | 234 | 2.64% | 8,857 |
| Chicot | 3,504 | 68.72% | 1,242 | 24.36% | 347 | 6.81% | 6 | 0.12% | 2,262 | 44.36% | 5,099 |
| Clark | 5,767 | 64.64% | 2,403 | 26.93% | 714 | 8.00% | 38 | 0.43% | 3,364 | 37.70% | 8,922 |
| Clay | 4,848 | 68.47% | 1,647 | 23.26% | 568 | 8.02% | 17 | 0.24% | 3,201 | 45.21% | 7,080 |
| Cleburne | 5,090 | 51.00% | 3,580 | 35.87% | 1,263 | 12.66% | 47 | 0.47% | 1,510 | 15.13% | 9,980 |
| Cleveland | 1,893 | 56.04% | 1,127 | 33.36% | 337 | 9.98% | 21 | 0.62% | 766 | 22.68% | 3,378 |
| Columbia | 4,747 | 48.35% | 3,702 | 37.70% | 1,090 | 11.10% | 280 | 2.85% | 1,045 | 10.64% | 9,819 |
| Conway | 4,898 | 57.75% | 2,719 | 32.06% | 803 | 9.47% | 61 | 0.72% | 2,179 | 25.69% | 8,481 |
| Craighead | 13,931 | 54.43% | 9,104 | 35.57% | 2,274 | 8.88% | 287 | 1.12% | 4,827 | 18.86% | 25,596 |
| Crawford | 6,656 | 41.18% | 6,882 | 42.57% | 2,442 | 15.11% | 185 | 1.14% | -226 | -1.40% | 16,165 |
| Crittenden | 9,683 | 56.60% | 5,910 | 34.55% | 848 | 4.96% | 667 | 3.90% | 3,773 | 22.05% | 17,108 |
| Cross | 4,058 | 58.09% | 2,303 | 32.97% | 602 | 8.62% | 23 | 0.33% | 1,755 | 25.12% | 6,986 |
| Dallas | 2,107 | 53.68% | 1,458 | 37.15% | 345 | 8.79% | 15 | 0.38% | 649 | 16.54% | 3,925 |
| Desha | 3,815 | 67.87% | 1,279 | 22.75% | 392 | 6.97% | 135 | 2.40% | 2,536 | 45.12% | 5,621 |
| Drew | 3,748 | 59.51% | 1,938 | 30.77% | 596 | 9.46% | 16 | 0.25% | 1,810 | 28.74% | 6,298 |
| Faulkner | 13,000 | 51.56% | 9,491 | 37.64% | 2,437 | 9.66% | 287 | 1.14% | 3,509 | 13.92% | 25,215 |
| Franklin | 3,217 | 47.76% | 2,495 | 37.04% | 987 | 14.65% | 37 | 0.55% | 722 | 10.72% | 6,736 |
| Fulton | 2,827 | 59.69% | 1,258 | 26.56% | 631 | 13.32% | 20 | 0.42% | 1,569 | 33.13% | 4,736 |
| Garland | 18,811 | 52.26% | 12,886 | 35.80% | 3,475 | 9.65% | 823 | 2.29% | 5,925 | 16.46% | 35,995 |
| Grant | 3,190 | 51.47% | 2,272 | 36.66% | 702 | 11.33% | 34 | 0.55% | 918 | 14.81% | 6,198 |
| Greene | 7,541 | 61.20% | 3,510 | 28.49% | 1,213 | 9.84% | 58 | 0.47% | 4,031 | 32.71% | 12,322 |
| Hempstead | 5,476 | 61.38% | 2,387 | 26.75% | 1,022 | 11.45% | 37 | 0.41% | 3,089 | 34.62% | 8,922 |
| Hot Spring | 6,308 | 59.42% | 3,036 | 28.60% | 1,209 | 11.39% | 63 | 0.59% | 3,272 | 30.82% | 10,616 |
| Howard | 2,764 | 55.56% | 1,728 | 34.73% | 466 | 9.37% | 17 | 0.34% | 1,036 | 20.82% | 4,975 |
| Independence | 7,083 | 55.16% | 4,232 | 32.96% | 1,444 | 11.25% | 81 | 0.63% | 2,851 | 22.20% | 12,840 |
| Izard | 3,419 | 61.18% | 1,532 | 27.42% | 606 | 10.84% | 31 | 0.55% | 1,887 | 33.77% | 5,588 |
| Jackson | 4,944 | 65.71% | 1,864 | 24.77% | 673 | 8.94% | 43 | 0.57% | 3,080 | 40.94% | 7,524 |
| Jefferson | 21,819 | 68.85% | 7,525 | 23.74% | 2,067 | 6.52% | 281 | 0.89% | 14,294 | 45.10% | 31,692 |
| Johnson | 3,951 | 52.14% | 2,563 | 33.82% | 1,013 | 13.37% | 51 | 0.67% | 1,388 | 18.32% | 7,578 |
| Lafayette | 2,273 | 57.12% | 1,188 | 29.86% | 504 | 12.67% | 14 | 0.35% | 1,085 | 27.27% | 3,979 |
| Lawrence | 4,146 | 59.84% | 2,124 | 30.65% | 636 | 9.18% | 23 | 0.33% | 2,022 | 29.18% | 6,929 |
| Lee | 3,436 | 67.82% | 1,293 | 25.52% | 308 | 6.08% | 29 | 0.57% | 2,143 | 42.30% | 5,066 |
| Lincoln | 2,805 | 64.53% | 1,142 | 26.27% | 390 | 8.97% | 10 | 0.23% | 1,663 | 38.26% | 4,347 |
| Little River | 3,327 | 58.18% | 1,483 | 25.94% | 890 | 15.56% | 18 | 0.31% | 1,844 | 32.25% | 5,718 |
| Logan | 3,995 | 45.99% | 3,408 | 39.23% | 1,220 | 14.04% | 64 | 0.74% | 587 | 6.76% | 8,687 |
| Lonoke | 7,963 | 50.32% | 6,253 | 39.52% | 1,554 | 9.82% | 54 | 0.34% | 1,710 | 10.81% | 15,824 |
| Madison | 2,415 | 45.76% | 2,238 | 42.41% | 598 | 11.33% | 26 | 0.49% | 177 | 3.35% | 5,277 |
| Marion | 2,757 | 44.15% | 2,023 | 32.39% | 1,327 | 21.25% | 138 | 2.21% | 734 | 11.75% | 6,245 |
| Miller | 7,050 | 48.21% | 5,273 | 36.06% | 2,249 | 15.38% | 51 | 0.35% | 1,777 | 12.15% | 14,623 |
| Mississippi | 10,046 | 62.94% | 4,697 | 29.43% | 981 | 6.15% | 238 | 1.49% | 5,349 | 33.51% | 15,962 |
| Monroe | 2,578 | 60.35% | 1,324 | 30.99% | 355 | 8.31% | 15 | 0.35% | 1,254 | 29.35% | 4,272 |
| Montgomery | 1,904 | 51.29% | 1,205 | 32.46% | 576 | 15.52% | 27 | 0.73% | 699 | 18.83% | 3,712 |
| Nevada | 2,242 | 56.79% | 1,217 | 30.83% | 455 | 11.52% | 34 | 0.86% | 1,025 | 25.96% | 3,948 |
| Newton | 1,765 | 42.59% | 1,730 | 41.75% | 608 | 14.67% | 41 | 0.99% | 35 | 0.84% | 4,144 |
| Ouachita | 7,411 | 59.69% | 3,711 | 29.89% | 1,238 | 9.97% | 55 | 0.44% | 3,700 | 29.80% | 12,415 |
| Perry | 1,906 | 54.39% | 1,162 | 33.16% | 412 | 11.76% | 24 | 0.68% | 744 | 21.23% | 3,504 |
| Phillips | 6,456 | 65.63% | 2,695 | 27.40% | 634 | 6.45% | 52 | 0.53% | 3,761 | 38.23% | 9,837 |
| Pike | 2,168 | 51.23% | 1,577 | 37.26% | 472 | 11.15% | 15 | 0.35% | 591 | 13.97% | 4,232 |
| Poinsett | 5,341 | 62.31% | 2,425 | 28.29% | 761 | 8.88% | 44 | 0.51% | 2,916 | 34.02% | 8,571 |
| Polk | 3,162 | 43.81% | 2,757 | 38.20% | 1,225 | 16.97% | 73 | 1.01% | 405 | 5.61% | 7,217 |
| Pope | 7,704 | 43.13% | 8,056 | 45.10% | 1,989 | 11.14% | 113 | 0.63% | -352 | -1.97% | 17,862 |
| Prairie | 2,366 | 59.81% | 1,154 | 29.17% | 434 | 10.97% | 2 | 0.05% | 1,212 | 30.64% | 3,956 |
| Pulaski | 79,482 | 58.03% | 47,789 | 34.89% | 8,751 | 6.39% | 935 | 0.68% | 31,693 | 23.14% | 136,957 |
| Randolph | 3,921 | 62.10% | 1,766 | 27.97% | 578 | 9.15% | 49 | 0.78% | 2,155 | 34.13% | 6,314 |
| St. Francis | 6,548 | 61.57% | 3,289 | 30.93% | 766 | 7.20% | 32 | 0.30% | 3,259 | 30.64% | 10,635 |
| Saline | 12,671 | 49.38% | 10,105 | 39.38% | 2,751 | 10.72% | 134 | 0.52% | 2,566 | 10.00% | 25,661 |
| Scott | 2,228 | 48.84% | 1,695 | 37.15% | 610 | 13.37% | 29 | 0.64% | 533 | 11.68% | 4,562 |
| Searcy | 1,679 | 42.14% | 1,772 | 44.48% | 503 | 12.63% | 30 | 0.75% | -93 | -2.33% | 3,984 |
| Sebastian | 16,570 | 41.78% | 16,817 | 42.40% | 6,023 | 15.19% | 249 | 0.63% | -247 | -0.62% | 39,659 |
| Sevier | 2,558 | 51.05% | 1,592 | 31.77% | 643 | 12.83% | 218 | 4.35% | 966 | 19.28% | 5,011 |
| Sharp | 3,761 | 52.27% | 2,486 | 34.55% | 921 | 12.80% | 28 | 0.39% | 1,275 | 17.72% | 7,196 |
| Stone | 2,622 | 52.03% | 1,672 | 33.18% | 697 | 13.83% | 48 | 0.95% | 950 | 18.85% | 5,039 |
| Union | 8,786 | 47.29% | 7,305 | 39.32% | 1,919 | 10.33% | 570 | 3.07% | 1,481 | 7.97% | 18,580 |
| Van Buren | 3,819 | 51.88% | 2,612 | 35.48% | 888 | 12.06% | 42 | 0.57% | 1,207 | 16.40% | 7,361 |
| Washington | 22,029 | 46.01% | 20,292 | 42.38% | 5,304 | 11.08% | 255 | 0.53% | 1,737 | 3.63% | 47,880 |
| White | 10,494 | 48.67% | 8,538 | 39.60% | 2,366 | 10.97% | 165 | 0.77% | 1,956 | 9.07% | 21,563 |
| Woodruff | 2,589 | 74.08% | 676 | 19.34% | 227 | 6.49% | 3 | 0.09% | 1,913 | 54.74% | 3,495 |
| Yell | 4,165 | 54.49% | 2,506 | 32.79% | 940 | 12.30% | 32 | 0.42% | 1,659 | 21.71% | 7,643 |
| Totals | 505,823 | 53.21% | 337,324 | 35.48% | 99,132 | 10.43% | 8,374 | 0.88% | 168,499 | 17.72% | 950,653 |
References
- "State of Arkansas Historical Election Results". Arkansas Office of the Secretary of State. Archived from the original on 2012-09-02. Retrieved 8 June 2012.
- "1992 Presidential General Election Results". U.S. Election Atlas. Retrieved 8 June 2012.
- Sullivan, Robert David; ‘How the Red and Blue Map Evolved Over the Past Century’; America Magazine in The National Catholic Review; June 29, 2016

.jpg.webp)

